Fractal Levels based on Higher TF with BB Filter
- Indicators
- Sergei Iakovlev
- Version: 1.0
- Activations: 5
Fractal Levels based on Higher TF with BB Filter — this tool is designed to build precise support and resistance levels based on higher timeframe fractals filtered by the Bollinger Bands indicator. It provides buy and sell signals with convenient alerts.
How it works:
The indicator analyzes fractal levels filtered by the Bollinger Bands indicator on the higher timeframe and displays them on your current chart. You can easily adjust the higher timeframe in the indicator settings to achieve maximum precision and alignment with your strategies.
Advantages of using Fractal Levels based on Higher TF with BB Filter:
-
Filtering false signals:
Levels are formed only when the fractal is beyond the outer Bollinger Band (volatility breakout). By adjusting the Bollinger Bands parameters, you can control the indicator's sensitivity to buy and sell signals. -
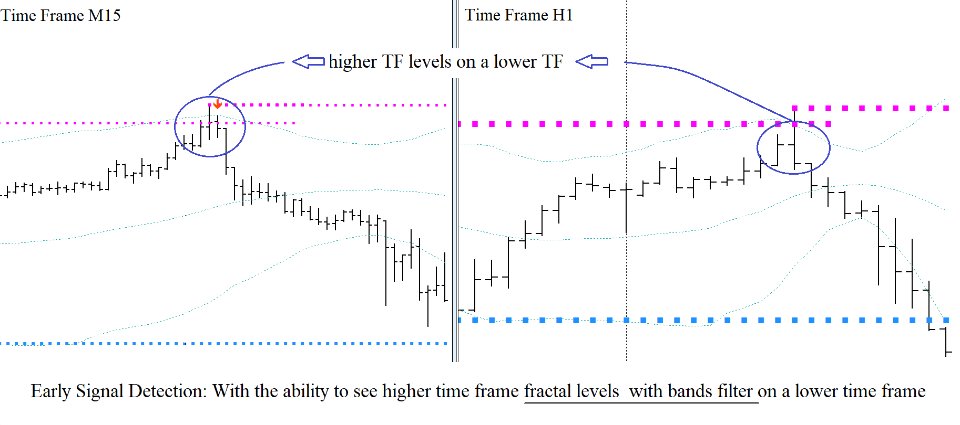
Early signal detection:
By being able to see higher timeframe fractal levels on a lower timeframe, you can identify potential buy and sell signals at their earliest stages. -
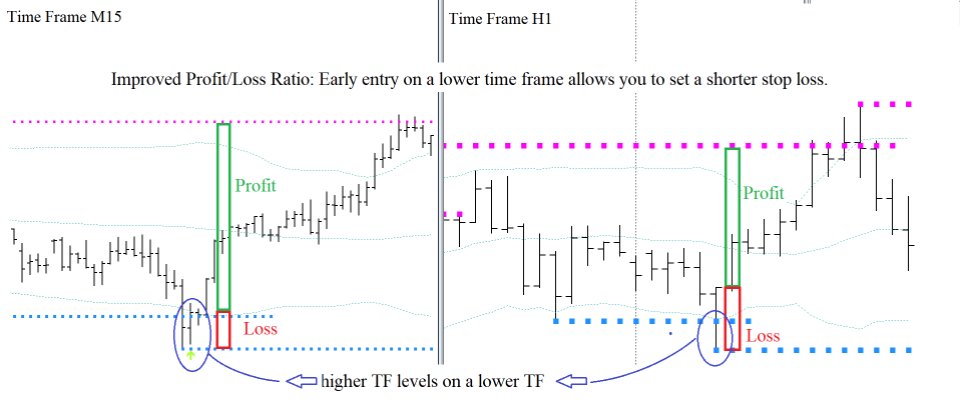
Improved risk/reward ratio:
Early entry on a lower timeframe allows you to set a tighter stop-loss, significantly increasing your trading efficiency. -
Convenient alerts:
Never miss an important signal — receive instant notifications about entry and exit opportunities. -
Increased accuracy of analysis:
Focus on key levels that truly matter and avoid paying attention to unnecessary market noise.
How to use?
-
In the indicator's menu, specify the higher timeframe (Higher Timeframe) from which the levels will be plotted on the current timeframe. This will allow you to anticipate market reversals and make trades before the higher timeframe candle is fully formed, improving your risk/reward ratio.
-
Adjust the Period BB Higher Timeframe, Shift, and Deviation parameters to better suit current market conditions and generate more reliable signals.
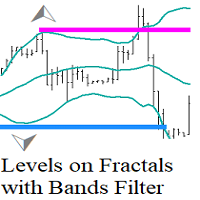
When a fractal forms beyond the outer Bollinger Band (volatility breakout), it indicates that the price has reached an extreme level and may reverse its direction. These levels can be used as support and resistance.
If a fractal forms above the upper Bollinger Band, it may indicate a resistance level, and if it forms below the lower band, it may signal a support level.
This indicator can be useful for traders who use strategies based on support and resistance levels, as well as those who prefer trading at market extremes.
Input parameters:
- Higher Timeframe — the period of the higher timeframe.
- Period BB Higher Timeframe — the moving average period on the higher timeframe.
- Shift — the horizontal shift of the indicator.
- Deviation — the number of standard deviations.


