Watch the Market tutorial videos on YouTube
How to buy а trading robot or an indicator
Run your EA on
virtual hosting
virtual hosting
Test аn indicator/trading robot before buying
Want to earn in the Market?
How to present a product for a sell-through

Unfortunately, "ZigZag Medvedev" is not available for purchasing anymore.
If you have purchased this product before, you can continue using it without any limitations and install new copies as longs as you have activations left:
- Open your MetaTrader 4 terminal.
- Specify your MQL5.community account credentials in the settings: menu Tools\Options\Community.
- Go to the "Market" tab and then to the "Purchased" tab.
- Click "Install" button located to the right of the product name.
For more information, please see the documentation.
Check out other MetaTrader 4 apps

Forex EA Trading Channel on MQL5: Join my MQL5 channel to update the latest news from me
ONLY 3 COPIES OUT OF 10 LEFT AT $399! After that, the price will be raised to $499.
- REAL SIGNAL (Real Signal active for over 6 months): Default Setting: https://www.mql5.com/en/signals/2276213 Gold Scalping AI is an EA that uses artificial intelligence technology to analyze data of many indicators. From there, EA will have the best option to enter orders. The biggest difference of Gold Scalping AI i

The GBPUSD Robot MT4 is an advanced automated trading system meticulously designed for the specific dynamics of the GBP/USD currency pair. Utilizing advanced technical analysis, the robot assesses historical and real-time data to identify potential trends , key support and resistance levels, and other relevant market signals specific to GBP/USD. The Robot opens positions every day, from Monday to Friday, and all positions are secured with Take Profit, Stop Loss, Trailing Stop, Break-Even

Introducing Quantum Emperor EA , the groundbreaking MQL5 expert advisor that's transforming the way you trade the prestigious GBPUSD pair! Developed by a team of experienced traders with trading experience of over 13 years.
IMPORTANT! After the purchase please send me a private message to receive the installation manual and the setup instructions.
***Buy Quantum Emperor EA and you could get Quantum Wizard or Quantum StarMan or Quantum Gold Emperor for free !*** Ask in private for more detail

The Bitcoin Robot MT4 is engineered to execute Bitcoin trades with unparalleled efficiency and precision . Developed by a team of experienced traders and developers, our Bitcoin Robot employs a sophisticated algorithmic approach (price action, trend as well as two personalized indicators) to analyze market and execute trades swiftly with M5 timeframe , ensuring that you never miss out on lucrative opportunities. No grid, no martingale, no hedging, EA only open one position at the sa

CyNera: Your Trading, Our Technology Signals >400%: CyNera Signals >500%: CyNera Turbo Manual & set files: contact me after purchase to receive the manual and set files Price: The price increases based on the number of licenses sold Available copies: 4 Trading gold, one of the most volatile instruments in the market, demands precision, in-depth analysis, and strong risk management. CyNera Expert Advisor seamlessly integrates these elements into a sophisticated system designed for optimal gold

The quintessence of a comprehensive approach, whose main goal is long-term and realistic earnings with minimal risks for the trader. The foundation is advanced trading concepts combined with machine learning, which effectively enhance each other. Another unique feature is that the system does not need to be optimized, as this function is handled by my servers. Fresh settings are published daily in our Telegram channels, constantly keeping the system at the highest level of relevance. Our Telegr

Introducing our advanced Scalping Forex Robot , specifically designed to maximize trading opportunities with 5 popular currency pairs on the M1 timeframe. The scalping algorithm is built to spot high-probability entry and exit points, ensuring that every trade is executed with the highest chance of success within the M1 timeframe . This robot is perfect for traders who prefer the scalping method and want to take advantage of rapid price movements without having to manually monitor the ch

Contact me for discount before purchasing! AI-Driven Technology with ChatGPT Turbo Infinity EA is an advanced trading Expert Advisor designed for GBPUSD and XAUUSD. It focuses on safety, consistent returns, and infinite profitability. Unlike many other EAs, which rely on high-risk strategies such as martingale or grid trading. Infinity EA employs a disciplined, profitable scalping strategy based on neural network embedded over machine learning, data analytics AI based technology provided by lat

EA Gold Stuff is an Expert Advisor designed specifically for trading gold. The operation is based on opening orders using the Gold Stuff indicator, thus the EA works according to the "Trend Follow" strategy, which means following the trend. Real-time results can be viewed here . Contact me immediately after the purchase to get personal bonus! You can get a free copy of our Strong Support and Trend Scanner indicator, please pm. me! Settings and manual here
Please note that I do not sell my

AI Golden Jet Fighter GTX MT4 is a straightforward and efficient Expert Advisor (EA) for gold trading on the Meta Trader 4 platform. Utilizing Neural Networks, this EA is designed for scalping in the gold market (XAU/USD). The main strategy of AI Golden Jet Fighter GTX focuses on identifying small price fluctuations and opening positions to capture profits within short time frames. The EA analyzes market conditions in real-time and automatically executes trades with predefined stop-loss and t

Aura Neuron is a distinctive Expert Advisor that continues the Aura series of trading systems. By leveraging advanced Neural Networks and cutting-edge classic trading strategies, Aura Neuron offers an innovative approach with excellent potential performance. Fully automated, this Expert Advisor is designed to trade currency pairs such as EURUSD and XAUUSD (GOLD). It has demonstrated consistent stability across these pairs from 1999 to 2023. The system avoids dangerous money management techniques

Gann Made Easy is a professional and easy to use Forex trading system which is based on the best principles of trading using the theory of W.D. Gann. The indicator provides accurate BUY and SELL signals including Stop Loss and Take Profit levels. You can trade even on the go using PUSH notifications. PLEASE CONTACT ME AFTER PURCHASE TO GET MY TRADING TIPS PLUS A GREAT BONUS! Probably you already heard about the Gann trading methods before. Usually the Gann theory is a very complex thing not only
It helps to calculate the risk per trade, the easy installation of a new order, order management with partial closing functions, trailing stop of 7 types and other useful functions.
Additional materials and instructions
Installation instructions - Application instructions - Trial version of the application for a demo account
Line function - shows on the chart the Opening line, Stop Loss, Take Profit. With this function it is easy to set a new order and see its additional characteris

WINTER Mega SALE! --> Buy Forex GOLD Investor with -60% OFF and get a BONUS EA -> Pips Master PRO - with amazing results!
NOTE: Promo price: $197 (Regular Price: $497) - The offer ends soon! Live Signal Account: https://www.mql5.com/en/signals/2276118 Forex GOLD Investor is one of the best expert advisors developed to trade on GOLD(XAUUSD) in the forex market. Forex GOLD Investor consists of 2 trading systems . The first one is based on scalping trading strategy and the second system has time

Fully Automated EA based on Supply and Demand Principles. The first Supply and Demand EA that is offering Complete Automation . Now trading Becomes Effortless, offering full control over your trading strategy through a User-Friendly graphical Trading Panel. You get a Super High Quality Algorithmic Trading Software that contains more than 15,000 lines of code. The best way to trade "Prop Firms Challenges" and Pass all the Stages to be a Quilified Trader.
Supply Demand EA ProBot Manual ||

Overview The CoreX G EA is an advanced trading system specifically designed to tackle the complexities of the Forex market. By leveraging cutting-edge neural networks, sophisticated machine learning technologies, and an integrated big data strategy, CoreX G delivers exceptional accuracy and security in trading. This Expert Advisor (EA) stands out due to its technological excellence and premium customer support, ensuring users are always assisted with any questions or concerns.
Signals: Live

EvoTrade: The First Self-Learning Trading System on the Market Allow me to introduce EvoTrade —a unique trading advisor built using cutting-edge technologies in computer vision and data analysis. It is the first self-learning trading system on the market, operating in real-time. EvoTrade analyzes market conditions, adapts strategies, and dynamically adjusts to changes, delivering exceptional precision in any environment. EvoTrade employs advanced neural networks, including Long Short-Term Me

Welcome to Trade Manager MT4 - the ultimate risk management tool designed to make trading more intuitive, precise, and efficient. This is not just an order placement tool; it's a comprehensive solution for seamless trade planning, position management, and enhanced control over risk. Whether you're a beginner taking your first steps, an advanced trader, or a scalper needing rapid executions, Trade Manager MT4 adapts to your needs, offering flexibility across all markets, from forex and indice

EA Black Dragon runs on the Black Dragon indicator. The EA opens a deal by indicator color, then there is the opportunity to increase the network of orders or work with stop loss. Be careful i not sell EA or sets at telegram it scam. All settings free here at blog . IMPORTANT! Contact me immediately after the purchase to get instructions and a bonus! Real operation monitoring as well as my other products can be found here: https://www.mql5.com/en/users/mechanic/seller
Inputs Value
·

1 copy left for $199. Next price --> $299. Diamond PRO is enhanced powerful version of Diamond for advanced traders. Pro version includes optimized cores, new impoved entry points filters, new multistage profit closure algorithm and сontains number of external control parameter that allows build and fine tune own tradind decisions and algorithms. The system provides more accurate market entries, analyzes and filters upcoming economic news, contains spread protection and an advanced position ma

Paradox Flux Trader: A Revolution in Gold Trading (XAU/USD) Imagine a tool that doesn’t just analyze the market but redefines the very approach to trading. Paradox Flux Trader is not just an Expert Advisor—it is a next-generation trading system designed exclusively for trading gold (XAU/USD). It utilizes unique technologies that set it apart from anything else on the market. Limited-Time Offer For a limited time, Paradox Flux Trader is available for just $499. After the promotion ends, the price

The AI Gen ProX Expert Advisor is a powerful solution based on advanced market analysis and data processing technologies. Utilizing cutting-edge algorithms for time series analysis and complex mathematical models, it ensures high accuracy in forecasts and automates trading processes. The EA is designed to combine performance and reliability, making it an effective tool for trading. Real Time Signal GEN PRoX: https://www.mql5.com/ru/signals/2283186 The price of the advisor will increase si

BITCOIN BOT
Btc Bot uses the Stochastic tape Indicator and is specifically designed for trading bitcoin, however, you can trade other currency pairs also if you want. When the tape crosses from red to green, the EA will start to buy and when it crosses from green to red the EA will start to sell. Trades will be controlled in a martingale/grid style until it hits take profit. The EA has a build in news filter which will stop the entering of new positions at a certain time before the news a
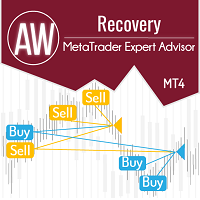
The Expert Advisor is a system designed to recover unprofitable positions. The author's algorithm locks a losing position, splits it into many separate parts, and closes each of them separately. Easy setup, delayed launch in case of drawdown, locking, disabling other Expert Advisors, averaging with trend filtering and partial closing of a losing position are built into one tool. It is the use of closing losses in parts that allows you to reduce losses with a lower deposit load, which ensures saf

The Matrix Mind AI: A New Standard in Forex Trading The Matrix Mind AI is an innovative trading advisor designed to push the boundaries of Forex trading. Built on Matrix Factorization Models, it deeply analyzes market data, uncovering hidden patterns and offering unique opportunities for strategy development. Real SIgnal: https://www.mql5.com/en/signals/2277247 Price Offer: First 3 copies: $499 Next price: $599 Key Features of The Matrix Mind AI Matrix Factorization at Its Core
Advanced al

EA Gold Isis – A Safe and Effective Gold Trading Solution Launch promo! Only 1 copies left at current price! Next price: $458 Final price: $1998 LIVE SIGNAL MT5 version Hello! I am EA Gold Isis, the second EA in the Diamond Forex Group family, specifically designed for trading gold (XAU/USD). With exceptional features and a safety-first approach, I promise to deliver a sustainable and effective gold trading experience for traders.
What Makes EA Gold Isis Different?
- Dynamic Stop Loss

Specials Discount now. The Next Generation Forex Trading Tool. Dynamic Forex28 Navigator is the evolution of our long-time, popular indicators, combining the power of three into one: Advanced Currency Strength28 Indicator (695 reviews) + Advanced Currency IMPULSE with ALERT (520 reviews) + CS28 Combo Signals (recent Bonus) Details about the indicator https://www.mql5.com/en/blogs/post/758844
What Does The Next-Generation Strength Indicator Offer? Everything you loved about the originals, now

CyNeron: Precision Trading Meets AI Innovation Signals : CyNeron Manual & set files : Contact me after purchase to receive the manual and set files Price : The price increases based on the number of copies sold Available copies : 5 AI-Driven Snapshot Analysis: A Market First CyNeron is the first EA on the market to integrate advanced AI into a revolutionary trading approach by capturing and processing detailed snapshots of market conditions.
Utilizing cutting-edge AI-powered neural networks,

Gold Scalping Expert is a very intelligent smart algorithm which exploits the reaction of gold during various high-impact events like geo-political news, pandemics, and economic changes. This system trades breakouts using the popular zig-zag indicator by placing pending orders at the turning points and when the price breaks out beyond these levels the orders will get triggered. The EA is using a very smart trailing stop and dynamic stop loss to protect your account and manage the risk properly

HFT Prop Firm EA is also known as Green Man due to its distinctive logo, is an Expert Advisor (EA) crafted specifically for overcoming challenges or evaluations from proprietary trading firms (prop firms) that permit High-Frequency Trading (HFT) strategies.
With version 5.8 and above GreenMan HFT Prop Firm EA is plug and play for for almost true HFT prop firm challenges without setfiles with it newly improved automatic features. For limited period: Free utilities worth $198 when you buy HFT

Gold One MT4 Hello to all gold trading enthusiasts in Forex, Welcome to our robot, where you join the ranks of the top gold traders. With over two decades of precise experience in the Forex market, we proudly introduce the latest generation of trading robots.
Features: Ideal for prop firm challenges. Suitable for all account sizes, including low capitals. NO Grid and NO martingale 100% Fully automated This robot employs the most recent, cutting-edge, and advanced gold-specific indicat
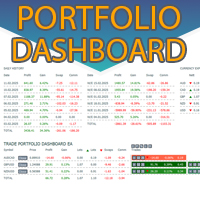
Instantly see your closed trade history by day and week, your current open trades, and forex exposure on one chart! Use the heatmap to identify profitable trades and where your current drawdown is within your trading portfolio. Quick Close Buttons
Use the quick close buttons to close every trade on a single symbol, close out individual trades in full, or take partial profits or losses at the click of a button. No more hunting for trades in a list and working out how to close part of your trades.

Experience exceptionally fast trade copying with the Local Trade Copier EA MT4 . With its easy 1-minute setup, this trade copier allows you to copy trades between multiple MetaTrader terminals on the same Windows computer or Windows VPS with lightning-fast copying speeds of under 0.5 seconds. Whether you're a beginner or a professional trader, the Local Trade Copier EA MT4 offers a wide range of options to customize it to your specific needs. It's the ultimate solution for anyone looking to inc

- Real price is 80$ - 40% Discount ( It is 49$ now ) - Lifetime update free Contact me for instruction, add group and any questions! Related Products: Bitcoin Expert , Gold Expert - Non-repaint - I just sell my products in Elif Kaya profile, any other websites are stolen old versions, So no any new updates or support. Introduction The breakout and retest strategy is traded support and resistance levels. it involves price breaking through a previous level. The break and retest strategy is

!SPECIAL SALE! An exclusive indicator that utilizes an innovative algorithm to swiftly and accurately determine the market trend. The indicator automatically calculates opening, closing, and profit levels, providing detailed trading statistics. With these features, you can choose the most appropriate trading instrument for the current market conditions. Additionally, you can easily integrate your own arrow indicators into Scalper Inside Pro to quickly evaluate their statistics and profitability

FX Levels: Exceptionally Accurate Support & Resistance for All Markets Quick Overview
Looking for a reliable way to pinpoint support and resistance levels across any market—currencies, indices, stocks, or commodities? FX Levels merges our traditional “Lighthouse” method with a forward-thinking dynamic approach, offering near-universal accuracy. By drawing from real-world broker experience and automated daily plus real-time updates, FX Levels helps you identify reversal points, set profit targe
Recovery Manager Pro is a system for recovering drawdowns from other advisors or from manually opened orders. RM Pro has the ability to automatically dynamically adjust. The trader needs to select the risk level and the advisor will work in fully automatic mode. Can work in drawdown recovery mode and standby mode! If another advisor generates a drawdown, RM Pro will disable it, lock the position and start the process of restoring the deposit using partial closures. In its trading, the advisor u

FX Power: Analyze Currency Strength for Smarter Trading Decisions Overview
FX Power is your go-to tool for understanding the real strength of currencies and Gold in any market condition. By identifying strong currencies to buy and weak ones to sell, FX Power simplifies trading decisions and uncovers high-probability opportunities. Whether you’re looking to follow trends or anticipate reversals using extreme delta values, this tool adapts seamlessly to your trading style. Don’t just trade—trade

Gold Venamax - this is a best stock technical indicator. The indicator algorithm analyzes the price movement of an asset and reflects volatility and potential entry zones. Indicator features: This is a super indicator with Magic and two Blocks of trend arrows for comfortable and profitable trading. Red Button for switching blocks is displayed on the chart. Magic is set in the indicator settings, so that you can install the indicator on two charts displaying different Blocks. Gold Venamax can b

40% OFF Boring Pips EA – Limited Offer! Get 8 activations for just $399 USD – only 10 copies available! Why Choose Boring Pips EA?
Proven Results – 123 weeks of tracked signals with 1000%+ profit
Easy to Install – Get started in minutes
Fully Automated Don’t miss this opportunity to trade with confidence and precision. Secure your Boring Pips EA now. Have you ever wondered why most expert advisors are not effective in live trading, despite their perfec
Alphabet AI is an advisor that combines two popular trading approaches: the multi-level perceptron (MLP) strategy and the mean reversion strategy. An MLP strategy can identify long-term trends and forecast future price movements, while a mean reversion strategy can exploit short-term price deviations from the average. Combining a multi-level perceptron strategy with mean reversion in trading advisors offers a powerful approach to Forex trading. By using the MLP model's predictive capabilities a

Live signal: 2 000 000$ https://www.mql5.com/en/signals/2288221 Why Bitcoin trading
1. Elite Precision Precision – Redefining Trading
Cutting-edge algorithms fine-tuned for pinpoint execution. Smart setups crafted to navigate risks and seize opportunities. 2. Adaptive Market Strategies with Real-Time Price Movement
Markets shift—but Bitcoin Robot is built to adapt instantly: Trading in trending, volatile, or ranging conditions. Captures breakouts, reversals, and price surges before they hap

The EA enters a position when the market starts moving around the New York session (higher volume). This way, the momentum is preserved by the volume and we can reach the Take Profit with high probability instantly. Signal (292%, 10% DD): https://www.mql5.com/en/signals/2274145 It Enters on Momentum Around New York Session The EA detects the hidden impulse via FVGs on lower time frames. When the impulse is detected closely before or during the New York session, the EA opens a position.
It ma

Introducing the DS Gold Robot, your ultimate companion in navigating the intricate world of XAUUSD trading. Developed with precision and powered by cutting-edge algorithms, DS Gold is a forex robot meticulously crafted to optimize your trading performance with XAUUSD pairs . With its advanced analytical capabilities, DS Gold Robot constantly monitors the gold market, identifying key trends , patterns, and price movements with lightning speed. The DS Gold Robot opens positions every day from

Yarukami Mnukakashi is an automated trading advisor designed for traders in the Forex market. The version for MT5 is located at the link. Key Features: Strategy type: 24-hour trading, but I recommend avoiding the American session and setting a daily take of $30-40 per 0.01 lot. Can work in one direction or both at once independently of each other. Trading instruments: GOLD
Timeframes: M1
Algorithm: Uses technical analysis with moving average indicators, Bollinger and Momentum.
Risk management: t

Aurum AI – The Power of Artificial Intelligence for Gold Trading (XAU/USD) Experience the full potential of technology in trading! Aurum AI is a groundbreaking expert advisor designed for stable and secure performance in the gold market. It combines the power of artificial intelligence, precise trend analysis, and strict risk control to make every trade as effective as possible. Promotion Discount - 12%. 2 copies available at a price of $400 Live signal with high risk
(maximum drawdown up to 20

Scalper Vault is a professional scalping system which provides you with everything you need for successful scalping. This indicator is a complete trading system which can be used by forex and binary options traders. The recommended time frame is M5. The system provides you with accurate arrow signals in the direction of the trend. It also provides you with top and bottom signals and Gann market levels. The indicator provides all types of alerts including PUSH notifications. PLEASE CONTACT ME AFT

IX Power: Unlock Market Insights for Indices, Commodities, Cryptos, and Forex Overview
IX Power is a versatile tool designed to analyze the strength of indices, commodities, cryptocurrencies, and forex symbols. While FX Power offers the highest precision for forex pairs by leveraging all available currency pair data, IX Power focuses exclusively on the underlying symbol’s market data. This makes IX Power an excellent choice for non-forex markets and a reliable option for forex charts when deta

AFTER PURCHASE TEXT ME DIRECTLY FOR ASSISTANCE!!!!
Manual & set files: contact me after purchase to receive the manual and set files Price: The price increases based on the number of licenses sold Available copies: 4
Manual & set files: contact me after purchase to receive the manual and set files Price: The price increases based on the number of licenses sold Available copies: 4
Trading gold, one of the most volatile instruments in the market, demands precision, in-depth ana

Quantum strategy is a combination of quantum superposition and trading signal model. EA Quantum Dark Gold determines Buy and Sell positions simultaneously for each signal and simultaneously places 2 orders Buy Stop and Sell Stop. Then the momentum determines which order position is executed and cancels the remaining pending order. This interesting idea forms the Quantum Dark Gold with a unique entry method. Open positions are then managed by Trailing, Stop Loss and position balancing strategies

HFT PROP EA is the High Frequency Trading Expert Advisor (EA/bot) designed to pass proprietary trading firms (prop firms) challenges which use stop orders to enter the trades when market is trending, It is basically designed for US30 just at opening of US30 in New York Session till it remain in its trending nature for 15-30 minutes, and using HFT PROP EA you can pass the challenge within few minutes for prop firms who doesn't have any lot size cap.
HFT PROP EA MT5 Version - https://www.mql5.co

The XG Gold Robot MT4 is specially designed for Gold. We decided to include this EA in our offering after extensive testing . XG Gold Robot and works perfectly with the XAUUSD, GOLD, XAUEUR pairs. XG Gold Robot has been created for all traders who like to Trade in Gold and includes additional a function that displays weekly Gold levels with the minimum and maximum displayed in the panel as well as on the chart, which will help you in manual trading. It’s a strategy based on Price

Kamikaze Trading is the latest generation of automated trading robots for the Forex and Gold markets. The EA is programmed with premium algorithms and unique trading strategies that deliver stable performance and low risk. The strategy analyzes price action and price tick patterns, combines scalpers and smart position management and has available risk management options such as Max Stop Loss, Close all at Friday, Trailing, in which Max Stop Loss is often large so that the price has space to mov

We proudly present our cutting-edge robot, the Big Forex Players EA designed to maximize your trading potential, minimize emotional trading, and make smarter decisions powered by cutting-edge technology. The whole system in this EA took us many months to build, and then we spent a lot of time testing it. This unique EA includes three distinct strategies that can be used independently or in together. The robot receives the positions of the biggest Banks (p ositions are sent from our databa

GOLD DRAGON no grid! No martingale! Not Scalper! It trend expert advisor. Gold Dragon uses a strategy that capitalizes on certain market patterns and identifying periods of market consolidation that will form before a breakout. The EA will place pending orders at above and below these consolidation levels and is very effective in capturing significant price movements during these breakouts. The EA can place multiple orders but is not a martingale system and has a dynamic SL and smart trail
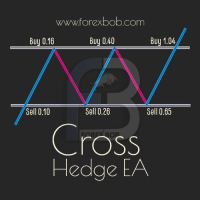
Cross Hedge EA Cross Hedge EA is a hedging EA which helps you recover the losing trade in a very tricky way based on "Zone Recovery Algorithm". It Hedge with an increased lot size based on multiplier factor in the market direction and if market reverse its direction again then it open a incremental lot in the current market direction. Doing this way it ends with a profit no matter in what direction the market will move.
Use Cent account with $100 deposits for gold or $10,000 for regular account

CURRENTLY 26% OFF !! Best Solution for any Newbie or Expert Trader! This indicator is a unique, high quality and affordable trading tool because we have incorporated a number of proprietary features and a new formula. With this update, you will be able to show double timeframe zones. You will not only be able to show a higher TF but to show both, the chart TF, PLUS the higher TF: SHOWING NESTED ZONES. All Supply Demand traders will love it. :) Important Information Revealed
Maximize the potentia

The Expert Advisor trades on the signals of the Trend Line PRO indicator. Orders are managed automatically. The EA has a Recovery function that increases the order size if the previous trade was closed with a loss. You can use from 1 to 3 orders at the same time. The Expert Advisor fully complies with the indicator signals and FIFO rules, does not use the grid function, which allows you to start trading with a minimum deposit of $100 The EA has a mobile trading panel for managing auto-trading f

The SevenDaysEA Expert Advisor is a fully automated grid system. The adviser works on currency pairs: AUDCAD, AUDNZD, NZDCAD. The EA has 10 preset set-files for each currency pair. The Expert Advisor has been successfully tested on real trading accounts: Real account signal - SevenDays - more than 4000% in 3 years of work. For the adviser to work on a certain currency pair, you need to install the adviser on the chart of the corresponding currency pair. To get started, you only need

ATTENTION: Last days with the Black Friday price, take advantage and buy now, in March the price will go to 600 USD. One of the few robots with a signal history of more than 3 years, and among the top 10. LINK TO MY ROBOTS AND SIGNAL PRESETS: In my profile there is a Google Drive link to download the PRESETS that I use in my SIGNALS, you can download and backtest for free, there are explanations in the README MANUAL. https://www.mql5.com/en/users/tec_daniel SOME EXAMPLES OF SIGNALS ON “m

FX Volume: Experience Genuine Market Sentiment from a Broker’s Perspective Quick Overview
Looking to elevate your trading approach? FX Volume provides real-time insights into how retail traders and brokers are positioned—long before delayed reports like the COT. Whether you’re aiming for consistent gains or simply want a deeper edge in the markets, FX Volume helps you spot major imbalances, confirm breakouts, and refine your risk management. Get started now and see how genuine volume data can

LENA Scalp MetaTrader 5 Version: coming soon
With advanced stop-loss technology utilizing artificial intelligence, Lena Expert Advisor provides an innovative trading experience. Lena’s robot avoids large stop-loss levels, Martingale, and grid trading. Instead, it features a dynamic stop-loss system that adapts to market conditions. AI-driven analysis supports identifying key market opportunities, aligning with its carefully designed strategy. This automated trading solution is based

Smart Funded EA is an expert advisor designed to pass the HFT challenges of prop firms that allow its use. You can check my blog post about HFT Prop firms before buying a challenge. Do I need to back-test? You do not need to backtest, and demo servers that you backtest will not give the real results since HFT prop firms servers and symbols are specially designed friendly with HFT bots. Samart Funded HFT has a hundred percent success rate so do not waste your time back testing. You can test the

Trade copier for MetaTrader 4. It copies forex trades, positions, and orders from any accounts. It is one of the best trade copiers MT4-MT4, MT5 - MT4 for the COPYLOT MT4 version (or MT4 - MT5 MT5 - MT5 for the COPYLOT MT5 version). MT5 version
Full Description +DEMO +PDF How To Buy
How To Install
How to get Log Files How To Test and Optimize All products from Expforex Copier version for MetaTrader 5 terminal ( МТ5 - МТ5, МТ4 - МТ5 )- Copylot Cli