RSI Collection and Drainage
- Indicators
- Suleiman Alhawamdah
- Version: 8.20
- Updated: 13 September 2024
- Activations: 7
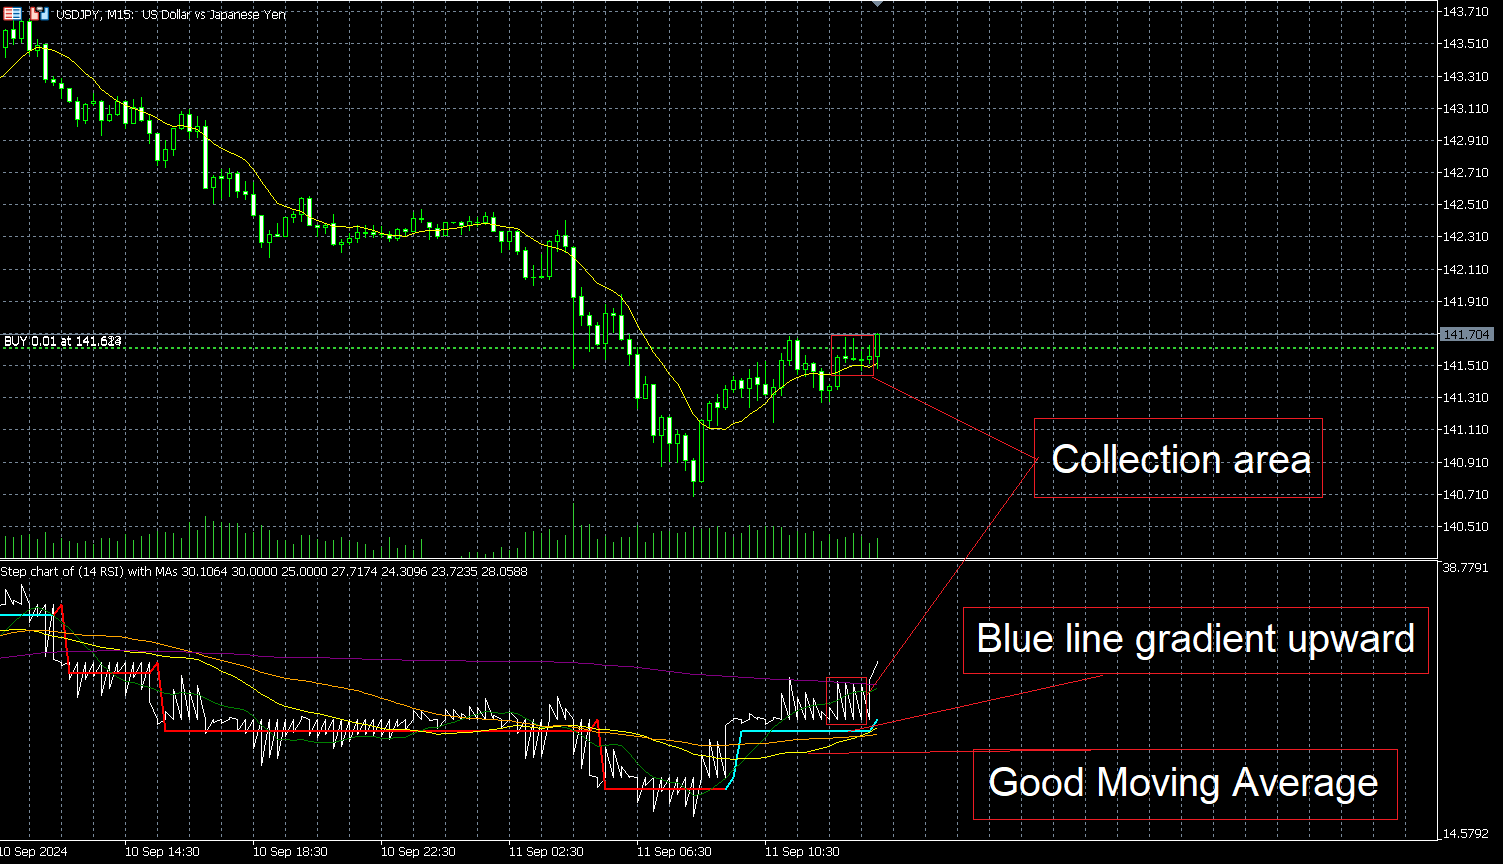
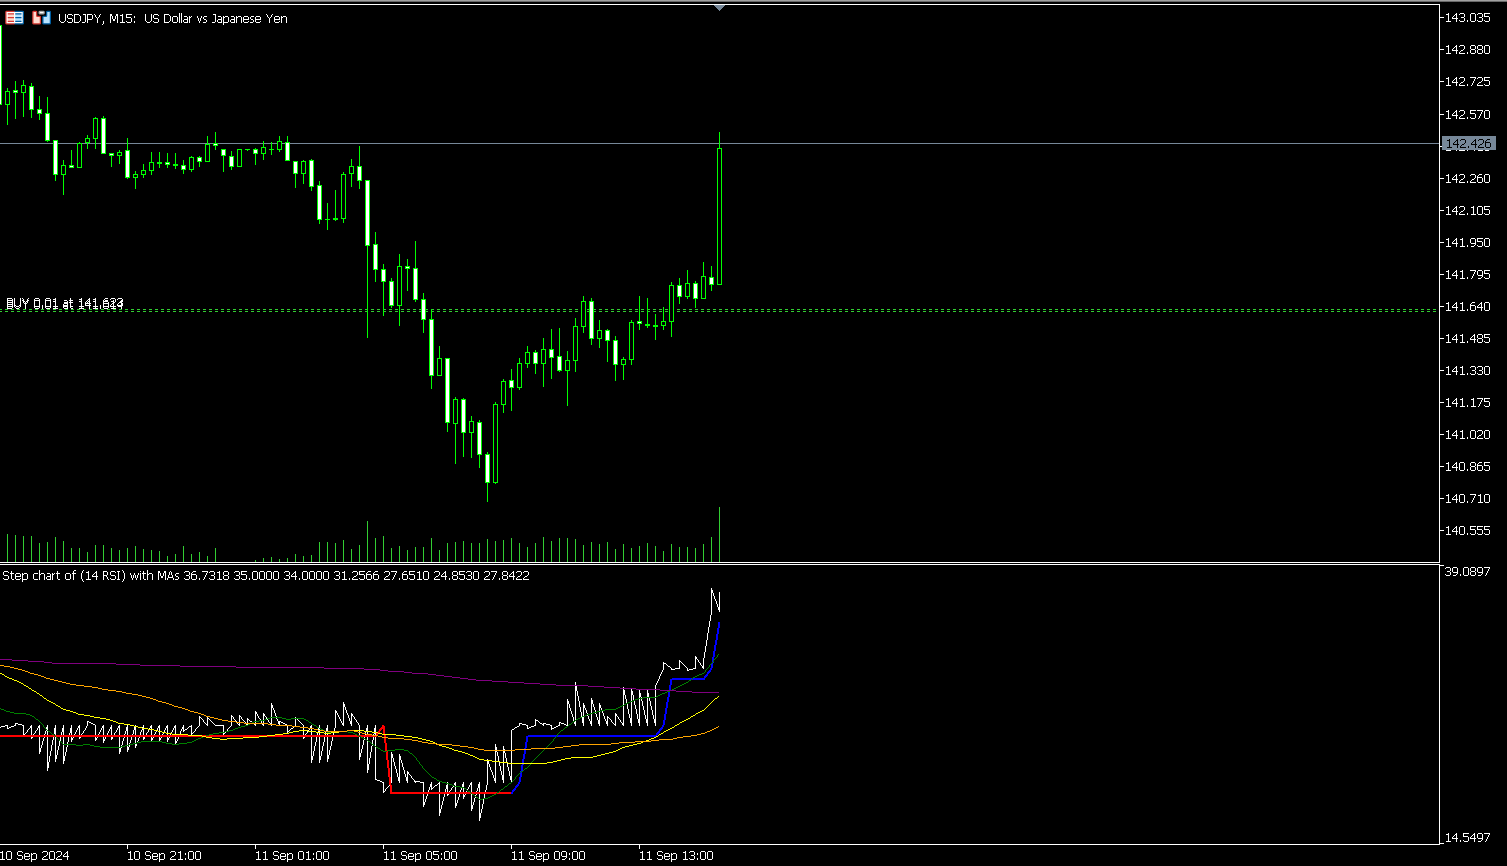
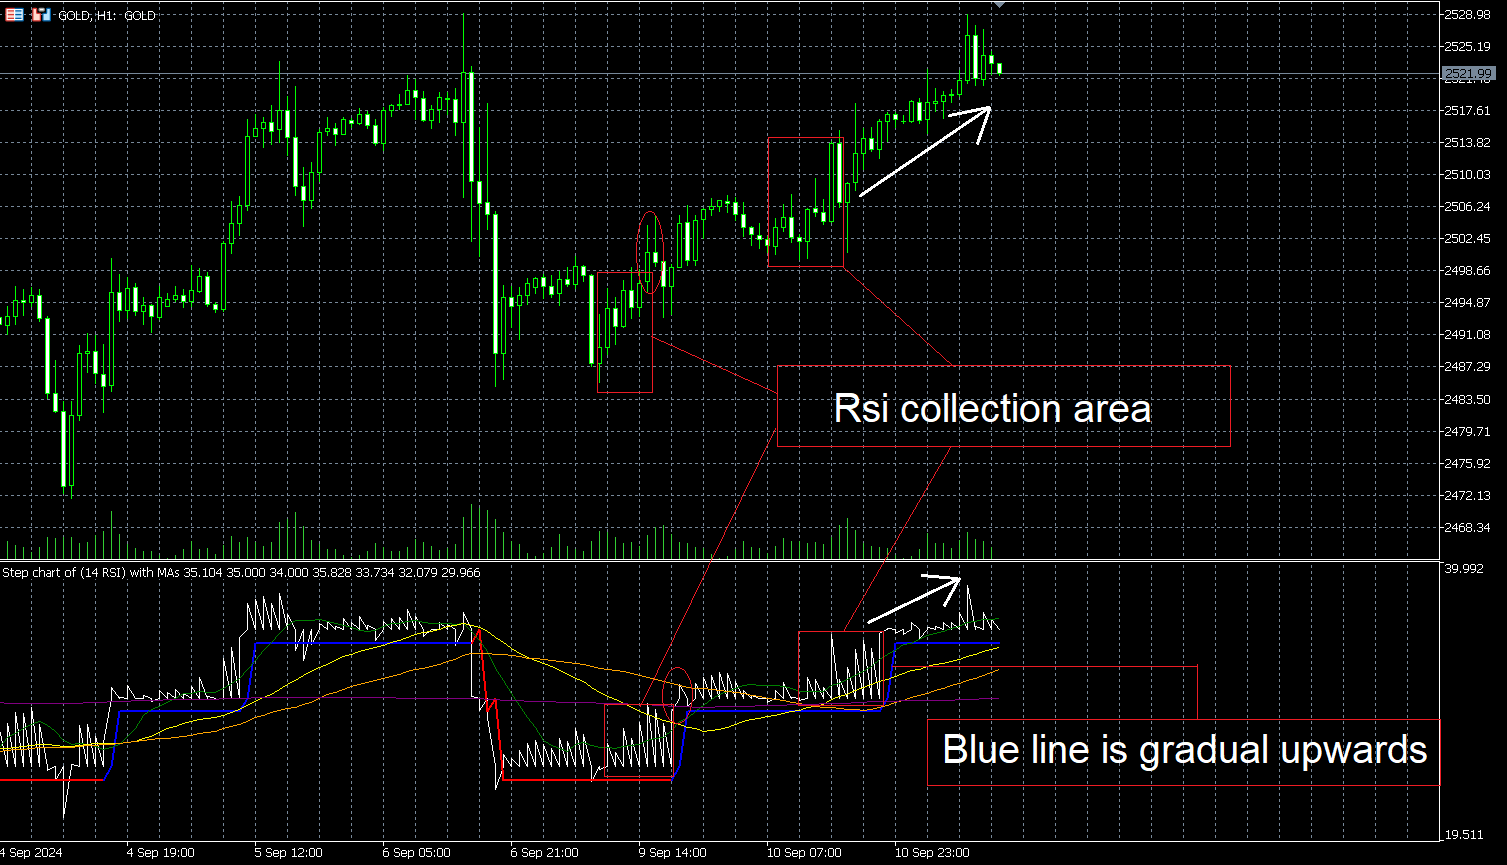
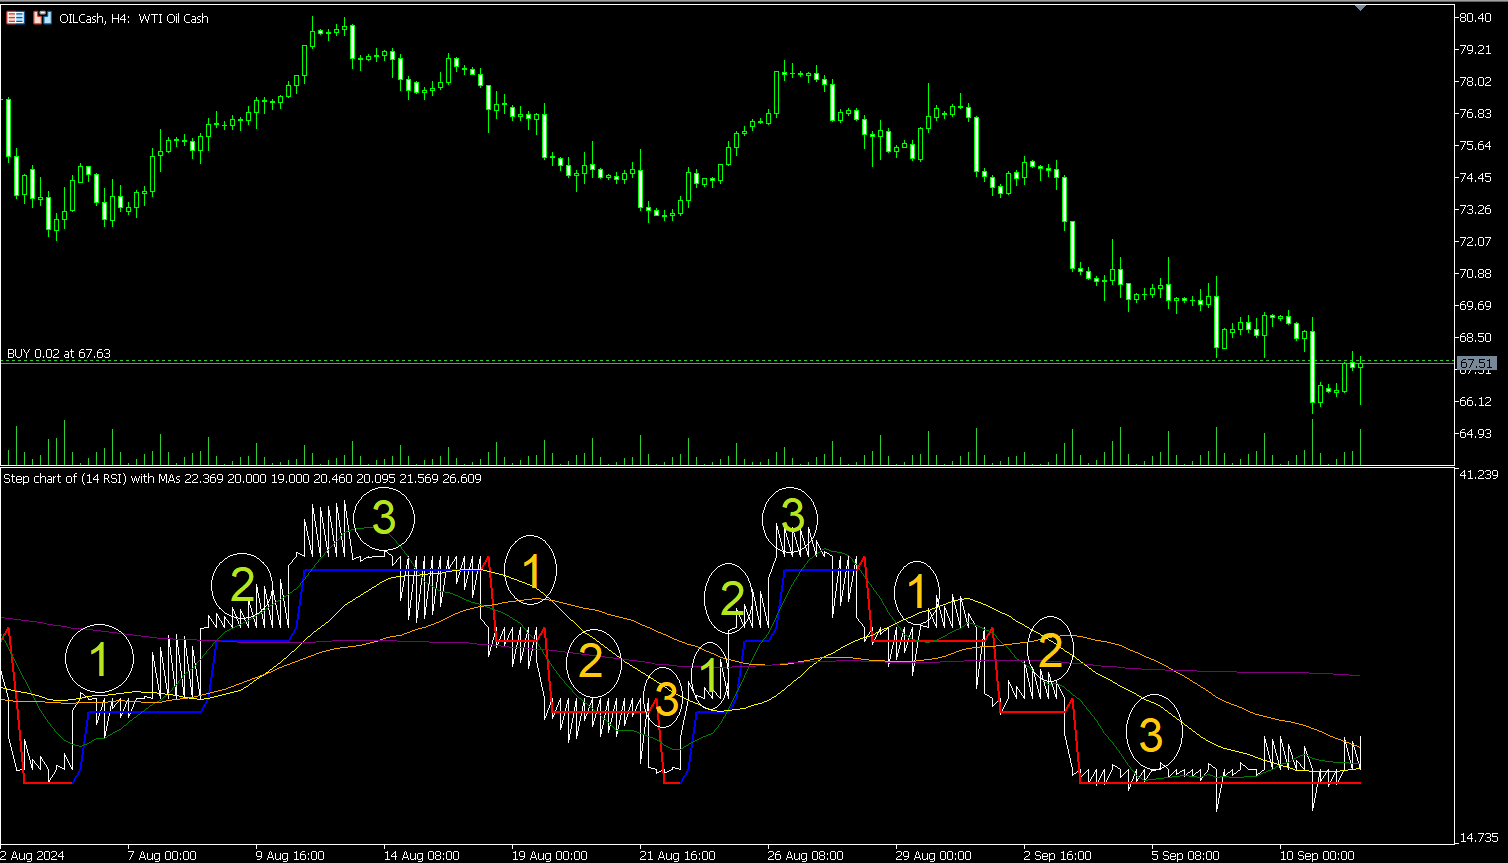
RSI Collection/Drainage Indicator is an advanced technical analysis tool designed specifically to help analyze market movement based on (RSI) and Moving Averages, this making it easier to identify accumulation and distribution zones and potential breakouts for new market waves.
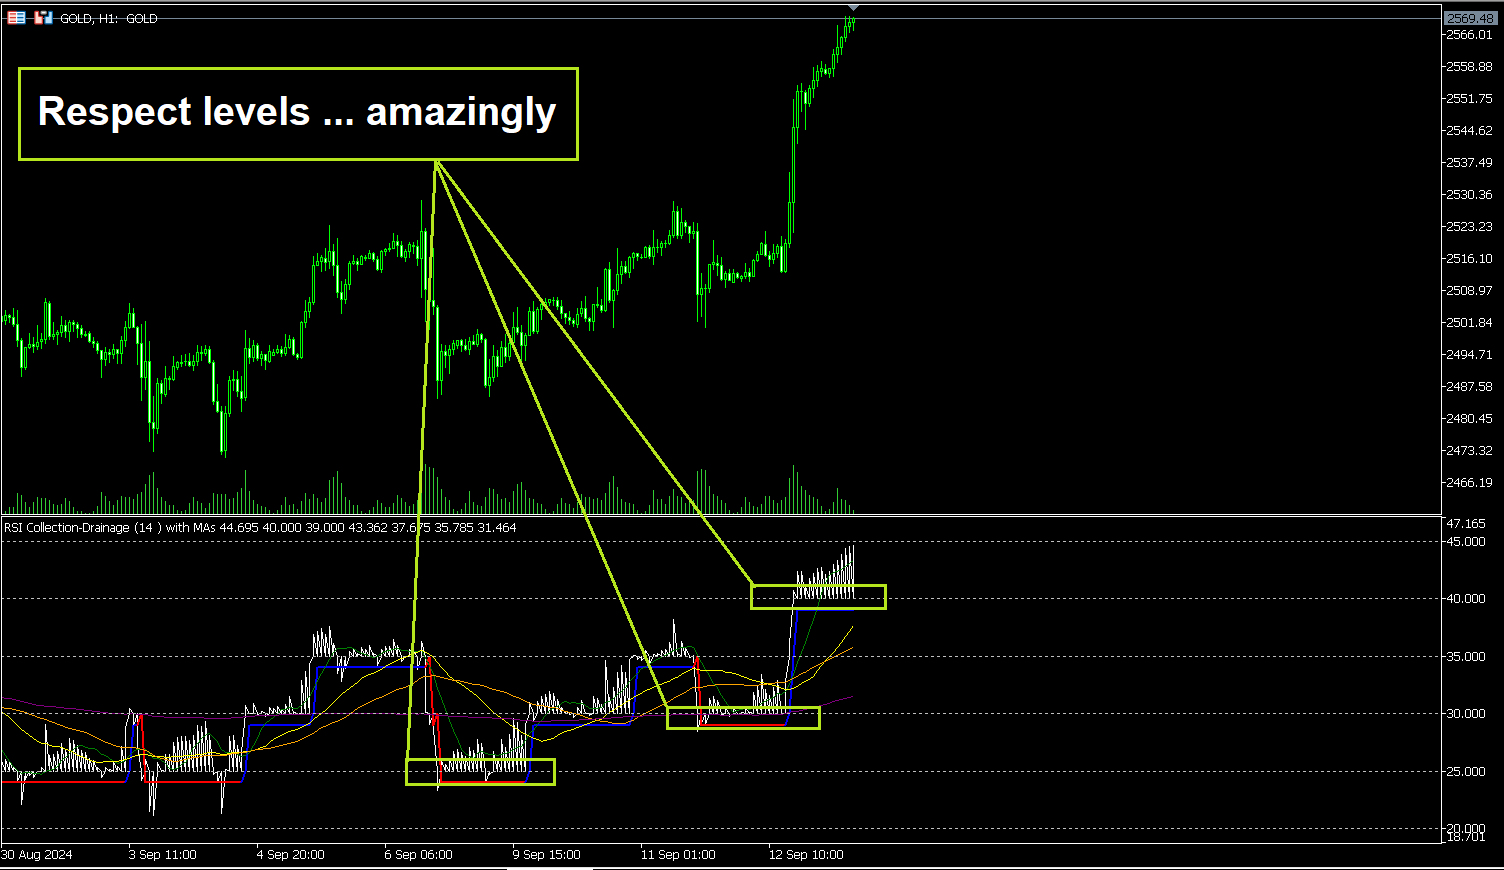
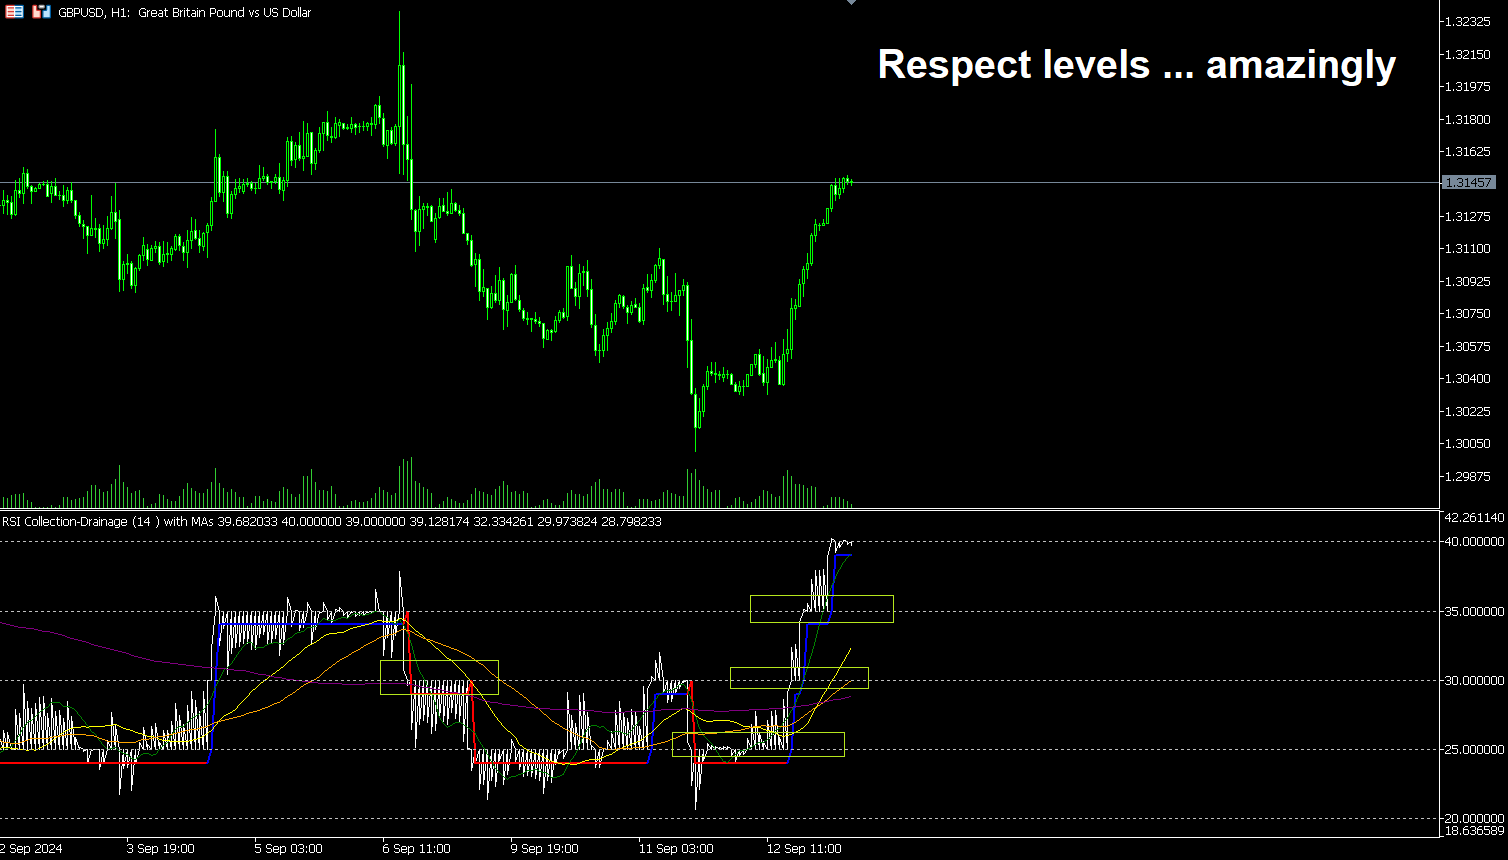
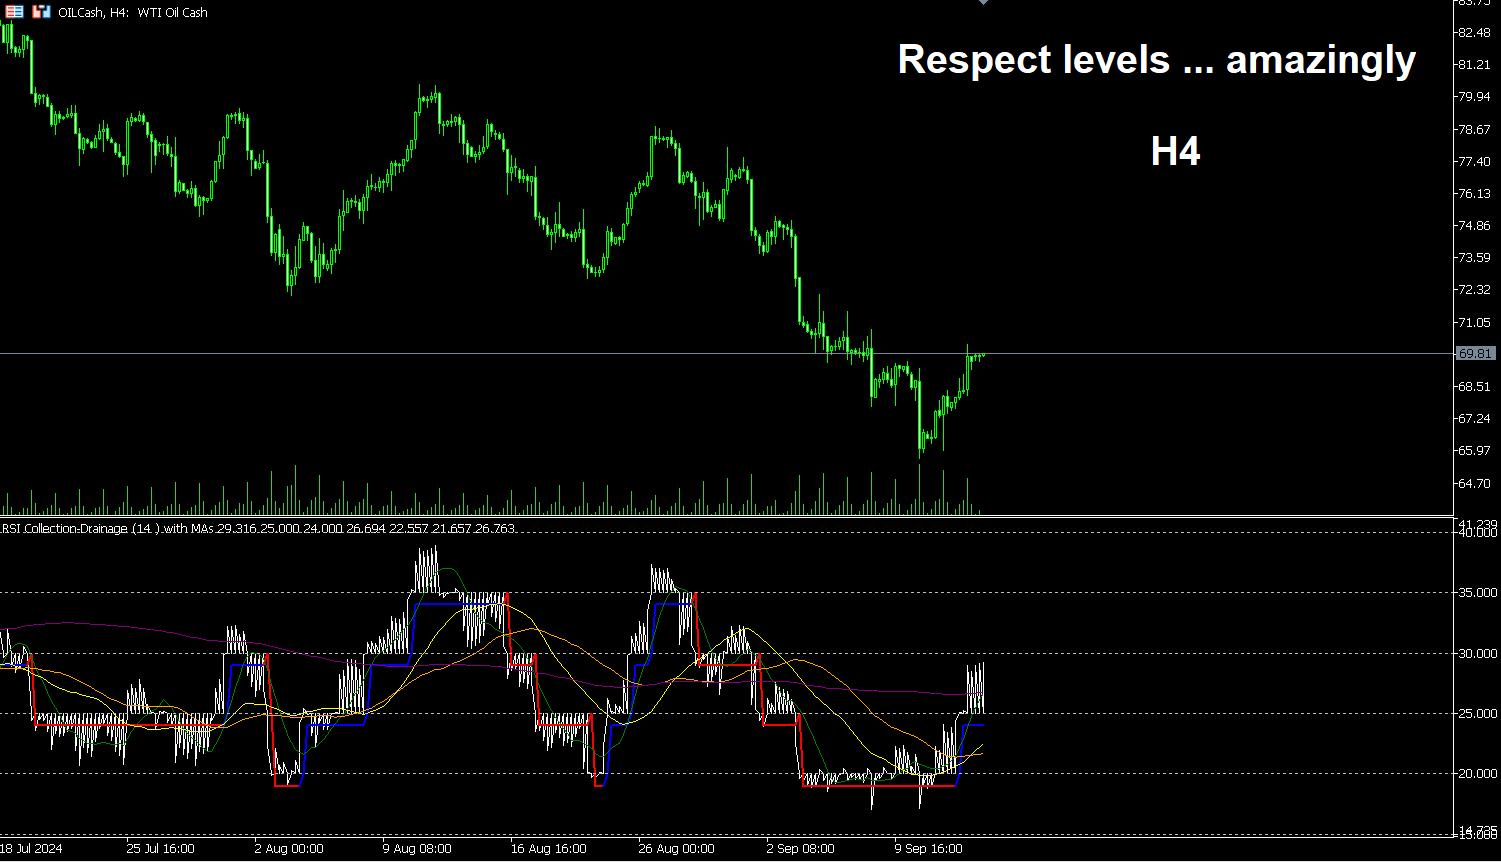
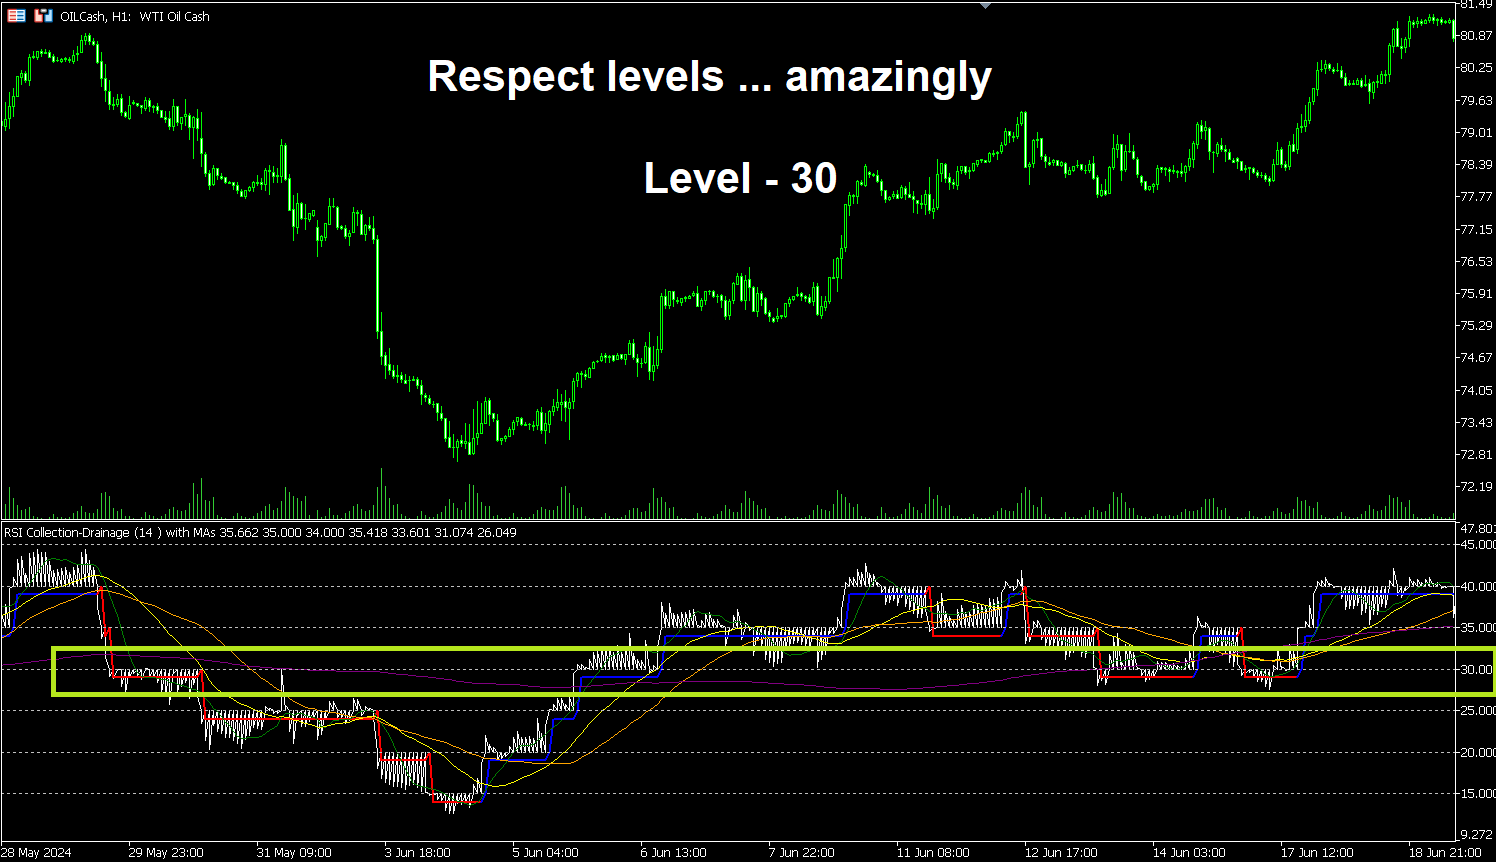
Level 30 is a crucial point; values above it are often positive, while values below it indicate a negative condition. You will notice how RSI respects the other levels, to the extent that these levels often turn into support or resistance. It is important to observe the higher timeframes before moving to smaller timeframes. We recommend reviewing the daily timeframe, then moving to the four-hour timeframe, and then to the hourly timeframe.
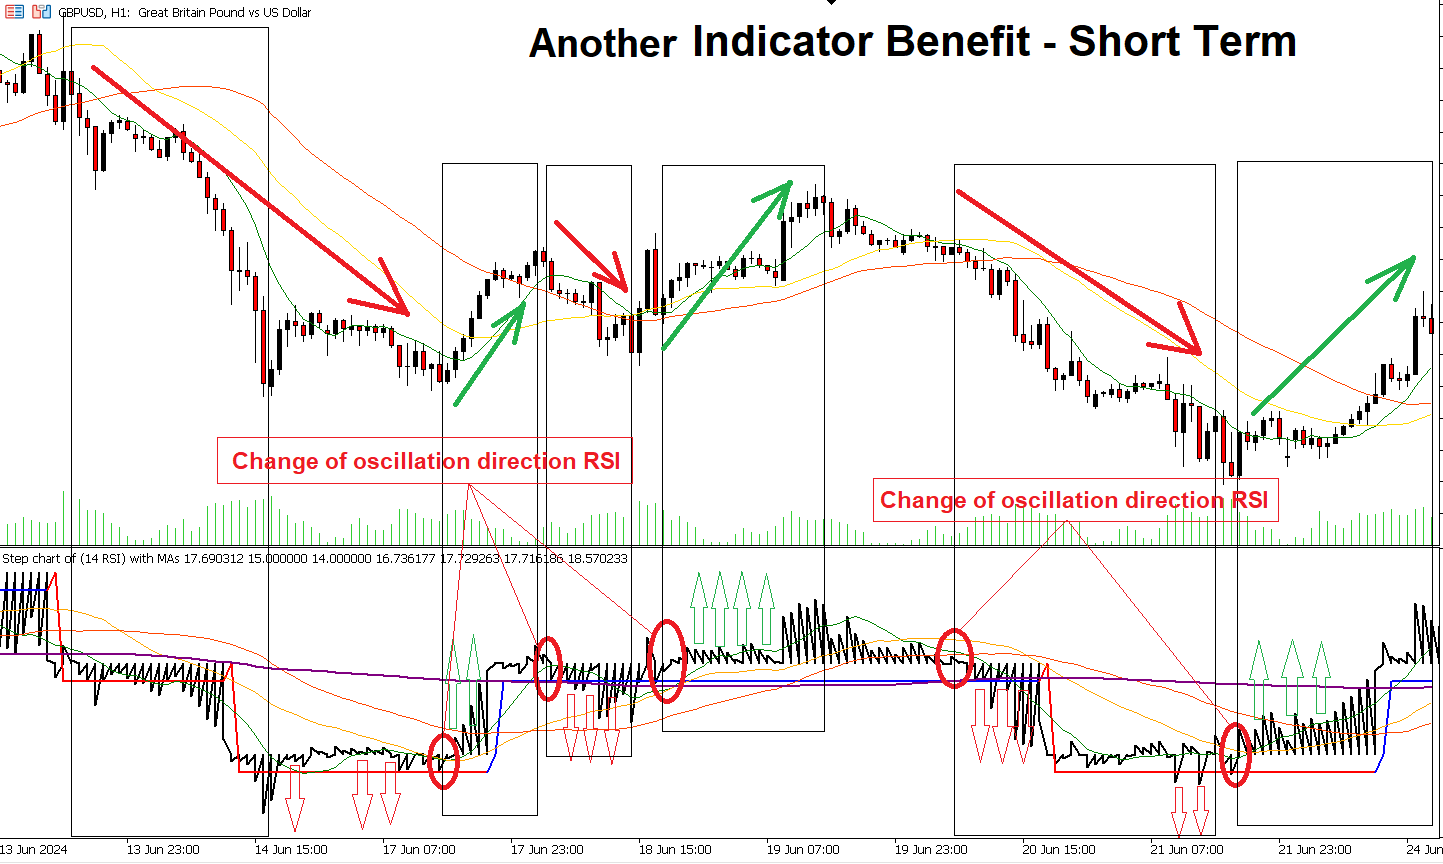
indicator modifies the RSI to resemble a tight zigzag movement, which results in the formation of zones similar to accumulation and distribution areas until a breakout occurs.
for the levels 30 - 35 - 25 - 40 - 20 - 45 - 15 are similar to support and resistance lines. You will find that if the trend is up, it is impossible to break the level downward, no matter how hard the market tries to deceive you... Notice this through the zigzag RSI waves that collide with the levels beautifully.
Reversals, Accumulation, and Distribution: It is important to note that these lines may indicate imminent market reversals, especially when the market is in accumulation or distribution phases. Combining RSI movement with moving averages can provide strong signals about trend changes or reversals.
Indicator Settings:
RSI Period: Defines the calculation period for the RSI.
Moving Averages: Customizable settings for the four moving average lines (10, 30, 50, 200).
Alpha Value: Controls the smoothness of the RSI.
Multiplier: A multiplier applied to the RSI calculations.