• Overview
  • Reviews
  • Comments

Cumulative Vol Bands

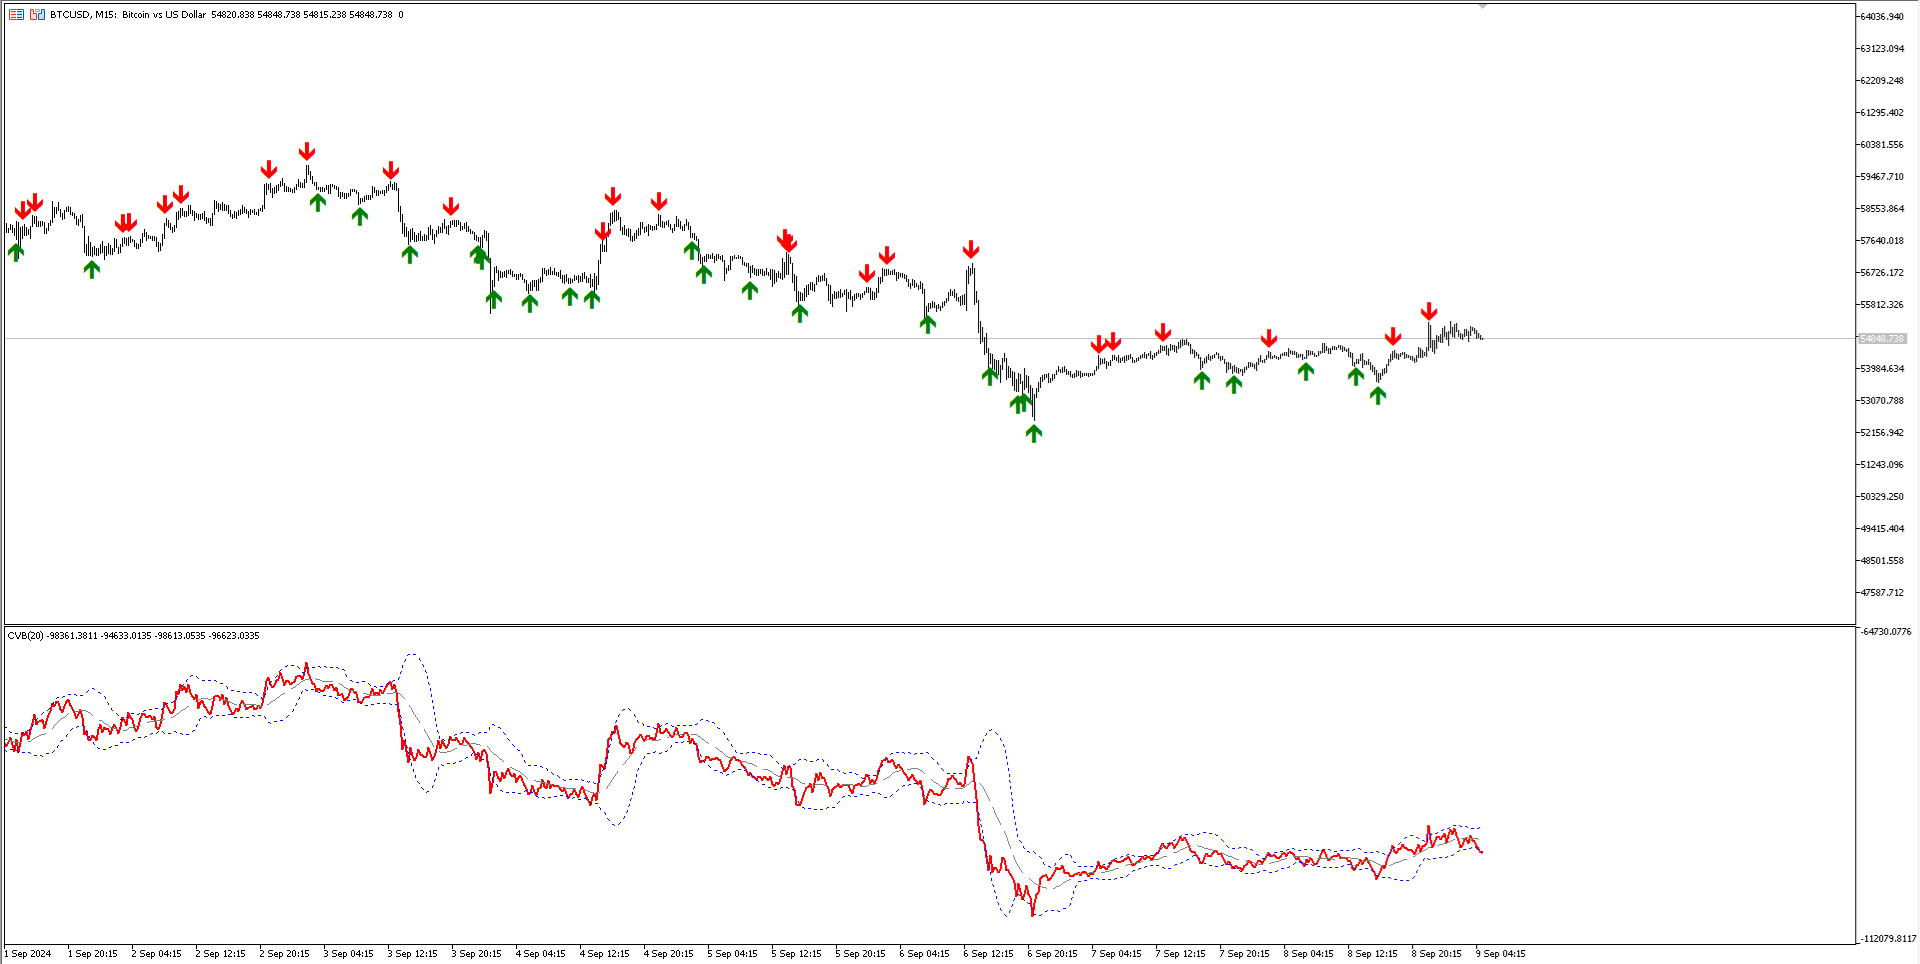
🚀 CVB Cumulative Volume Bands: Maximize Your Trades with Accumulated Volume! 📊

The CVB Cumulative Volume Bands is an advanced indicator designed for traders seeking precise insights based on accumulated volume. 🔥 By using cumulative volume bands, this indicator offers clear readings of market buying and selling pressures, helping to identify reversals and strong price movements. 📈

Key Features:

📊 Accumulated Volume Analysis: Detect pressure points based on volume.
🚦 Clear Entry/Exit Signals: Take advantage of real-time opportunities.
🔍 Easy Interpretation: User-friendly interface and simplified visuals.
📅 For All Assets and Time Frames: Use it in any market, at any time.

Stay ahead with the CVB Cumulative Volume Bands and improve your trading decisions with confidence! 💼💡

Leave your feedback and help us improve! ⭐


Recommended products
Renko Plus
Eadvisors Software Inc.
With Renko Plus you can use the features in the Indicator functionality, just add it to the Metatrader5 chart.             The Renko chart is a type of chart, developed by the Japanese, that is constructed using price movement rather than standardized prices and time intervals like most charts. It is believed to be named after the Japanese word for bricks, "renga", as the graphic looks like a series of bricks.             A new brick is created when the price moves a specified p
HLC bar MT5 Wyckoff
Eduardo Da Costa Custodio Santos
The indicator "HLC_bar_MT5 Wyckoff" for MT5 has been created to facilitate analysis at trade time. The HLC Bar was used by Richard Wyckoff and is currently widely used in "VSA" operations. Wyckoff found that using High, Low, and Close made the graph much cleaner and easier to analyze. The Indicator "HLC_bar_MT5 Wyckoff" allows: # Change the bar width; # Leave the bar the same color; # And highlight the bar that opened and closed at the same price. Colors and width is easily modified in settings
Introduction to Smart Renko The main characteristics of Renko Charting concern price movement. To give you some idea on its working principle, Renko chart is constructed by placing a brick over or below when the price make the movement beyond a predefined range, called brick height. Therefore, naturally one can see clear price movement with less noise than other charting type. Renko charting can provide much clearer trend direction and it helps to identify important support and resistance level
One of the most famous phrases in the trading world is "The Trend Is Your Friend". Trading following the current trend is one of the most successful ways in terms of probability. The hard part of it is to recognize when the market is trending or not. that's the role of our indicator we called The Trend Is Your Friend Until It Is Not. Apart from its big name it is really easy to use and see when the market is trending or ranging. Through a little window of 3 colors you will identify if the ma
Gino Renko
Stephane, Andr Valette
1 (1)
Another renko-based indicator. It returns different usable values ​​for an EA, and is directly displayed on the main chart. Its setting is very simple: The size of the renko The number of bars taken into account The falling color The color on the rise Returned values: Buffer 0 : Value of the middle Buffer 1 : Value of the Top Buffer 2 : Value of the Bottom Buffer 3 : Direction of renko (0.0 for top ; 1.0 for bottom) Buffer 4 : Ratio of the renko, for example, if it is twice, 3 times, ro more of
Description The indicator uses market profile theory to show the most relevant trading zones, on a daily basis. The zones to be shown are LVN (low volume nodes) and POC (point of control). An LVN zone is one which represents price areas with the least time or volume throughout the day. Typically, these areas indicate a supply or demand initiative, and in the future, they can turn into important breakout or retracement zones. A POC zone is one which represents price areas with the most time or vo
KT ROC Divergence MT5
KEENBASE SOFTWARE SOLUTIONS
KT ROC divergence shows the regular and hidden divergences build between the price and Rate of change oscillator. Rate of change (ROC) is a pure momentum oscillator that calculates the change of percentage in price from one period to another. It compares the current price with the price "n" periods ago. ROC = [(Close - Close n periods ago) / (Close n periods ago)] * 100 There is an interesting phenomenon associated with ROC oscillator. In ROC territory there is no upward limit, but there is a do
Renko Chart
Marcin Konieczny
3.63 (8)
This indicator allows to display Renko charts in the indicator window. Renko charts show only price movements that are bigger than the specified box size. It helps to eliminate noise and allows to focus on main trends. Time is not a factor here. Only price movements are taken into account. That's why Renko chart is not synchronized with the main chart it is attached to. Indicator works in two modes: CLOSE - only close prices are taken into account while building the chart HIGH_LOW - only high/
FREE
Renko graph The Renko indicator in the main chart window at the location with the current price. The indicator displays price changes in the form of rectangles ("bricks") against the background of a regular quote chart. The upward movement of the price, by the number of points specified in the settings, is marked by adding above the previous next rectangle, and downward movement - below the previous rectangle. The indicator is designed to visually identify the main trend. Used to identify key su
A visualization system for favorite candlesticks price action patterns. Once attached, indicator will automatically mark next patterns on the chart: Pinocchio bar  - a small-body bar with a long 'nose', very well-known reverse pattern; Inside bar  - a bar whose range lies inside the range of the previous bar. It represents market incertitude; Outside bar  - a bar whose range exceeds the range of the previous bar. It represents market incertitude; Rails pattern  - two consequent opposite bars wit
Trend Channel is a Forex trend arrow indicator for identifying potential entry points. I like it, first of all, because it has a simple operating mechanism, adaptation to all time periods and trading tactics. Created based on a regression channel with filters. We display the signals of the Trend Channel indicator on the price function chart using a mathematical approach. How it works: when the price breaks through the overbought/oversold zone (channel levels), a buy or sell signal is generate
Brick diagram-an alternative way of trading If you are a trader who is confused by the candlesticks in countless charts, or don’t know how to draw lines or how to draw support and resistance lines, you should find another trading method that suits you at this time. NS. Just like a driver will stop for a full overhaul after repeated encounters, the same is true for a transaction. The brick chart provides a simple trading method for intraday traders. In fact, this method has the same history as K-
Renko is a well-known Japanese charting technique that removes time from the chart. Instead of drawing bars in constant intervals (time) as a normal chart would, a Renko chart does so only when price moves beyond a predefined amount. In a Renko chart, a bar is created when price exceeds the previous bar’s high or low by a predefined amount or what we call the Box Size. The result is a chart with equally sized bars running up or down in 45 degree angles. Such a chart offers the following advant
Market Imbalance MT5
Scott Edward Merritt
What Is Market Imbalance? Market Imbalance, also known as "IPA" or Improper Price Action, is when price moves so quick in one direction with no orders on the other side of the market to mitigate the price movement. We all know Big Banks, or "Smart Money", can move the market by placing huge orders which in turn can move price significantly. They can do this because Big Banks are the  top 10 Forex traders in the world . But unfortunately, the Big Banks cannot leave these orders in drawdown and mu
Macd Rsi
Ignacio Agustin Mene Franco
macd rsi It is a macd indicator added to the rsi to capture perfect entries in the average crossovers! As seen in the indicator, it has 2 lines, one of gold color and the other violet line, where the cross of the violet with the gold downwards is a sell signal when it crosses the violet up from the gold it is a buy signal! very good to make shorts works for forex markets and synthetic indices It is used in any temporality! Good profit! World Investor.
This is Gekko's Cutomized Cutomized Average Directional Index (ADX), a customized version of the famous ADX indicator. Use the regular ADX and take advantage two entry signals calculations and different ways of being alerted whenever there is potential entry or exit point. Inputs Period: Period for the ADX calculation; PlotSignalType: How will the indicator calculate entry (swing) signals: 1- ShowSwingsOnTrendLevel : Show Signals for Trend Confirmation Swings; 2- ShowSwingsOnTrendLevelDirectio
Matreshka
Dimitr Trifonov
5 (1)
Matreshka self-testing and self-optimizing indicator: 1. Is an interpretation of the Elliott Wave Analysis Theory. 2. Based on the principle of the indicator type ZigZag, and the waves are based on the principle of interpretation of the theory of DeMark. 3. Filters waves in length and height. 4. Draws up to six levels of ZigZag at the same time, tracking waves of different orders. 5. Marks Pulsed and Recoil Waves. 6. Draws arrows to open positions 7. Draws three channels. 8. Notes support and re
Trend Direction ADX indicator Trend Direction ADX is part of a serie of indicators used to characterize market conditions. Almost any strategy only work under certain market conditions. Therefore it is important to be able to characterize market conditions at any time: trend direction, trend strength, volatility, etc.. Trend Direction ADX is an indicator to be used to characterize trend direction: trending up trending down ranging Trend Direction ADX is based on ADX standard indicator.
RENKO PRICE ACTION ATR is an "Expert Advisor" developed through the construction of the Renko Chart where each BRICK has the size calculated through the ATR of the period selected by the user. Renko charts are designed to filter out minor price movements, thus making it easier for traders to focus on important trends. Due to its efficiency in detecting price trends, it is also possible to clearly identify supports and resistances as well as top and bottom divergences, thus making better use of t
Weis Wave Double Side
Eduardo Da Costa Custodio Santos
The Weis Wave Bouble Side Indicator for MT5 is part of the toolkit (Wyckoff Academy Wave Market) The Weis Wave Bouble side Indicator for MT5 was created based on the already established Weis Wave created by David Weis. The Weis Wave Double Side indicator reads the market in waves as it was done by R. Wyckoff in 1900. It helps in the identification of effort x result, cause and effect, and Supply and demand Its differential is that it can be used below the zero axis, further improving plus operat
Smooth Patterns
Roman Vashchilin
Trading patterns on Forex is considered to be the highest level of trading, since it usually requires years of mastering various patterns (shapes and candle combinations) and the ways they affect the price. Patterns are different combinations of Japanese candles on a chart, shapes of classical technical analysis, as well as any regularities of the market behavior repeating many times under the same conditions. After the patterns appear on a chart, the price starts behaving in a certain way allow
All about time and price by ICT. This indicator provides a comprehensive view of ICT killzones, Silver Bullet times, and ICT Macros, enhancing your trading experience.  In those time windows price either seeks liquidity or imbalances and you often find the most energetic price moves and turning points. Features: Automatic Adaptation: The ICT killzones intelligently adapt to the specific chart you are using. For Forex charts, it follows the ICT Forex times: In EST timezone: Session: Asia: 20h00-0
Rediscover how fractals can transform your trading This is a very simple yet effective indicator to trade breakouts of variable fractal periods. A fractal is a price formation of an odd number of bars, being the middle bar the highest or lowest price point of the formation. These prices act as short-term support and resistance levels, which this indicator uses to draw a price channel and display breakouts. [ Installation Guide | Update Guide | Troubleshooting | FAQ | All Products ] Easy to tra
Volume Bars
DARIO GALLIONE
An effective indicator that highlights candles with increasing volumes, overshadowing those with shrinking volumes. Also suitable for Forex because it uses tick_volume.  You can set the colors to your liking. It will be easier to spot trends and possible reversals. The increasing volumes indicate the presence of large investors and therefore determine the reliability of the candle under observation
Bands are a form of technical analysis that traders use to plot trend lines that are two standard deviations away from the simple moving average price of a security. The goal is to help a trader know when to enter or exit a position by identifying when an asset has been overbought or oversold. This indicator will show upper and lover bands. You can change input parameters nPeriod and  nMethod to calculate those bands for each timeframe. Aqua clouds represent up or down trends.
Candle Range Theory - CRT Mark Candle Range Theory - CRT  bars on the chart. Options: choose between   2 bar CRT or  CRT that include inside bars Show higher time frame CRT on lower time frame chart show current time frame CRT on chart with higher time frame CRT Alert when new CRT has formed Show / Hide Labels Button Menu to select Options for more information on using Candle Range Theory - CRT look on X for @Romeotpt @SpeculatorFL
This plots  Fibonacci deviation levels above and below a moving average of the price. Companion indicator to the " Golden Bull Wave Trader "  expert advisor which uses volume\price trend to determine price reversals. https://www.mql5.com/en/market/product/56291 The expert advisor and this indicator were created in order to: Identify ideal and repeatable trade entries with high level of certainty Create a day trading strategy which doesn’t require a hard SL and TP Use alternate risk management me
Was: $249  Now: $99   Market Profile defines a number of day types that can help the trader to determine market behaviour. A key feature is the Value Area, representing the range of price action where 70% of trading took place. Understanding the Value Area can give traders valuable insight into market direction and establish the higher odds trade. It is an excellent addition to any system you may be using. Inspired by Jim Dalton’s book “Mind Over Markets”, this indicator is designed to suit the
True Weis Wave
Atila Goncalves Firmino
A version based on David Waves' description in his book 'Trade About to Happen' of his adaptation of the Wyckoff wave chart. The indicator directionally accumulates volume, adding to each brick or candle close, with color indication for up and down. it can be used it with tick or real volume, it also changes color when the accumulated value of the previous wave is exceeded, being the trade signal. Yellow color is used for doji candlestick, it will continue with accumulation without zero the sum
CandleStick MT5
Du Zhi Shan Tian
5 (1)
What you can do with CandleStick CandleStick is a useful indicator for doing MTF analysis. This indicator displays the CandleStick of another time frame on the chart . By understanding the information in multiple time charts at the same time, it is easier to understand the overall market view. It is also a useful tool for validating and studying past quotes and trades. There are similar products made by others, but I designed and developed it so that it is easy for me to use. Features of Candl
Buyers of this product also purchase
TPSpro RFI Levels MT5
Roman Podpora
4.75 (12)
A key element in trading is zones or levels from which decisions to buy or sell a trading instrument are made. Despite attempts by major players to conceal their presence in the market, they inevitably leave traces. Our task was to learn how to identify these traces and interpret them correctly. INSTRUCTIONS    RUS   -    ENG           R ecommended to use with an indicator   -   TPSpro  TREND PRO -  Version MT4 Main functions:: Displaying active zones for sellers and buyers! The indicator show
TPSproTREND PrO MT5
Roman Podpora
4.89 (9)
TPSpro TREND PRO  - is a trend indicator that automatically analyzes the market and provides information about the trend and each of its changes, as well as giving signals for entering trades without redrawing! The indicator uses each candle, analyzing them separately. referring to different impulses - up or down impulse. Exact entry points into transactions for currencies, crypto, metals, stocks, indices!  Version MT4               DETAILED DESCRIPTION               R ecommended to use with an
Atomic Analyst MT5
Issam Kassas
4.32 (19)
First of all Its worth emphasizing here that this Trading Indicator is   Non-Repainting   , Non Redrawing and Non Lagging Indicator   Indicator, Which makes it ideal from both manual and robot trading.  User manual: settings, inputs and strategy . The Atomic Analyst  is a PA Price Action Indicator that uses Strength and Momentum of the price to find a better edge in the market. Equipped with Advanced filters which help remove noises and false signals, and Increase Trading Potential. Using Mult
This dashboard shows the latest available   harmonic patterns   for the selected symbols, so you will save time and be more efficient /   MT4 version . Free Indicator:   Basic Harmonic Pattern Comparison of "Basic Harmonic Pattern" vs. "Basic Harmonic Patterns Dashboard" Indicators Feature Basic Harmonic Pattern Basic Harmonic Patterns Dashboard Functionality Detects and displays harmonic patterns on a single chart Searches multiple symbols and timeframes for harmonic patterns, displays
First of all Its worth emphasizing here that this Trading System is Non-Repainting   , Non Redrawing and Non Lagging Indicator Which makes it ideal from both manual and robot trading .  Online course, manual and download presets. The Smart Trend Trading System MT5 is a comprehensive trading solution tailored for new and experienced traders . It combines over 10 premium indicators and features more than 7 robust trading strategies , making it a versatile choice for diverse market conditions . Tre
Gann Squares Indicator: Analyzing Markets with Geometric Patterns The Gann Squares indicator is a powerful tool for market analysis that draws upon the mathematical concepts introduced by W.D. Gann in his article on "Mathematical Formula for Market Predictions." This indicator incorporates Gann's techniques involving square numbers such as 144, 90, and 52, as well as the Square of 9. Additionally, it incorporates  method for utilizing the Square of 9 in conjunction with channels and the star pa
FxaccurateLS
Shiv Raj Kumawat
WHY IS OUR FXACCCURATE LS MT5 THE PROFITABLE ? PROTECT YOUR CAPITAL WITH RISK MANAGEMENT Gives entry, stop and target levels from time to time. It finds Trading opportunities by analyzing what the price is doing during established trends. POWERFUL INDICATOR FOR A RELIABLE STRATEGIES We have made these indicators with a lot of years of hard work. It is made at a very advanced level. Established trends provide dozens of trading opportunities, but most trend indicators completely ignore them!
TPA True Price Action indicator reveals the true price action of the market makers through 100% non-repainting signals strictly at the close of a candle! TPA shows entries and re-entries, every time the bulls are definitely stronger than the bears and vice versa. Not to confuse with red/green candles. The shift of power gets confirmed at the earliest stage and is ONE exit strategy of several. There are available now two free parts of the TPA User Guide for our customers. The first "The Basics"
FX Volume MT5
Daniel Stein
4.93 (14)
Visit our all-new   Stein Investments Welcome Page   to get the latest information, updates and trading strategies. FX Volume is the FIRST and ONLY volume indicator that provides a REAL insight into the market sentiment from a broker's point of view. It provides awesome insights into how institutional market participants, like brokers, are positioned in the Forex market, much faster than COT reports. Seeing this information directly on your chart is the real game-changer and breakthrough solut
FX Power MT5 NG
Daniel Stein
5 (5)
Trading GOLD, and currencies, with the dog walk strategy  - super smart Trading GOLD, and currencies, with the breakout strategy  - super easy Visit our all-new   Stein Investments Welcome Page   to get the latest information, updates and trading strategies. FX Power MT5 NG  is the next generation of our long-time very popular currency strength meter, FX Power.  And what does this next-generation strength meter offer? Everything you have loved about the original FX Power  PLUS GOLD/XAU st
Quantum Trend Sniper
Bogdan Ion Puscasu
4.8 (49)
Introducing   Quantum Trend Sniper Indicator , the groundbreaking MQL5 Indicator that's transforming the way you identify and trade trend reversals! Developed by a team of experienced traders with trading experience of over 13 years,   Quantum Trend Sniper Indicator   is designed to propel your trading journey to new heights with its innovative way of identifying trend reversals with extremely high accuracy. ***Buy Quantum Trend Sniper Indicator and you could get Quantum Breakout Indicator fo
Best Solution for any Newbie or Expert Trader! This Indicator is a unique, high quality and affordable trading tool because we have incorporated a number of proprietary features and a new formula. With only ONE chart you can read Currency Strength for 28 Forex pairs! Imagine how your trading will improve because you are able to pinpoint the exact trigger point of a new trend or scalping opportunity? User manual:   click here That's the first one, the original! Don't buy a worthless wannabe clone
Top indicator for MT5   providing accurate signals to enter a trade without repainting! It can be applied to any financial assets:   forex, cryptocurrencies, metals, stocks, indices .  Watch  the video  (6:22) with an example of processing only one signal that paid off the indicator! MT4 version is here It will provide pretty accurate trading signals and tell you when it's best to open a trade and close it. Most traders improve their trading results during the first trading week with the help of
Gartley Hunter Multi
Siarhei Vashchylka
5 (8)
Gartley Hunter Multi - An indicator for searching for harmonic patterns simultaneously on dozens of trading instruments and on all possible timeframes. Manual (Be sure to read before purchasing) | Version for MT4 Advantages 1. Patterns: Gartley, Butterfly, Shark, Crab. Bat, Alternate Bat, Deep Crab, Cypher 2. Simultaneous search for patterns on dozens of trading instruments and on all possible timeframes 3. Search for patterns of all possible sizes. From the smallest to the largest 4. A
Blahtech Supply Demand MT5
Blahtech Limited
4.54 (13)
Was: $299  Now: $99   Supply Demand uses previous price action to identify potential imbalances between buyers and sellers. The key is to identify the better odds zones, not just the untouched ones. Blahtech Supply Demand indicator delivers functionality previously unavailable on any trading platform. This 4-in-1 indicator not only highlights the higher probability zones using a multi-criteria strength engine, but also combines it with multi-timeframe trend analysis, previously confirmed swings
PTS - Divergence Buy Finder by Precision Trading Systems Precision Divergence Finder was designed to find market bottoms with pinpoint accuracy and frequently does so. In technical analysis, the art of picking bottoms is generally much easier than picking tops this item is designed precisely for this task. After a bullish divergence is identified then it is wise to wait for the trend to turn up before buying. You can use a 10 or 20 bar high to enter or a moving average 15-30 to be rising to id
GannRS Trend Scalper   GannRS is an advanced trading tool based on Gann Law and Supports and Resistances. designed to have an   active trading at any time not lagging Indications are given at the beginning of a new candle Please watch the full tutorial video. How to use GannRS Very easy to set up... Put it on your chart Adjust inputs Inputs Show Resistance and support : [bool]  true = Shows R/S on chart false = does not show Show Levels :[bool]  true = Shows levels on the chart false = doe
Limited Special now on!  GET 28% OFF! Was $249, now only $179!  Looking for a powerful forex trading indicator that can help you identify profitable trading opportunities with ease? Look no further than the Beast Super Signal. This easy-to-use trend-based indicator continuously monitors the market conditions, searching for new developing trends or jumping in on existing ones. The Beast Super Signal gives a buy or sell signal when all internal strategies align and are in 100% confluence with e
PZ Swing Trading MT5
PZ TRADING SLU
5 (4)
Protect against whipsaws: revolutionize your swing trading approach Special Offer: Purchase now to receive free bonuses worth $135! (Read more for details) Swing Trading is the first indicator designed to detect swings in the direction of the trend and possible reversal swings. It uses the baseline swing trading approach, widely described in trading literature. The indicator studies several price and time vectors to track the aggregate trend direction and detects situations in which the market i
[ MT4 Version ] Only the next 10 units at current price! Final price: $299 Are you tired of spending months on demo or live accounts to test your trading strategies? The Backtesting Simulator is the ultimate tool designed to elevate your backtesting experience to new heights. Utilizing Metatrader historical symbol information, it offers an unparalleled simulation of real market conditions. Take control of your testing speed, test ideas quickly or at a slower pace, and witness remarkable improve
Trend Hunter MT5
Andrey Tatarinov
5 (2)
Trend Hunter is a trend indicator for working in the Forex, cryptocurrency, and CFD markets. A special feature of the indicator is that it confidently follows the trend, without changing the signal when the price slightly pierces the trend line. The indicator is not repaint; a signal to enter the market appears after the bar closes. When moving along a trend, the indicator shows additional entry points in the direction of the trend. Based on these signals, you can trade with a small StopLoss. Tr
Royal Scalping Indicator M5
Vahidreza Heidar Gholami
5 (6)
Royal Scalping Indicator is an advanced price adaptive indicator designed to generate high-quality trading signals. Built-in multi-timeframe and multi-currency capabilities make it even more powerful to have configurations based on different symbols and timeframes. This indicator is perfect for scalp trades as well as swing trades. Royal Scalping is not just an indicator, but a trading strategy itself. Features Price Adaptive Trend Detector Algorithm Multi-Timeframe and Multi-Currency Trend Low
AT Forex Indicator MT5
Marzena Maria Szmit
5 (4)
The AT Forex Indicator MT5 is a sophisticated trading tool designed to provide traders with a comprehensive analysis of multiple currency pairs. This powerful indicator simplifies the complex nature of the forex market, making it accessible for both novice and experienced traders. AT Forex Indicator uses advanced algorithms to detect trends, patterns and is an essential tool for traders aiming to enhance their forex trading performance. With its robust features, ease of use, and reliable signal
TrendMaestro5
Stefano Frisetti
note: this indicator is for METATRADER4, if you want the version for METATRADER5 this is the link:  https://www.mql5.com/it/market/product/108106 TRENDMAESTRO ver 2.4 TRENDMAESTRO recognizes a new TREND in the bud, he never makes mistakes. The certainty of identifying a new TREND is priceless. DESCRIPTION TRENDMAESTRO identifies a new TREND in the bud, this indicator examines the volatility, volumes and momentum to identify the moment in which there is an explosion of one or more of these data a
Owl Smart Levels MT5
Sergey Ermolov
4.07 (28)
MT4 version  |   FAQ The Owl Smart Levels Indicator is a complete trading system within the one indicator that includes such popular market analysis tools as Bill Williams' advanced fractals , Valable ZigZag which builds the correct wave structure of the market, and Fibonacci levels which mark the exact levels of entry into the market and places to take profits. Detailed description of the strategy Instructions for working with the indicator Advisor-assistant in trading Owl Helper Private User
Bill Williams Advanced
Siarhei Vashchylka
5 (8)
Bill Williams Advanced is designed for automatic chart analysis using Bill Williams' "Profitunity" system. The indicator analyzes four timeframes at once. Manual (Be sure to read before purchasing) Advantages 1. Automatically analyzes the chart using the "Profitunity" system of Bill Williams. The found signals are placed in a table in the corner of the screen. 2. Equipped with a trend filter based on the Alligator indicator. Most of the system signals are recommended to be used only accordi
How many times have you bought a trading indicator with great back-tests, live account performance proof with fantastic numbers and stats all over the place but after using it, you end up blowing your account? You shouldn't trust a signal by itself, you need to know why it appeared in the first place, and that's what RelicusRoad Pro does best! User Manual + Strategies + Training Videos + Private Group with VIP Access + Mobile Version Available A New Way To Look At The Market RelicusRoad is
MetaTrend M5
Vahidreza Heidar Gholami
Meta Trend Indicator is an efficient way to forecast and detect the trend in any market. It reveals the trend, support and resistance levels, volatility and the maximum potential target, all in one indicator. To adapt to the price and to decrease consecutive trend failures, the internal trend detector algorithm studies the market and dynamically chooses the right values for the internal parameters. This indicator is a perfect trend filter for any strategy or expert advisor. Features Super Adapti
Advanced Supply Demand MT5
Bernhard Schweigert
4.5 (14)
Best Solution for any Newbie or Expert Trader! This indicator is a unique, high quality and affordable trading tool because we have incorporated a number of proprietary features and a new formula. With this update, you will be able to show double timeframe zones. You will not only be able to show a higher TF but to show both, the chart TF, PLUS the higher TF: SHOWING NESTED ZONES. All Supply Demand traders will love it. :) Important Information Revealed Maximize the potential of Advanced Suppl
Golden Spikes Premium
Kwaku Bondzie Ghartey
5 (1)
Golden Spikes Detector Acknowledgement and Dedications:  The name of this indicator was Inspired by an Original; Mr Grant Koopman; a Knowledgeable and experienced Synthetics trader. I dedicate this indicator to Mr Grant.  Overview: The Golden Spikes Premium is a groundbreaking trading indicator meticulously crafted for the Boom and Crash indices on the Deriv market. Tailored to meet the needs of discerning traders, this powerful tool operates exclusively on the one-minute timeframe, providin
More from author
AI Channel
Thalles Nascimento De Carvalho
4.2 (5)
Welcome to the presentation of the AI Channel indicator, a powerful tool that uses artificial intelligence for price channel analysis in the financial market. In this session, we will explore how this revolutionary indicator can assist investors and traders in making more informed and strategic decisions. Let's get started! I. What is the AI Channel indicator? AI Channel is an indicator developed based on advanced artificial intelligence algorithms. It utilizes historical price data of financial
FREE
SwingVolumePro
Thalles Nascimento De Carvalho
Overview The SwingVolumePro is an advanced and versatile indicator, designed to be applied to a wide range of financial assets and support different trading styles. Developed based on rigorous volume and price analysis, it offers clear and precise signals that allow traders of all levels to make informed decisions based on high-quality data.      SwingVolumePro.PDF Key Features Versatility: SwingVolumePro can be applied to various assets, including stocks, forex, cryptocurrencies,
Cumulative Volume Bands
Thalles Nascimento De Carvalho
CVB Cumulative Volume Bands: Maximize Your Trades with Accumulated Volume! The CVB Cumulative Volume Bands is an advanced indicator designed for traders seeking precise insights based on accumulated volume. By using cumulative volume bands, this indicator offers clear readings of market buying and selling pressures, helping to identify reversals and strong price movements. Cumulative Volume Bands for MT5 ! Key Features: Accumulated Volume Analysis : Detect pressure points based
FREE
Box Weis Wave
Thalles Nascimento De Carvalho
5 (1)
Elevate Your Analysis with the Weis Wave Box! If you’re looking for precision and clarity in your trading, the Weis Wave Box is the tool you need. This advanced indicator offers a detailed visual analysis of volume waves and swing points, helping you better understand the relationship between effort and results in the market. Key Features of the Weis Wave Box: Customizable Volume Waves: Adjust volume waves in ticks to fit your trading strategies. Adjustable History: Focus on specific
Swing Point Volume
Thalles Nascimento De Carvalho
Swing Point Volume, the indicator that signals weakness and strength at the tops and bottoms. This indicador can be for used the Wyckoff Method. Information provided; - Swing on customized ticks. - Volume and points in each balance sheet. - Percentage of Displacement. - Sound alert option on top and bottom breaks. - Volume in ticks and Real Volume. - Volume HL (extreme) or (opening and closing) - Customized volume shapes.
Atr Projection
Thalles Nascimento De Carvalho
The ATR Projection Indicator stands out as a robust tool in technical analysis, designed to provide accurate insights into potential price movement limits in the financial market. Its flexible approach allows users to customize analysis metrics intuitively, adapting to the specific needs of each traded asset. Customizable Operation: By default, the ATR Projection operates considering 30% of the average of the last 100 candles. This flexibility enables users to adjust metrics according to t
Long Short Pro
Thalles Nascimento De Carvalho
Long & Short Indicator - Pro Version: Unlock Unlimited Market Analysis Potential! No Restrictions for Any Asset The Pro version of the Long & Short Indicator offers complete freedom to use it on any financial asset. No more limits - apply the same indicator to all your favorite assets! No Restrictions Enjoy all the features of the indicator with no limitations. The Pro version provides a full, unrestricted experience, allowing you to maximize every market opportunity. Pro Versi
Didi Index Volume
Thalles Nascimento De Carvalho
Introducing the Didi Index Volume, a technical analysis indicator developed by Brazilian trader Odir Aguiar, which stands out for its advanced and powerful approach in identifying opportunities in the financial market. Available on various platforms, the Didi Index Volume has become an essential tool for traders seeking precise insights and valuable information for their trading strategies. The indicator combines the renowned Didi Index, created by Odir Aguiar, with intelligent use of trading v
Smart Binary Volume
Thalles Nascimento De Carvalho
The Smart Binary Volume indicator is a versatile tool that combines trading volume analysis with machine learning. It can be applied to various markets and strategies, including scalping and other short-term trading approaches. Using advanced machine learning algorithms, the indicator identifies complex patterns, generating more precise buy and sell signals. Usage tips: 1. Attention when the lines are opposite: Pay attention to situations where the lines of the Smart Binary Volume indicato
TimeChannel
Thalles Nascimento De Carvalho
The "Timechannel" is a powerful technical analysis tool designed specifically for traders who want to gain deeper and more accurate insights into price movements across multiple timeframes (multi-timeframe). This indicator is an essential addition to the toolbox of any serious trader seeking to make informed and data-driven trading decisions. Key Features: Advanced Multi-Timeframe Analysis : Timechannel allows traders to analyze price movements on different timeframes simultaneously. This is cr
Big Player Range
Thalles Nascimento De Carvalho
5 (2)
Discover the Power of "BigPlayerRange": Your Ally in Market Technical Analysis Introducing BigPlayerRange , an advanced technical analysis tool designed to reveal institutional interest areas in the market. With it, you'll precisely identify where major players are actively engaged and how this can impact your trading strategies. Key Features: Mapping Institutional Interest Areas : BigPlayerRange highlights zones of high institutional activity, providing valuable insights into potential m
Master OBV
Thalles Nascimento De Carvalho
MasterOBV: Master Market Trends with Precision! The MasterOBV is a technical analysis indicator that combines volume , positive correlation , and a Moving Average (MA) to refine trend identification in financial markets. Key Features: Smart Volume: Analyzes trading volume to identify significant changes in trend strength. Positive Correlation: Incorporates correlated assets for a broader and more accurate view, reinforcing the potential for price displacement based on pair volume.
Smart Delta Volume
Thalles Nascimento De Carvalho
Smart Delta Volume: Precise and Adaptable to Dynamic Market Conditions The Smart Delta Volume is an advanced technical indicator designed to offer precise and adaptable analysis in the face of constant market changes. By utilizing dynamic levels that automatically adjust to volatility, this indicator provides a more comprehensive and reliable view of the interplay between volume flow and price action. This adaptability is crucial for traders seeking quick and accurate insights, especially in
VolaMetrics VSA
Thalles Nascimento De Carvalho
VolaMetrics VSA | A Powerful Ally in Technical Analysis The VolaMetrics VSA is a technical analysis indicator that combines the Volume Spread Analysis (VSA) methodology with detailed analysis of trading volume . Designed to identify and track significant price movements , VolaMetrics VSA uses the interaction between volume and price spread to provide valuable insights that can aid in trading decisions. Fundamentals of Volume Spread Analysis (VSA) Volume Spread Analysis (VSA) is a respected
CVD SmoothFlow Pro
Thalles Nascimento De Carvalho
CVD SmoothFlow Pro - Unlimited Volume Analysis for Any Asset! CVD SmoothFlow Pro is the ultimate solution for traders seeking precise and unlimited volume analysis. Utilizing Cumulative Volume Delta (CVD) with advanced noise filtering, the Pro Version provides the flexibility and precision needed to trade any financial asset. What does CVD SmoothFlow Pro offer? Clear Analysis : Filters out noise and highlights significant volume movements across any financial asset. ️ Precise Calculation
VolumeSecret
Thalles Nascimento De Carvalho
VolumeSecret: The Power of Volume in Your Hands In the challenging world of programming, we constantly face obstacles that push us to grow and evolve. We deeply understand the difficulties imposed by the market and how traders struggle to achieve peak performance. That’s why we work tirelessly to develop innovative solutions that make market decision-making smoother and more precise. VolumeSecret is the result of this dedication. This advanced indicator combines volume analysis with a sophistica
Imbalance DOM Pro
Thalles Nascimento De Carvalho
Imbalance DOM Pro: Boost Your Trades with Order Book Imbalance Opportunities in Small Price Movements The Imbalance DOM Pro is an essential tool for analysts who operate using order flow . Perfect for scalpers , it is designed for those who seek to capitalize on small price movements with high precision. With advanced calculations, the indicator identifies imbalances in the order book , providing valuable signals for quick entry and exit. IMPORTANT: Book Availability on MT5 Before
ZigWave Oscillator
Thalles Nascimento De Carvalho
ZigWave Oscillator: Enhance Your Trades with Oscillators and ZigZag! The ZigWave Oscillator is the perfect tool for traders seeking precision and clarity in financial market analysis. This indicator combines the strength of oscillators with the visual simplicity of ZigZag, helping you identify the best buying and selling opportunities quickly and efficiently. Why Choose the ZigWave Oscillator? Precise Oscillator Analysis : Integrate RSI, Williams %R, or CCI to capture key market moveme
Filter:
No reviews
Reply to review