• Overview
  • Reviews
  • Comments
  • What's new

CustomRsi50

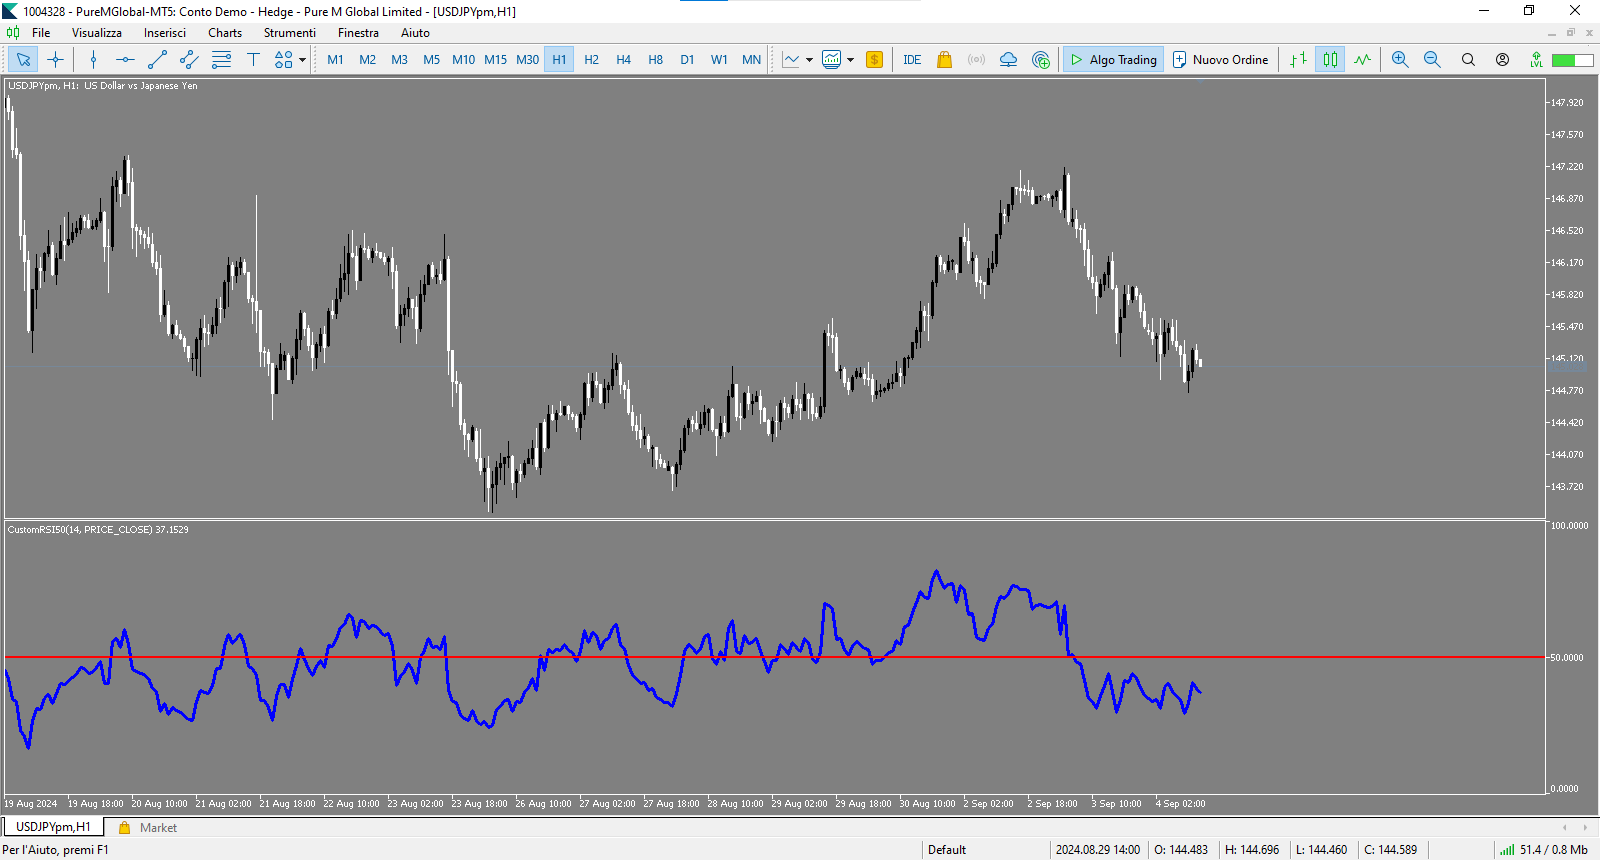
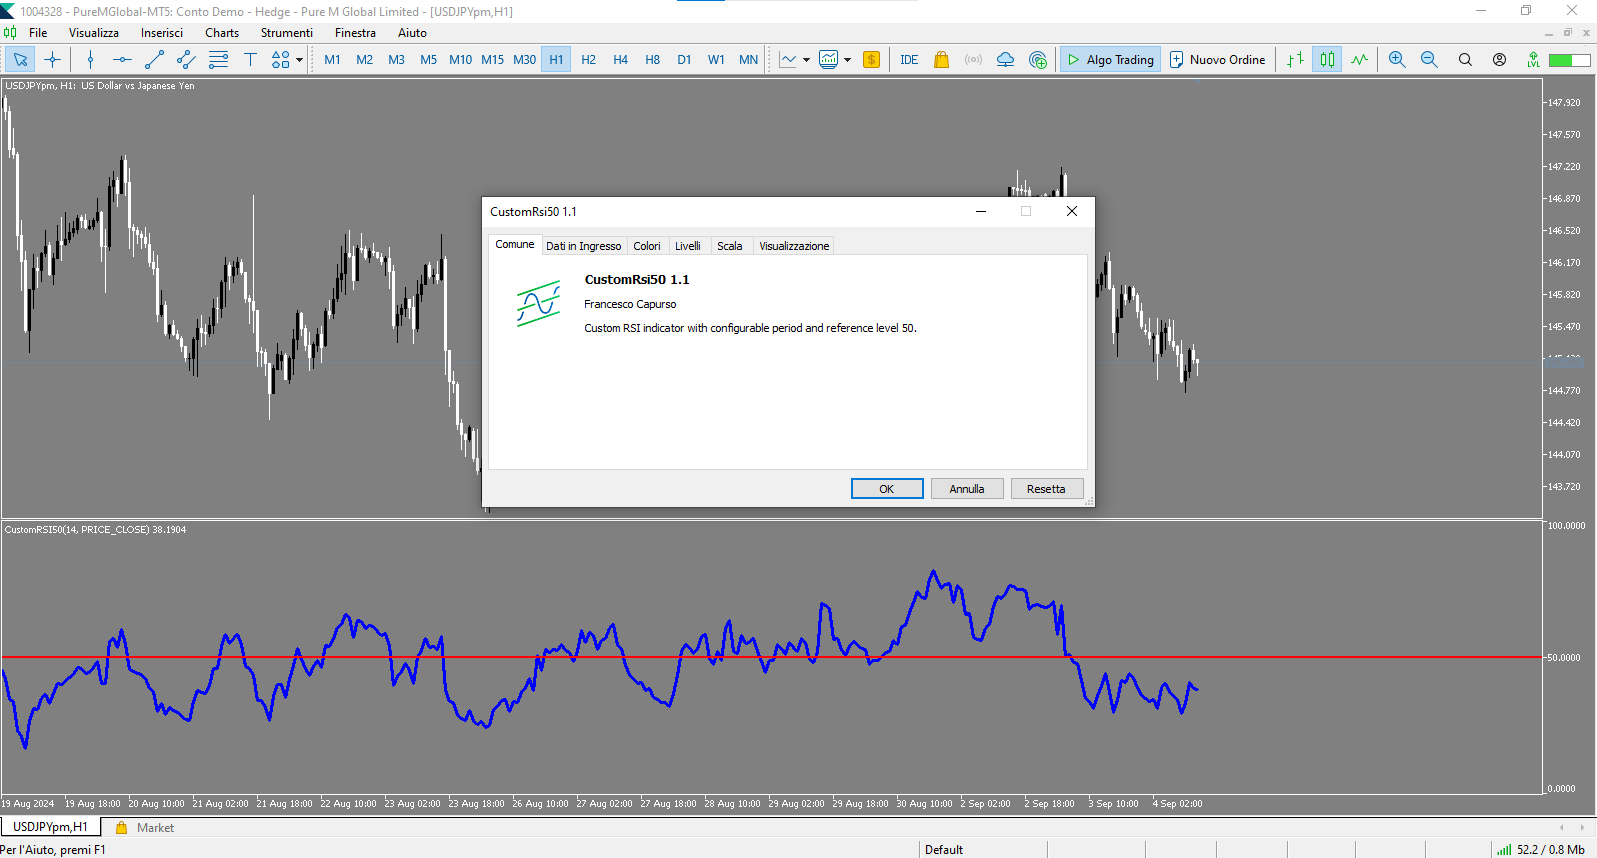
CustomRSI50 - Custom RSI Indicator with Level 50

Description

CustomRSI50 is a custom technical indicator based on the popular Relative Strength Index (RSI). This indicator offers a clear and customizable visualization of RSI with a particular emphasis on the level 50, which is crucial for many traders in momentum analysis.

Key Features

  • Configurable RSI period
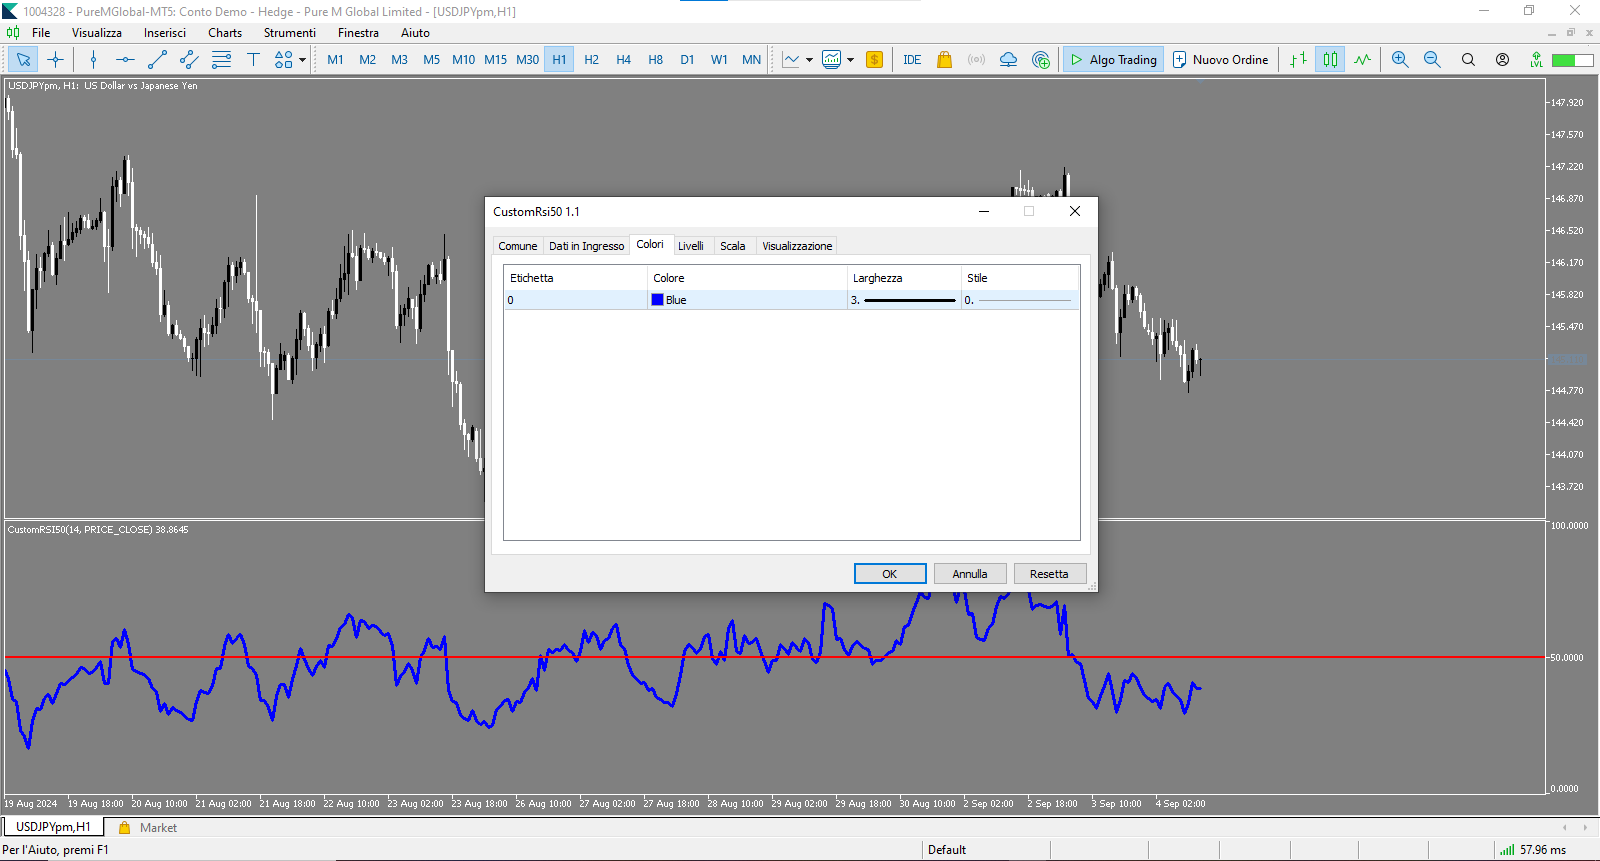
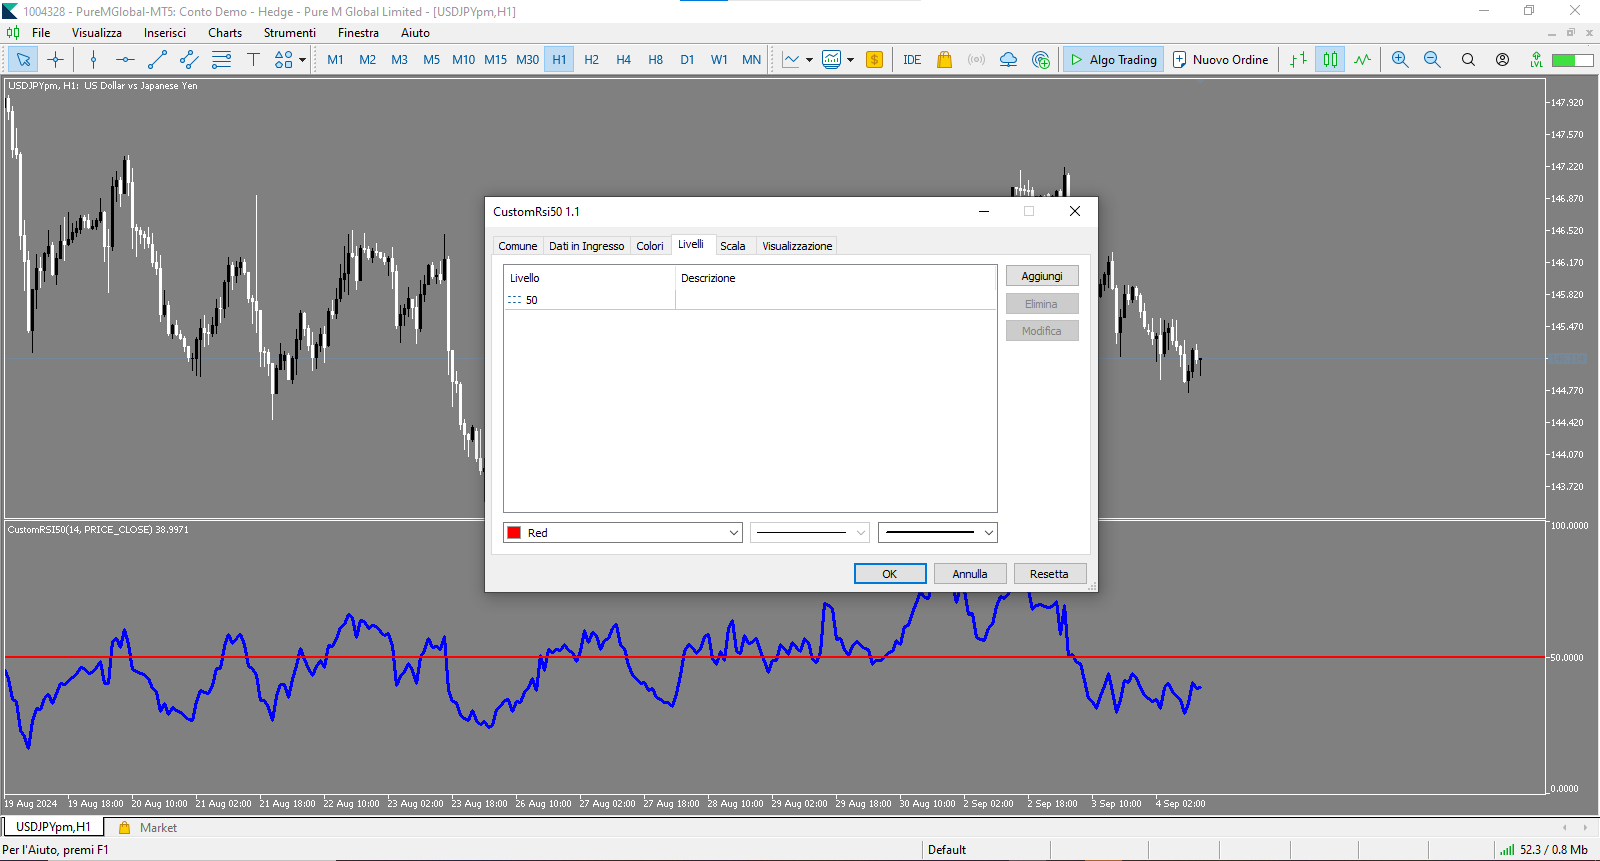
  • Highlighted level 50 reference
  • Customizable applied price type
  • Display in separate window
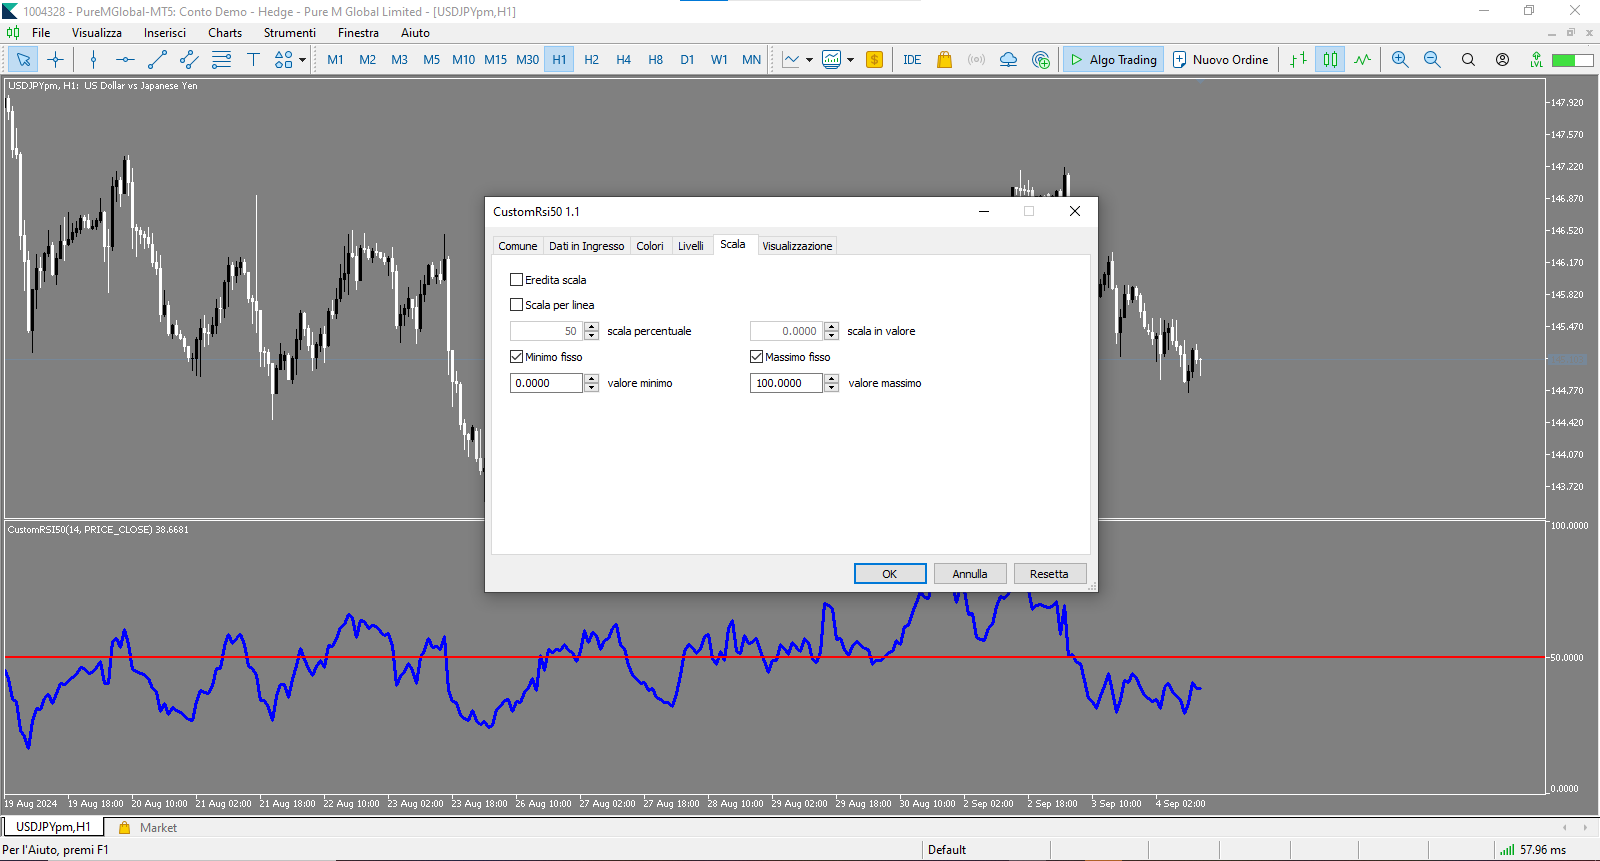
  • Fixed scale from 0 to 100 for easy interpretation

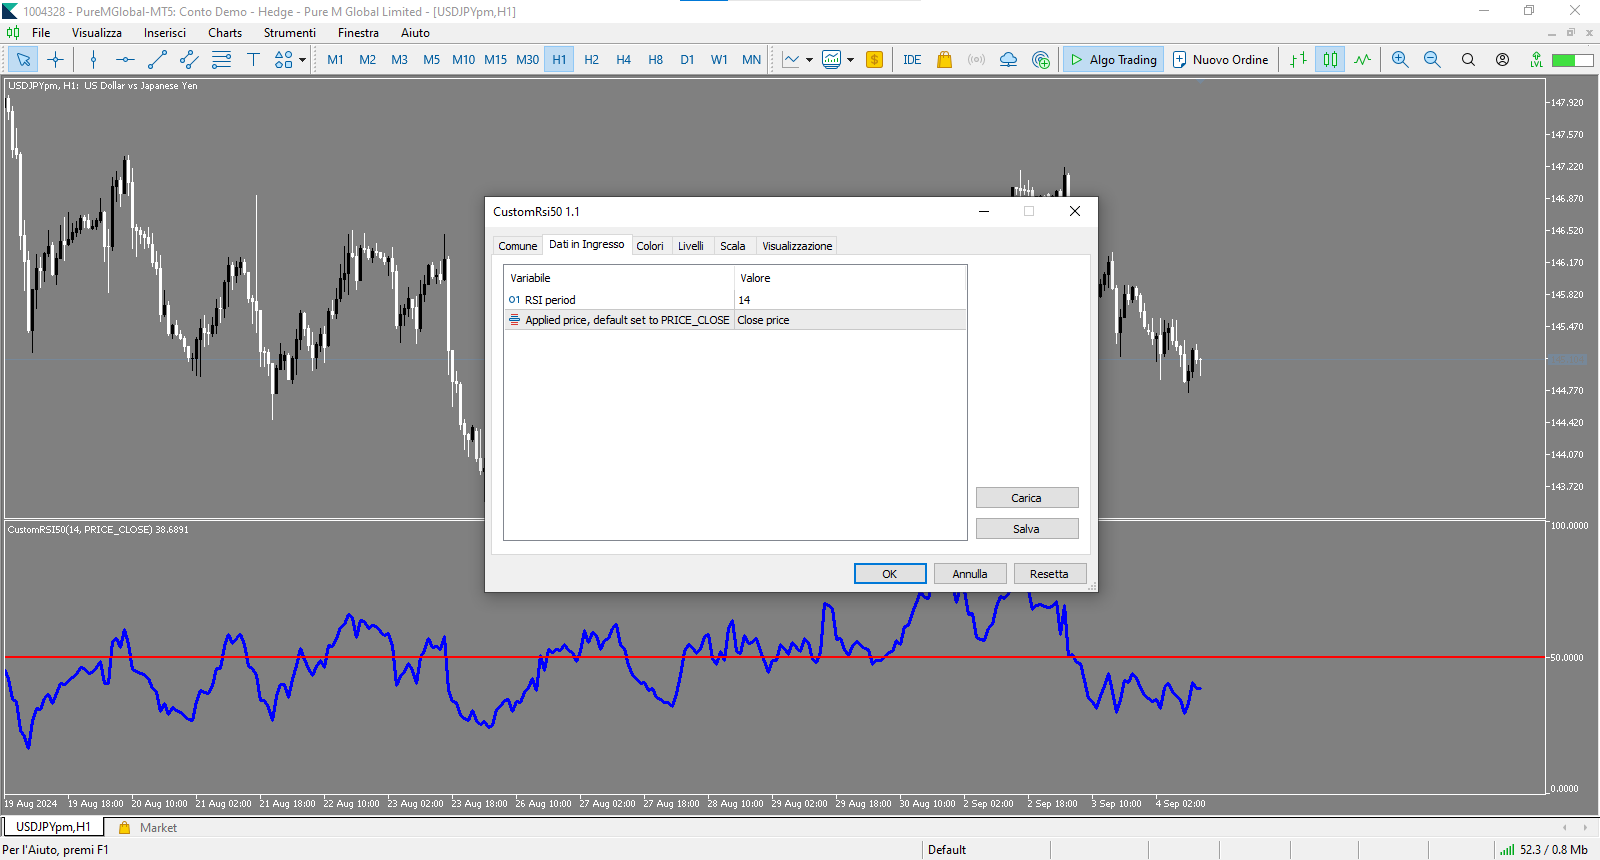
Customizable Parameters

  • RSI_Period: Allows setting the period for RSI calculation (default: 14)
  • applied_price: Allows selecting the price type for calculation (default: Close price)

How to Use CustomRSI50

  1. Apply the indicator to any chart in your MetaTrader 5
  2. Customize the RSI period and price type according to your preferences
  3. Observe the RSI movement in relation to the 50 level:
    • Values above 50 indicate bullish momentum
    • Values below 50 indicate bearish momentum

Advantages

  • Clear visualization of market momentum
  • Easy identification of trend changes around level 50
  • Customization to adapt to various trading strategies

CustomRSI50 is the ideal tool for traders who want a clear and customizable RSI analysis, with a particular focus on the critical level 50.

Note

This indicator is provided free of charge to the trading community. Please leave feedback or a rating if you find it useful in your trading.

Changelog

Version 1.4 - 06/09/2024

  • Fixed display issue causing interruption in the RSI line.
  • Improved buffer initialization for more accurate RSI value representation across the chart.
  • Optimized RSI calculation for greater precision.
  • Added debug output to facilitate troubleshooting of potential future issues.
  • Enhanced data handling for smoother indicator visualization.

These updates significantly improve the stability and accuracy of the CustomRSI50 indicator, providing a more reliable visualization of market momentum.

Recommended products
We have all seen a currency pair enter the overbought or oversold territory and stay there for long periods of time. What this indicator does is gives you the emphasis. So if you are looking for reversals then you may want to take notice when oversold territory is entered into with a bullish engulfing candle or if the trend is your thing then check for bearish engulfing candles while entering oversold. This indicator will show a downward arrow when it detects a bearish engulfing candle while cro
FREE
RFOC Mini Chart
Ronaldo Franco De Oliveira Cardoso
The RFOC Mini Chart was created to project a macro view of the market, which the option to select the timeframe of interest other than the main chart, it is possible to include 2 indicators: 1 - Moving average channel On the mini chart, the moving average will be created based on the prices of the selected time frame for the RFOC Mini Chart. The moving average period must be selected in the indicator settings pannel. 2 - Boillinger Band In the mini chart, a boillinger band will be created base
FREE
If you are (or were) a fan of the RSI indicator will love Tushar Chande's Dynamic Momentum Index indicator, that simply put is a dynamic variable lenght RSI, so it is more powerful. The DMI indicator internally uses a variable number of bars in its calculations, taking into consideration the volatility levels of the current market you are analyzing. This way, the DMI indicator will use more bars as volatility decreases and less bars when volatility increases, giving you a more powerfull analysis
FREE
Follow The Line MT5
Oliver Gideon Amofa Appiah
4.5 (28)
This indicator obeys the popular maxim that: "THE TREND IS YOUR FRIEND" It paints a GREEN line for BUY and also paints a RED line for SELL. (you can change the colors). It gives alarms and alerts of all kinds. IT DOES NOT REPAINT and can be used for all currency pairs and timeframes. Yes, as easy and simple as that. Even a newbie can use it to make great and reliable trades. NB: For best results, get my other premium indicators for more powerful and reliable signals. Get them here: https://www.m
FREE
Multi RsI BB MT5
Mansour Babasafary
5 (1)
A combined indicator of two famous indicators: RSI , Bollinger Bands Can be used in all currency pairs Can be used in all time frames with many signals Very simple and fast to use Description: This indicator is made from the combination of RSI and Bollinger Bands indicators As you can see, it shows good signals and is worth using and testing We hope you are satisfied with this indicator Settings: show past show candle: Displays the number of candles that the indicator calculates. For
FREE
Tunnel Warrens MT5
Dariel Iserne Carrera
This is MT5 version Get Tunnel Warrens MT4 here Here are several indicators that work together. It basically works with moving averages and various levels of ATR creating a dynamic channel through which the price is drained. As I always recommend, you should try it before using it in live so that you understand how it works. The market entry signal is similar to other MA indicators, but with this one you also have a graphical analysis of the moment when the trend is found and dynamic levels to
FREE
FractalEfficiencyIndicator   A ratio between 0 and 1 with the higher values representing a more efficient or trending market,  It is used in the calculation of Perry J. Kaufman Adaptive Moving Average (KAMA), dividing the price change over a period by the absolute sum of the price movements that occurred to achieve that change. The Fractal Efficiency or also known as Efficiency Ratio was first published by Perry J. Kaufman in his book   ‘Smarter Trading‘. This is mostly considered a filter for v
FREE
Mitimom
Danil Poletavkin
The indicator is based on Robert Miner's methodology described in his book "High probability trading strategies" and displays signals along with momentum of 2 timeframes. A Stochastic oscillator is used as a momentum indicator. The settings speak for themselves period_1 is the current timeframe, 'current' period_2 is indicated - the senior timeframe is 4 or 5 times larger than the current one. For example, if the current one is 5 minutes, then the older one will be 20 minutes The rest of the
FREE
Money Flow Index EA Friendly
Flavio Javier Jarabeck
3.5 (2)
The traditional Money Flow Index indicator, this time, EA friendly . There are 3 buffers exposed that can be used by EAs to automatically analyze the Overbought and Oversold conditions of the quote. Just use the traditional iCustom() function to get these signals. This Money Flow Index calculation is based on the traditional Metaquote's MFI indicator. SETTINGS MFI Period Volume type to analyze (Real Volume or Ticks) Starting Overbought region Starting Oversold region USING WITH EAs Buffer
FREE
Ribbon Trend for MT5
Sutthichai Mungdee
5 (4)
This indicator is a simple tool to spot a possible trend. When the ribbon below the price bars, It will turn to Green color and the trend is seen to be bullish When the   ribbon above the price bars, it will turn to Red color and the trend is seen to be bearish. It can be used a either Entry Signal Exit Signal or trailing stop, so it is very versatile. By default color : Green is UP trend and Red is Down trend and this work perfect with   Bar4Colors.ex5
FREE
An analogue of the Stochastic oscillator based on algorithms of singular spectrum analysis (SSA) SSA is an effective method to handle non-stationary time series with unknown internal structure. It is used for determining the main components (trend, seasonal and wave fluctuations), smoothing and noise reduction. The method allows finding previously unknown series periods and make forecasts on the basis of the detected periodic patterns. Indicator signals are identical to signals of the original i
FREE
TSO Stochastic RSI MT5
Dionisis Nikolopoulos
4.5 (2)
Stochastic RSI makes a stochastic calculation on the RSI indicator. The Relative Strength Index (RSI) is a well known momentum oscillator that measures the speed and change of price movements, developed by J. Welles Wilder. Features Find overbought and oversold situations. Sound alert when overbought/oversold level is reached. Get email and/or push notification alerts when a signal is detected. The indicator is non-repainting. Returns buffer values for %K and %D to be used as part of an EA. (s
FREE
RSI magic kjuta trial is the demo version of RSI magic kjuta. Custom Indicator (RSI magic kjuta) based on the standard   (Relative Strength Index, RSI) with additional settings and functions. The maximum and minimum RSI lines on the chart have been added to the standard RSI line. Now you can visually observe the past highs and lows of RSI, and not only the values of the closing bars, which avoids confusion in the analysis of trades. For example, the EA opened or closed an order, but the RSI l
FREE
IMA Finder MT5
Mubashir Mohamed Quraish Albarakat
1 (1)
This indicator is designed based on the Moving Origin indicator When the moving origin indicator breaks the price, this indicator gives a signal It is useful for better viewing of signals and analysis on them Attributes: Can be used in all symbols Can be used in all time frames Too many signals Simple and quick settings Easy way to work Settings: period: like moving average settings alarmShow: If you want to receive an alert in Metatrader after receiving the signal, enable this setting a
FREE
Bollinger Bands B
Flavio Javier Jarabeck
John Bollinger created this indicator in 2010 as a way to read the original indicator (Bollinger Bands) in a more "technical" way, shown as an oscillator. The typical range of the Bollinger Bands %B is 0 - 0.5 - 1.0, where "0" represents the lower band, the "0.5" the middle band, and "1" the upper band. The line on the indicator represents the Closing prices. As simple as that. SETTINGS Bollinger Bands period of analysis Standard Deviation multiplier Shift Price type to be analyzed If you
FREE
MP SMI for MT5
Pierre Ksachikian
The purpose of using Smart money index (SMI) or smart money flow index is to find out investors sentiment. The index was constructed by Don Hays and measures the market action. The indicator is based on intra-day price patterns. The beginning of the trading day is supposed to represent the trading by retail traders. The majority of retail traders overreact at the beginning of the trading day because of the overnight news and economic data. There is also a lot of buying on market orders and shor
FREE
Donchian Clouds
Samuel Manoel De Souza
The Indicator indicator draws 2 clouds based on Donchian Channels indicator values. The upper cloud is formed by the upper lines values and the lower cloud by the lowers lines values. The indicator allows to change the Channels parameters and the clouds colors the period of the base line and the multiplier of each Donchian Channels instance. The indicator holds 5 buffer index as follow: [0] - Outer values of the upper cloud [1]  - Inner values of the upper cloud [2]  - Base/Center line values [3
FREE
UpdatedRSI
ANO IDS
3.5 (2)
Modified and updated RSI indicator. Please use arrows on the chart to enter to deals and to exit from deals. The indicator is designed for all currency pairs and time-frames. Parameters: PeriodRSI - indicator period; OpenLevel - level for entering to deals (range diapason 0-100); CloseLevel - level for exiting from deals (range diapason 0-100); FlatMode - please enable this trigger in flat mode (i.e. if there are no determined trends).
FREE
ChannelRSI5
Iurii Tokman
5 (5)
ChannelRSI5   The Relative Strength Index (RSI) indicator with dynamic levels of overbought and oversold zones. Dynamic levels change and adjust to the current changes in the indicator and prices, and represent a kind of channel. Indicator settings period_RSI - Averaging period for calculating the RSI index. applied_RSI - The applied price. It can be any of the price constants: PRICE_CLOSE - Closing price, PRICE_OPEN - Opening price, PRICE_HIGH - Maximum price for the period, PRICE_LOW - Minim
FREE
Multi-timeframe trend indicator based on the ADX / ADXWilder indicator with Fibonacci levels The indicator shows trend areas using ADX or ADXWilder indicator data from multiple timeframes. The impulse mode of the indicator allows you to catch the beginning of a trend, and several "Screens" with different timeframes allow you to filter out market noise. Fibonacci levels are added to the price chart, which have flexible settings. How the indicator works: if PDI is greater than NDI, then   it`
FREE
The indicator identifies when a divergence occurs between price and an indicator or oscillator. It identifies both regular and hidden divergences. Combined with your own rules and techniques, this indicator will allow you to create (or enhance) your own powerful system. Features Can detect divergences for the following oscillators/indicators:   MACD, OsMA, Stochastics, RSI, CCI, RVI, Awesome, ADX, ATR, OBV, Composite index, MFI and Momentum. Only one oscillator/indicator can be selected. Draws
FREE
FT ROC Histogram
FLEK TRADING s.r.o.
3 (1)
The indicator displays the value of ROC (Rate of change) from the selected price or moving average as a histogram. You can plot the moving average ROC values for smoothing indicator. Displayed Data ExtROC - rate of change ExtMAROC - smoothing line Parameters You can change the price, on which the indicator is calculated. Inputs InpMAPeriod - in case you want to calculate the moving average ROC, enter averaging period. Enter 1 for the calculation of the specified prices. InpMAMethod - smoot
FREE
Multi-timeframe trend indicator, based on the ADX / ADXWilder indicator The indicator shows trend areas using ADX or ADXWilder indicator data from multiple timeframes. The impulse mode of the indicator allows you to catch the beginning of a trend, and several "Screens" with different timeframes allow you to filter out market noise. How the indicator works: if PDI is greater than NDI, then it`s bullish movement; if PDI is less than NDI, then it`s bearish movement; to determine any trend, it
FREE
Are you tired of drawing trendlines every time you're analyzing charts? Or perhaps you would like more consistency in your technical analysis. Then this is for you. This indicator will draw trend lines automatically when dropped on a chart. How it works Works similar to standard deviation channel found on mt4 and mt5. It has 2 parameters: 1. Starting Bar 2. Number of bars for calculation The   starting bar   is the bar which drawing of the trend lines will begin, while the   number of bars for c
FREE
TrailingStop MA
Andrej Nikitin
3.5 (2)
The indicator draws two simple moving averages using High and Low prices. The MA_High line is displayed when the moving average is directed downwards. It can be used for setting a stop order for a sell position. The MA_Low line is displayed when the moving average is directed upwards. It can be used for setting a stop order for a buy position. The indicator is used in the TrailingStop Expert Advisor. Parameters Period - period of calculation of the moving average. Deviation - rate of convergence
FREE
ThreePointsChannelFree
Dimitr Trifonov
5 (1)
This is a free version of the indicator, the period between the vertical lines is always 30 bars. In the paid version the period can be set by user, so a configuration with many ThreePointsChannel indicators with different periods is possible. The principle of construction - on top of any number of bars set by the user, a channel is constructed with maximum and minimum lines so that the bars touch the maximum and minimum of the channel at exactly three points. The name of the indicator follows
FREE
Forex Indicator Arrows
NGUYEN NGHIEM DUY
1 (1)
Forex Indicator Arrows is an arrow Indicator used as an assistant tool for your trading strategy. The indicator analyzes the standard deviation of bar close for a given period and generates a buy or sell signals if the deviation increases. It good to combo with Martingale EA to follow Trend and Sellect Buy Only/Sell Only for EA work Semi-Automatic. You can use this  Indicator with any EAs in my Products.
FREE
Tabajara V5
Flavio Javier Jarabeck
4.84 (32)
Metatrader 5 version of the famous Andre Machado's Tabajara indicator. If you don't know Andre Machado's Technical Analysis work you don't need this indicator... For those who need it and for those several friend traders who asked this porting from other platforms, here it is... FEATURES 8-period Moving Average 20-period Moving Average 50-period Moving Average 200-period Moving Average Colored candles according to the inflexion of the 20-period MA SETTINGS You can change the Period of all M
FREE
Moving Averages OnOff MT5
Fabrizio Malavasi
5 (3)
The Moving Averages On-Off  let you  control the indicator  using  the keyboard  or a  button . You can choose if you want the indicator always shown or always hided while switching among different time frames or financial instruments .    --->  This indicator is part of Combo Indicator OnOff It's possible to  setup three Moving Averages : Short ,  Medium ,  Long   Input You can customize the price type used for calculation : close, open, high, low, median price, typical price, weighted It
FREE
This is addition of  Effective SV squeeze momentum  that add bolliger band and Keltner channel to chart window.  Squeeze momentum introduced by “John Carter”, the squeeze indicator for MT5 represents a volatility-based tool. Regardless, we can also consider the squeeze indicator as a momentum indicator, as many traders use it to identify the direction and strength of price moves. In fact, the Tradingview  squeeze indicator shows when a financial instrument is willing to change from a trending ma
FREE
Buyers of this product also purchase
TPSpro RFI Levels MT5
Roman Podpora
4.7 (10)
Reversal First Impulse levels (RFI)      INSTRUCTIONS        RUS       -       ENG              R ecommended to use with an indicator   -   TPSpro  TREND PRO -  Version MT4                 A key element in trading is zones or levels from which decisions to buy or sell a trading instrument are made. Despite attempts by major players to conceal their presence in the market, they inevitably leave traces. Our task was to learn how to identify these traces and interpret them correctly. Main functi
TPSproTREND PrO MT5
Roman Podpora
4.89 (9)
TPSpro TREND PRO  - is a trend indicator that automatically analyzes the market and provides information about the trend and each of its changes, as well as giving signals for entering trades without redrawing! The indicator uses each candle, analyzing them separately. referring to different impulses - up or down impulse. Exact entry points into transactions for currencies, crypto, metals, stocks, indices!  Version MT4               DETAILED DESCRIPTION               R ecommended to use with an
Atomic Analyst MT5
Issam Kassas
4.56 (18)
First of all Its worth emphasizing here that this Trading Indicator is   Non-Repainting   , Non Redrawing and Non Lagging Indicator   Indicator, Which makes it ideal from both manual and robot trading.  User manual: settings, inputs and strategy . The Atomic Analyst  is a PA Price Action Indicator that uses Strength and Momentum of the price to find a better edge in the market. Equipped with Advanced filters which help remove noises and false signals, and Increase Trading Potential. Using Mult
Atbot
Zaha Feiz
4.97 (31)
ATbot : How It Works and How to Use It How It Works The "AtBot" indicator for the MT5 platform generates buy and sell signals using a combination of technical analysis tools. It integrates Simple Moving Average (SMA), Exponential Moving Average (EMA), and the Average True Range (ATR) index to identify trading opportunities. Additionally, it can utilize Heikin Ashi candles to enhance signal accuracy. MQL Channel    Leave a massage after purchase and receive a special bonus gift. 9 copies left for
First of all Its worth emphasizing here that this Trading System is Non-Repainting   , Non Redrawing and Non Lagging Indicator Which makes it ideal from both manual and robot trading .  Online course, manual and download presets. The Smart Trend Trading System MT5 is a comprehensive trading solution tailored for new and experienced traders . It combines over 10 premium indicators and features more than 7 robust trading strategies , making it a versatile choice for diverse market conditions . Tre
Gold Stuff mt5
Vasiliy Strukov
4.92 (161)
Gold Stuff mt5 is a trend indicator designed specifically for gold and can also be used on any financial instrument. The indicator does not redraw and does not lag. Recommended time frame H1. Contact me immediately after the purchase to get   personal bonus!  You can get a free copy of our Strong Support and Trend Scanner indicator, please pm. me! Settings  and manual   here   SETTINGS Draw Arrow - on off. drawing arrows on the chart. Alerts -   on off audible alerts. E-mail notification - on of
Top indicator for MT5   providing accurate signals to enter a trade without repainting! It can be applied to any financial assets:   forex, cryptocurrencies, metals, stocks, indices .  Watch  the video  (6:22) with an example of processing only one signal that paid off the indicator! MT4 version is here It will provide pretty accurate trading signals and tell you when it's best to open a trade and close it. Most traders improve their trading results during the first trading week with the help of
Trend Screener Pro MT5
STE S.S.COMPANY
4.87 (61)
Unlock the Power of Trends Trading with the Trend Screener Indicator: Your Ultimate Trend Trading Solution powered by Fuzzy Logic and Multi-Currencies System! Elevate your trading game with the Trend Screener, the revolutionary trend indicator designed to transform your Metatrader into a powerful Trend Analyzer. This comprehensive tool leverages fuzzy logic and integrates over 13 premium features and three trading strategies, offering unmatched precision and versatility. LIMITED TIME OFFER : Tre
FX Power MT5 NG
Daniel Stein
5 (5)
Trading GOLD, and currencies, with the dog walk strategy  - super smart Trading GOLD, and currencies, with the breakout strategy  - super easy Visit our all-new   Stein Investments Welcome Page   to get the latest information, updates and trading strategies. FX Power MT5 NG  is the next generation of our long-time very popular currency strength meter, FX Power.  And what does this next-generation strength meter offer? Everything you have loved about the original FX Power  PLUS GOLD/XAU st
IX Power MT5
Daniel Stein
4.17 (6)
IX Power   finally brings the unbeatable precision of FX Power to all your trading symbols. It accurately determines the intensity of short, medium and long-term trends in your favourite indices, stocks, commodities, ETFs, and even cryptocurrencies. You can   analyse everything   your terminal has to offer. Try it out and experience how   your timing improves significantly   when trading. Read about our latest strategic development -  Easy scalping with IX Power Visit our all-new   Stein Inve
Advanced Supply Demand MT5
Bernhard Schweigert
4.5 (14)
Best Solution for any Newbie or Expert Trader! This indicator is a unique, high quality and affordable trading tool because we have incorporated a number of proprietary features and a new formula. With this update, you will be able to show double timeframe zones. You will not only be able to show a higher TF but to show both, the chart TF, PLUS the higher TF: SHOWING NESTED ZONES. All Supply Demand traders will love it. :) Important Information Revealed Maximize the potential of Advanced Suppl
MetaForecast M5
Vahidreza Heidar Gholami
5 (2)
MetaForecast predicts and visualizes the future of any market using different powerful methods. While financial markets are not always predictable, if there are patterns in the past data, MetaForecast can learn and predict the future as accurately as possible. It features a complete implementation of neural networks embedded directly into the indicator, enabling traders to create and train AI models using data from multiple symbols to learn complex patterns. MetaForecast leverages your computer'
FX Volume MT5
Daniel Stein
4.93 (14)
Visit our all-new   Stein Investments Welcome Page   to get the latest information, updates and trading strategies. FX Volume is the FIRST and ONLY volume indicator that provides a REAL insight into the market sentiment from a broker's point of view. It provides awesome insights into how institutional market participants, like brokers, are positioned in the Forex market, much faster than COT reports. Seeing this information directly on your chart is the real game-changer and breakthrough solut
First of all Its worth emphasizing here that this Trading Tool is Non Repainting , Non Redrawing and Non Lagging Indicator , Which makes it ideal for professional trading . Online course, user manual and demo. The Smart Price Action Concepts Indicator is a very powerful tool for both new and experienced traders . It packs more than 20 useful indicators into one , combining advanced trading ideas like Inner Circle Trader Analysis and Smart Money Concepts Trading Strategies . This indicator focus
Quantum Trend Sniper
Bogdan Ion Puscasu
4.79 (48)
Introducing   Quantum Trend Sniper Indicator , the groundbreaking MQL5 Indicator that's transforming the way you identify and trade trend reversals! Developed by a team of experienced traders with trading experience of over 13 years,   Quantum Trend Sniper Indicator   is designed to propel your trading journey to new heights with its innovative way of identifying trend reversals with extremely high accuracy. ***Buy Quantum Trend Sniper Indicator and you could get Quantum Breakout Indicator fo
Unlock hidden profits: accurate divergence trading for all markets Special Offer: Purchase now to receive free bonuses worth $90! (Read more for details) Tricky to find and scarce in frequency, divergences are one of the most reliable trading scenarios. This indicator finds and scans for regular and hidden divergences automatically using your favourite oscillator. [ Installation Guide | Update Guide | Troubleshooting | FAQ | All Products ] Easy to trade Finds regular and hidden divergences S
Auto Order Block with break of structure based on ICT and Smart Money Concepts (SMC) Futures Break of Structure ( BoS )             Order block ( OB )            Higher time frame Order block / Point of Interest ( POI )    shown on current chart           Fair value Gap ( FVG ) / Imbalance   -  MTF      ( Multi Time Frame )    HH/LL/HL/LH  -  MTF      ( Multi Time Frame )  Choch  MTF      ( Multi Time Frame )  Volume Imbalance     ,  MTF          vIMB Gap’s Power of 3 Equal High
** All Symbols x All Timeframes scan just by pressing scanner button ** *** Contact me  to send you instruction and add you in "123 scanner group" for sharing or seeing experiences with other users. After 17 years of experience in the markets and programming, Winner indicator is ready. I would like to share with you! Introduction The 123 Pattern Scanner indicator with a special enhanced algorithm is a very repetitive common pattern finder with a high success rate . Interestingly, this Winner in
Black Dragon indicator mt5
Ramil Minniakhmetov
4.81 (53)
The trend detection indicator will compliment any strategy and can also be used as an independent tool. IMPORTANT! Contact me immediately after the purchase to get instructions and a bonus!  Benefits  Easy to use; does not overload the graphic wih unnecessary information. The ability to use as filter for any strategy. Contains bult -in dynamic levels of cupport and resistange,  which can be used both, for profit taking, and for settings up stop-losses. The indicator does not change color after t
How many times have you bought a trading indicator with great back-tests, live account performance proof with fantastic numbers and stats all over the place but after using it, you end up blowing your account? You shouldn't trust a signal by itself, you need to know why it appeared in the first place, and that's what RelicusRoad Pro does best! 10 PCs License - UNLIMITED ACCOUNTS (PCs or MACs) **  User Manual + Strategies + Training Videos + Private Group with VIP Access + Mobile Version Availa
AW Trend Predictor MT5
AW Trading Software Limited
4.75 (51)
The combination of trend and breakdown levels in one system. An advanced indicator algorithm filters market noise, determines the trend, entry points, as well as possible exit levels. Indicator signals are recorded in a statistical module, which allows you to select the most suitable tools, showing the effectiveness of the signal history. The indicator calculates Take Profit and Stop Loss marks. Manual and instruction ->  HERE  / MT4 version ->  HERE How to trade with the indicator:  Trading wit
ATrend
Zaha Feiz
4.67 (3)
ATREND: How It Works and How to Use It How It Works The " ATREND " indicator for the MT5 platform is designed to provide traders with robust buy and sell signals by utilizing a combination of technical analysis methodologies. This indicator primarily leverages the Average True Range (ATR) for volatility measurement, alongside trend detection algorithms to identify potential market movements. Leave a massage after purchase and receive a special bonus gift. 8 copies left for 30$ price  Key Fe
Easy By Sell is a market indicator for opening and closing positions. It becomes easy to track market entries with alerts. It indicates trend reversal points when a price reaches extreme values ​​and the most favorable time to enter the market. it is as effective as a Fibonacci to find a level but it uses different tools such as an algorithm based on ATR indicators and Stochastic Oscillator. You can modify these two parameters as you wish to adapt the settings to the desired period. My othe
This dashboard shows the latest available   harmonic patterns   for the selected symbols, so you will save time and be more efficient /   MT4 version . Free Indicator:   Basic Harmonic Pattern Comparison of "Basic Harmonic Pattern" vs. "Basic Harmonic Patterns Dashboard" Indicators Feature Basic Harmonic Pattern Basic Harmonic Patterns Dashboard Functionality Detects and displays harmonic patterns on a single chart Searches multiple symbols and timeframes for harmonic patterns, displays
TPA True Price Action indicator reveals the true price action of the market makers through 100% non-repainting signals strictly at the close of a candle! TPA shows entries and re-entries, every time the bulls are definitely stronger than the bears and vice versa. Not to confuse with red/green candles. The shift of power gets confirmed at the earliest stage and is ONE exit strategy of several. There are available now two free parts of the TPA User Guide for our customers. The first "The Basics"
Was: $249  Now: $99   Market Profile defines a number of day types that can help the trader to determine market behaviour. A key feature is the Value Area, representing the range of price action where 70% of trading took place. Understanding the Value Area can give traders valuable insight into market direction and establish the higher odds trade. It is an excellent addition to any system you may be using. Inspired by Jim Dalton’s book “Mind Over Markets”, this indicator is designed to suit the
ICT, SMC, SMART MONEY CONCEPTS, SMART MONEY, Smart Money Concept, Support and Resistance, Trend Analysis, Price Action, Market Structure, Order Blocks, BOS/CHoCH,   Breaker Blocks ,  Momentum Shift,   Supply&Demand Zone/Order Blocks , Strong Imbalance, HH/LL/HL/LH,    Fair Value Gap, FVG, Invert FVG, IFVG,  Premium  &   Discount   Zones, Fibonacci Retracement, OTE, Buy Side Liquidity, Sell Side Liquidity, BSL/SSL Taken, Equal Highs & Lows, MTF Dashboard, Multiple Time Frame, BigBar, HTF OB, HTF
Matrix Arrow Indicator MT5
Juvenille Emperor Limited
5 (12)
Matrix Arrow Indicator MT5  is a unique 10 in 1 trend following   100% non-repainting  multi-timeframe indicator that can be used on all symbols/instruments:   forex,   commodities,   cryptocurrencies,   indices,   stocks .  Matrix Arrow Indicator MT5  will determine the current trend at its early stages, gathering information and data from up to 10 standard indicators, which are: Average Directional Movement Index (ADX) Commodity Channel Index (CCI) Classic Heiken Ashi candles Moving Aver
Gold TMAF MTF  - this is a best stock technical indicator. The indicator algorithm analyzes the price movement of an asset and reflects volatility and potential entry zones. The best indicator signals: For SELL = red upper boundary of TMA2 above the red upper boundary of TMA1 + red fractal indicator above + yellow SR signal arrow in the same direction. For BUY = blue lower boundary of TMA2 below the blue lower boundary of TMA1 + blue fractal indicator from below + aqua SR signal arrow in the s
Golden Spikes Premium
Kwaku Bondzie Ghartey
Golden Spikes Detector Acknowledgement and Dedications:  The name of this indicator was Inspired by an Original; Mr Grant Koopman; a Knowledgeable and experienced Synthetics trader. I dedicate this indicator to Mr Grant.  Overview: The Golden Spikes Premium is a groundbreaking trading indicator meticulously crafted for the Boom and Crash indices on the Deriv market. Tailored to meet the needs of discerning traders, this powerful tool operates exclusively on the one-minute timeframe, providin
More from author
Description The CustomRSI50 Alert and Mail at Cross is an advanced technical indicator based on the popular Relative Strength Index (RSI), designed to simplify automated trading with immediate notifications via alerts and emails when the RSI level crosses the 50 threshold. The indicator provides a clear and customizable visualization of the RSI, with a particular emphasis on the critical 50 level for many traders in momentum analysis. Main Features Sending alerts and email notifications at the 5
Filter:
No reviews
Reply to review
Version 1.4 2024.09.06
Fixed drawing issue with CustomRSI50 indicator. Improved buffer initialization and data handling to ensure correct display of RSI values throughout the chart. Added debug output for easier troubleshooting.