VR Ticks
- Indicators
- Vladimir Pastushak
- Version: 24.31
- Updated: 1 March 2024
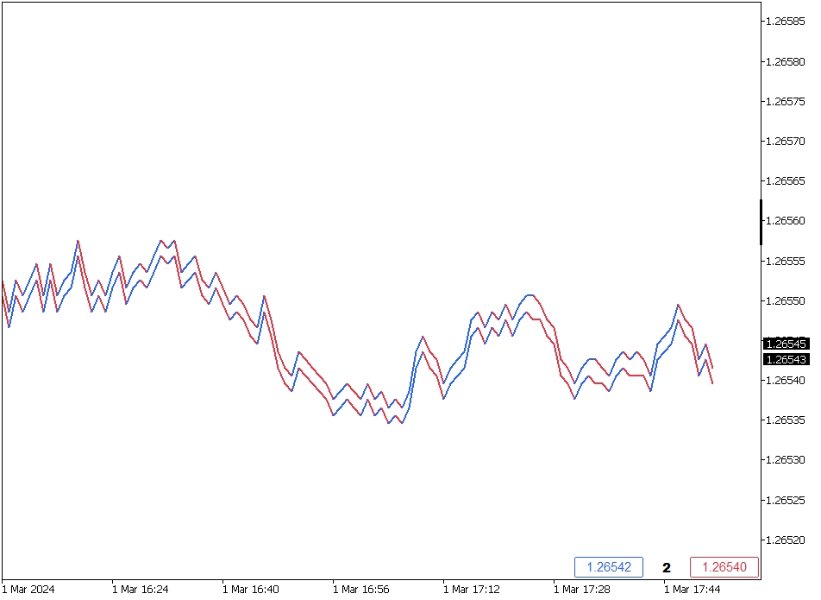
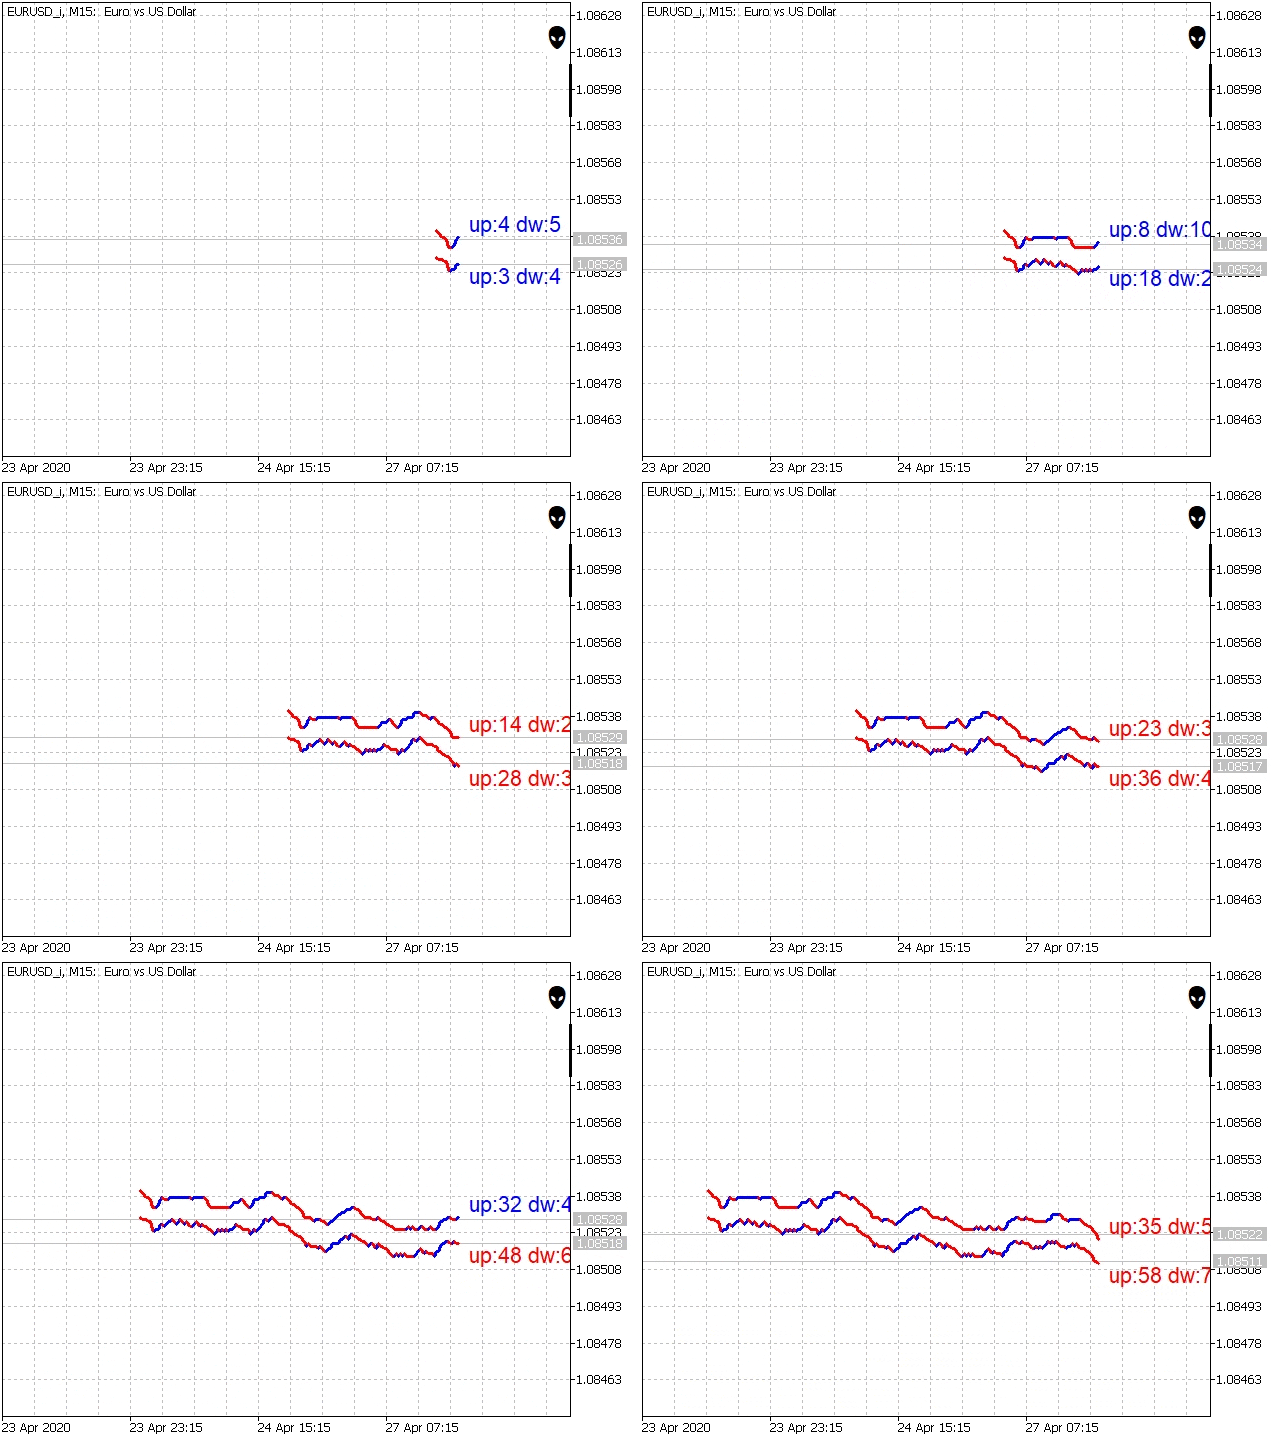
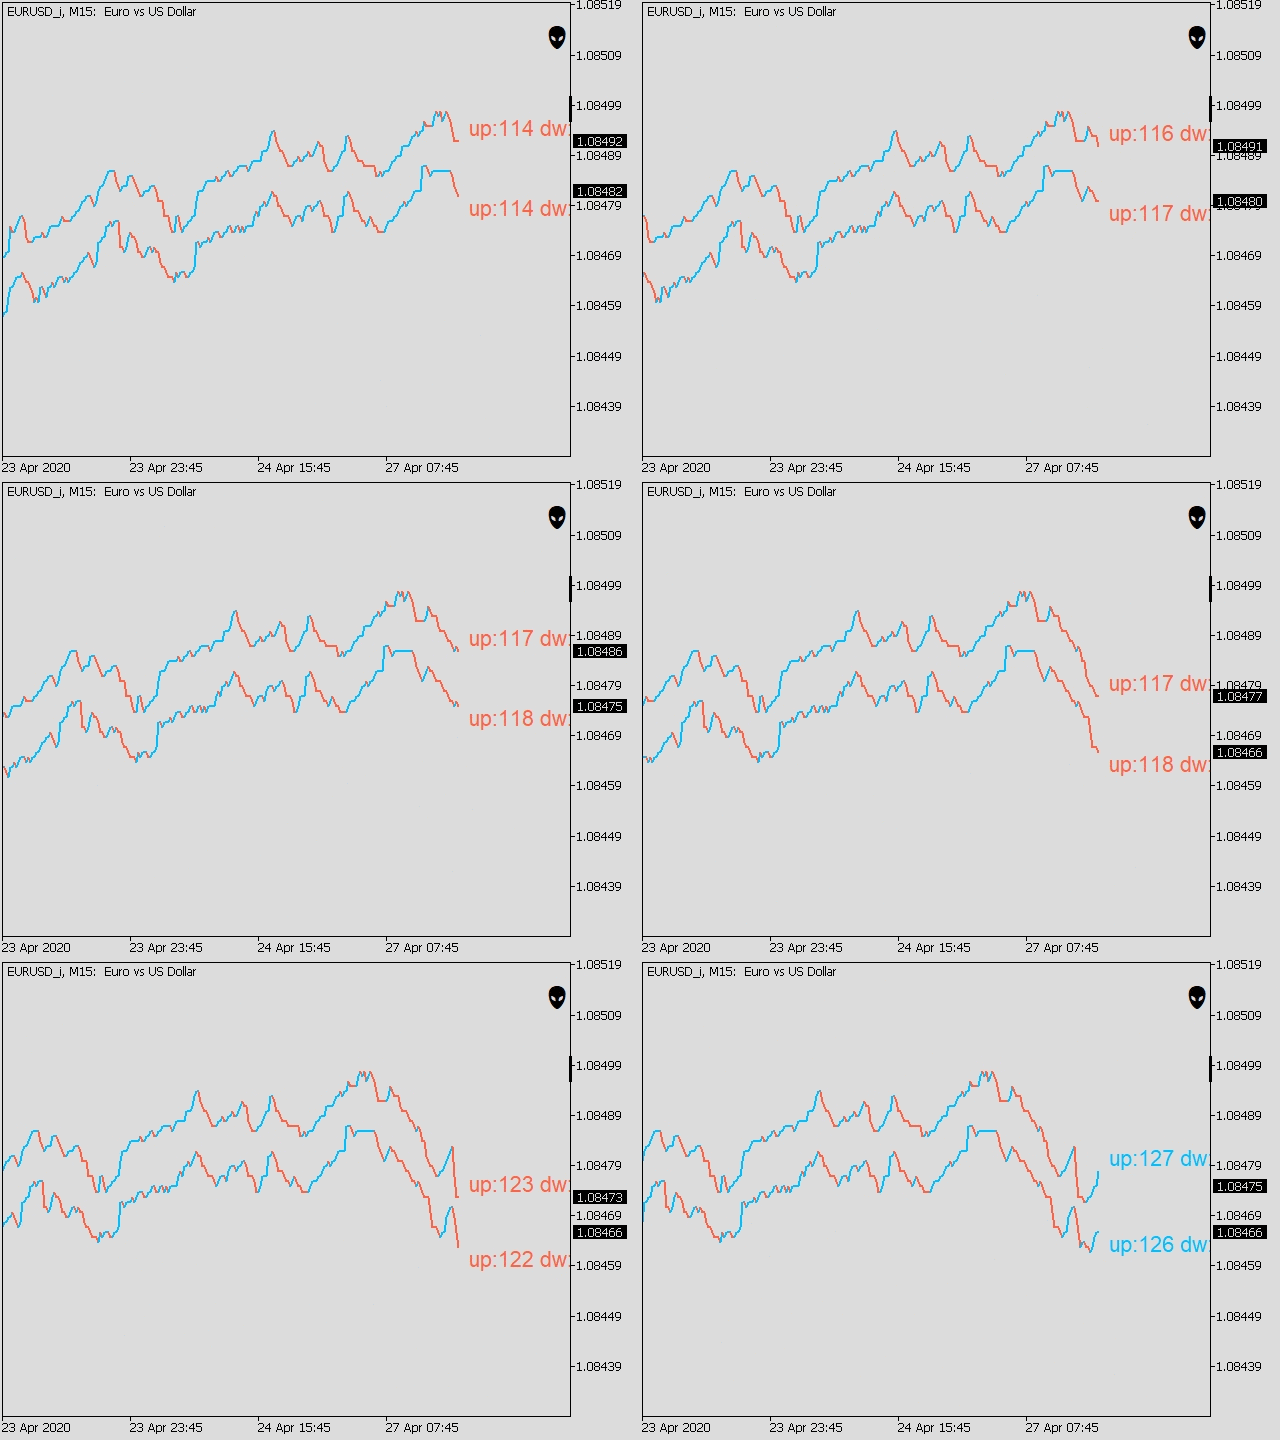
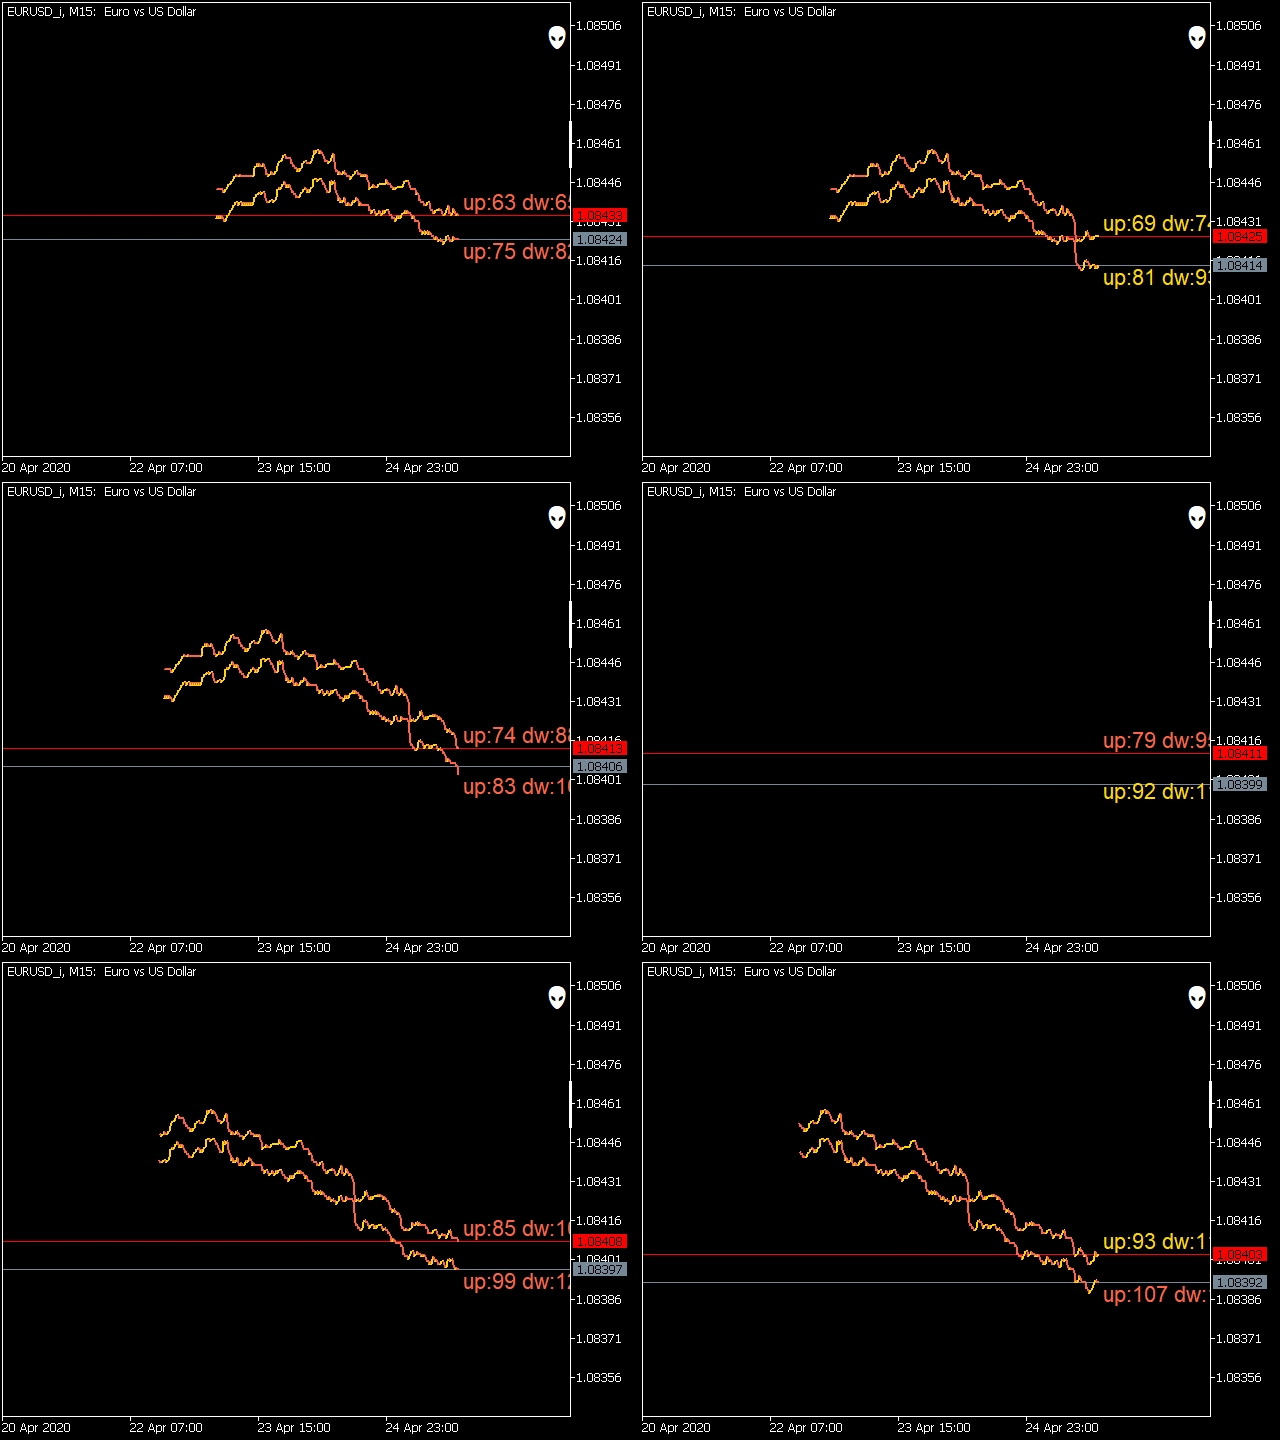
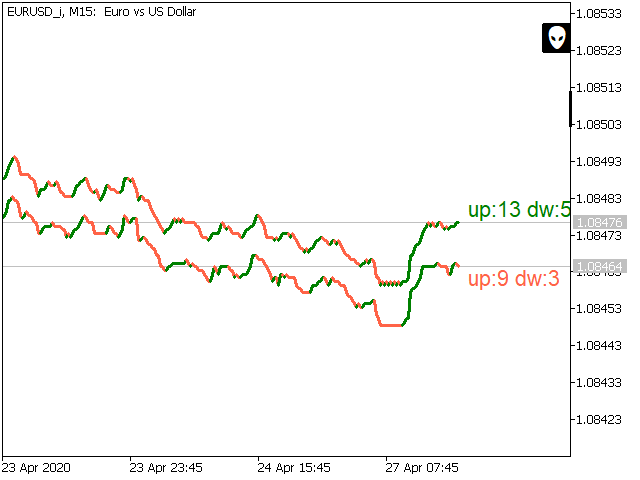
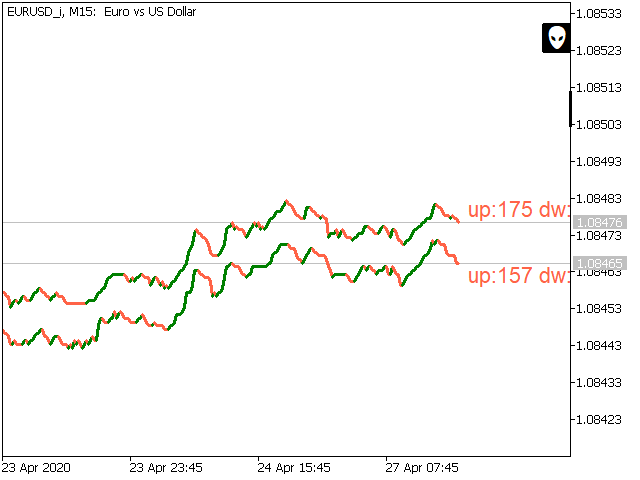
VR Ticks is a special indicator for scalping-based strategies. Thanks to this indicator, the trader can see the tick chart directly on the main chart of the financial instrument. A tick chart allows you to enter a position into the market or close a position in the market as accurately as possible. VR Ticks plots tick data in the form of lines that change color depending on the direction - this allows you to visually understand and assess the situation on ticks. The advantage of tick charts is that they do not take into account time frames and are built based on price changes. VR Ticks builds the most minimal chart possible.
Settings, set files, demo versions, instructions, problem solving, can be found in [blog]
You can read or write reviews at [link]
Version for [MetaTrader 5]
A tick is one price movement. For one price movement, the price can change by one or several points. It is important to understand that a tick is a movement .
The indicator displays the Ask and Bid prices at the bottom right, as well as the current spread value. The program code of the indicator, tick by tick, builds a chart in the MetaTrader window. Depending on the indicator settings, moments of growth in the chart can be painted in one color, and moments of falling prices in another. This approach helps the trader to clearly see a change in the current trend. The indicator monitors every price movement and displays all, absolutely all price movements on the chart. If there are no changes in the Ask or Bid price, the indicator builds a horizontal chart.
Advantages
- Greater efficiency when trading using scalper strategies.
- Stable and optimized indicator code, does not consume a lot of computer resources.
- The tick chart can be displayed in the window with the main chart.
- It is possible to configure the chart window to only monitor the tick chart.
- The indicator is designed and identical for MetaTrader 4 and MetaTrader 5.
- Suitable for trading by beginners and experienced traders.
- Can show data for any financial instruments (Forex, Metalls, CFD, Futures, Crypto).
VR Ticks indicator settings
Indicator settings
- Count periods - Number of periods to draw
- Delta Ask - Bid - Delta for spreading the Ask and Bid lines
Ask line settings
- Show Ask tick - show the Ask line
- Color Ask tick Up - color of the Ask line when growing
- Color Ask tick Down - color of the Ask line when falling
- Width Ask tick - thickness of the Ask line
- Style Ask tick - Ask line style
Bid line settings
- Show Bid tick - show the Bid line
- Color Bid tick Up - color of the Bid line when growing
- Color Bid tick Down - color of the Bid line when falling
- Width Bid tick - thickness of the Bid line
- Style Bid tick - Bid line style
Last line settings
- Show Last tick - show the Last line
- Color Last tick Up - color of the Last line when growing
- Color Last tick Down - color of the Last line when falling
- Width Last tick - Last line width
- Style Last tick - Last line style
Other Settings
- Shift indicator bar - shift the indicator forward/backward by the specified number of bars
- Shift indicator price - shift the indicator up/down by the specified number of points
- Text Size - text size

