SpreadTracer and TimeLeft
- Indicators
- Piergiorgio Panzironi
- Version: 1.1
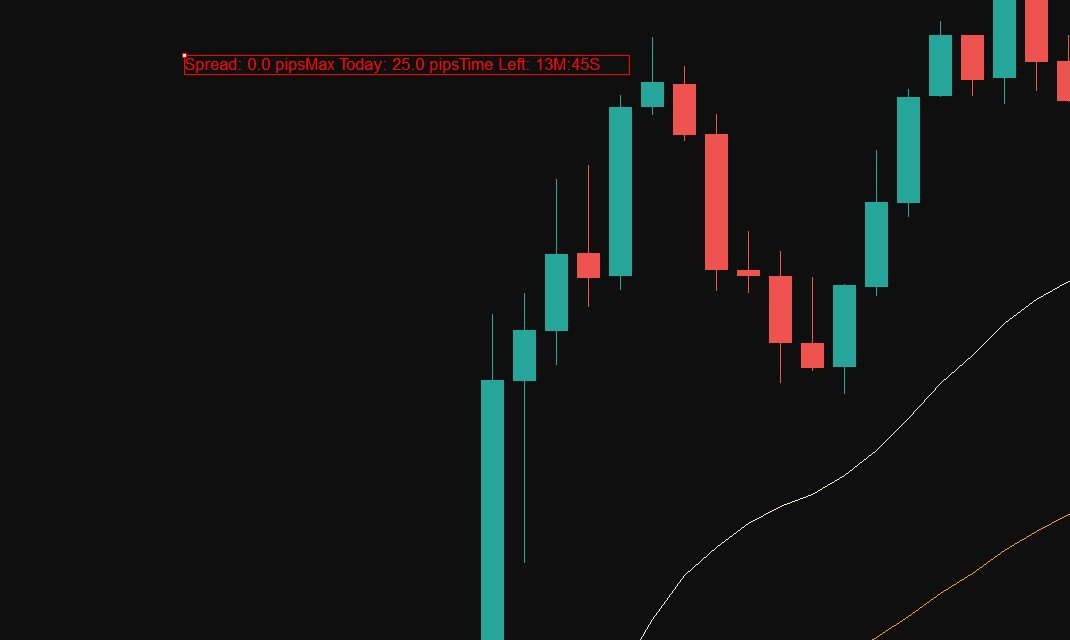
The SpreadTracer and TimeLeft indicator is a powerful yet straightforward tool designed for traders who want to keep a close eye on market conditions directly on their chart. This custom indicator provides essential real-time information about the spread and candle time, making it easier to make informed trading decisions.
Key Features:
-
Current Spread Monitoring: The indicator constantly displays the current spread of the trading pair, helping you assess the cost of entering or exiting a position. This feature is particularly useful during volatile market conditions when spreads can widen significantly.
-
Maximum Daily Spread: In addition to showing the current spread, the indicator tracks and displays the maximum spread observed throughout the trading day. This feature allows you to see how volatile the market has been, giving you an idea of the worst-case cost scenario during the day.
-
Time Left in the Current Candle: The indicator also shows the remaining time until the current candle closes. This information is crucial for traders who use candlestick patterns or time-sensitive strategies, allowing you to anticipate potential market moves as the candle approaches closure.
-
Movable Display: Flexibility is key in trading, and this indicator is designed with that in mind. The text display is movable, allowing you to position it anywhere on your chart that best suits your trading setup. This ensures that you can keep your workspace organized and focused on the aspects of the chart that matter most to you.
-
Clean and Customizable Display: The information is presented in a clean, easy-to-read format, centered on the chart by default to avoid cluttering your workspace. You can easily customize the text color and font size to match your preferences and trading setup.
Why Use This Indicator?
This indicator is ideal for traders who require precise, real-time information on spreads and candle timing without overwhelming their charts with unnecessary details. Whether you’re a scalper monitoring spreads closely or a swing trader who needs to know how much time is left in a candle, this indicator provides the essential data you need at a glance.
How to Use:
- Install the Indicator: Simply download the indicator file and add it to your MetaTrader 5 platform.
- Apply to Chart: Attach the indicator to any chart you wish to monitor. The information will appear centered and slightly lower on the chart by default, but you can easily move it to your preferred position.
- Customize and Move: Adjust the text color and font size as needed, and drag the text display to the desired position on your chart.