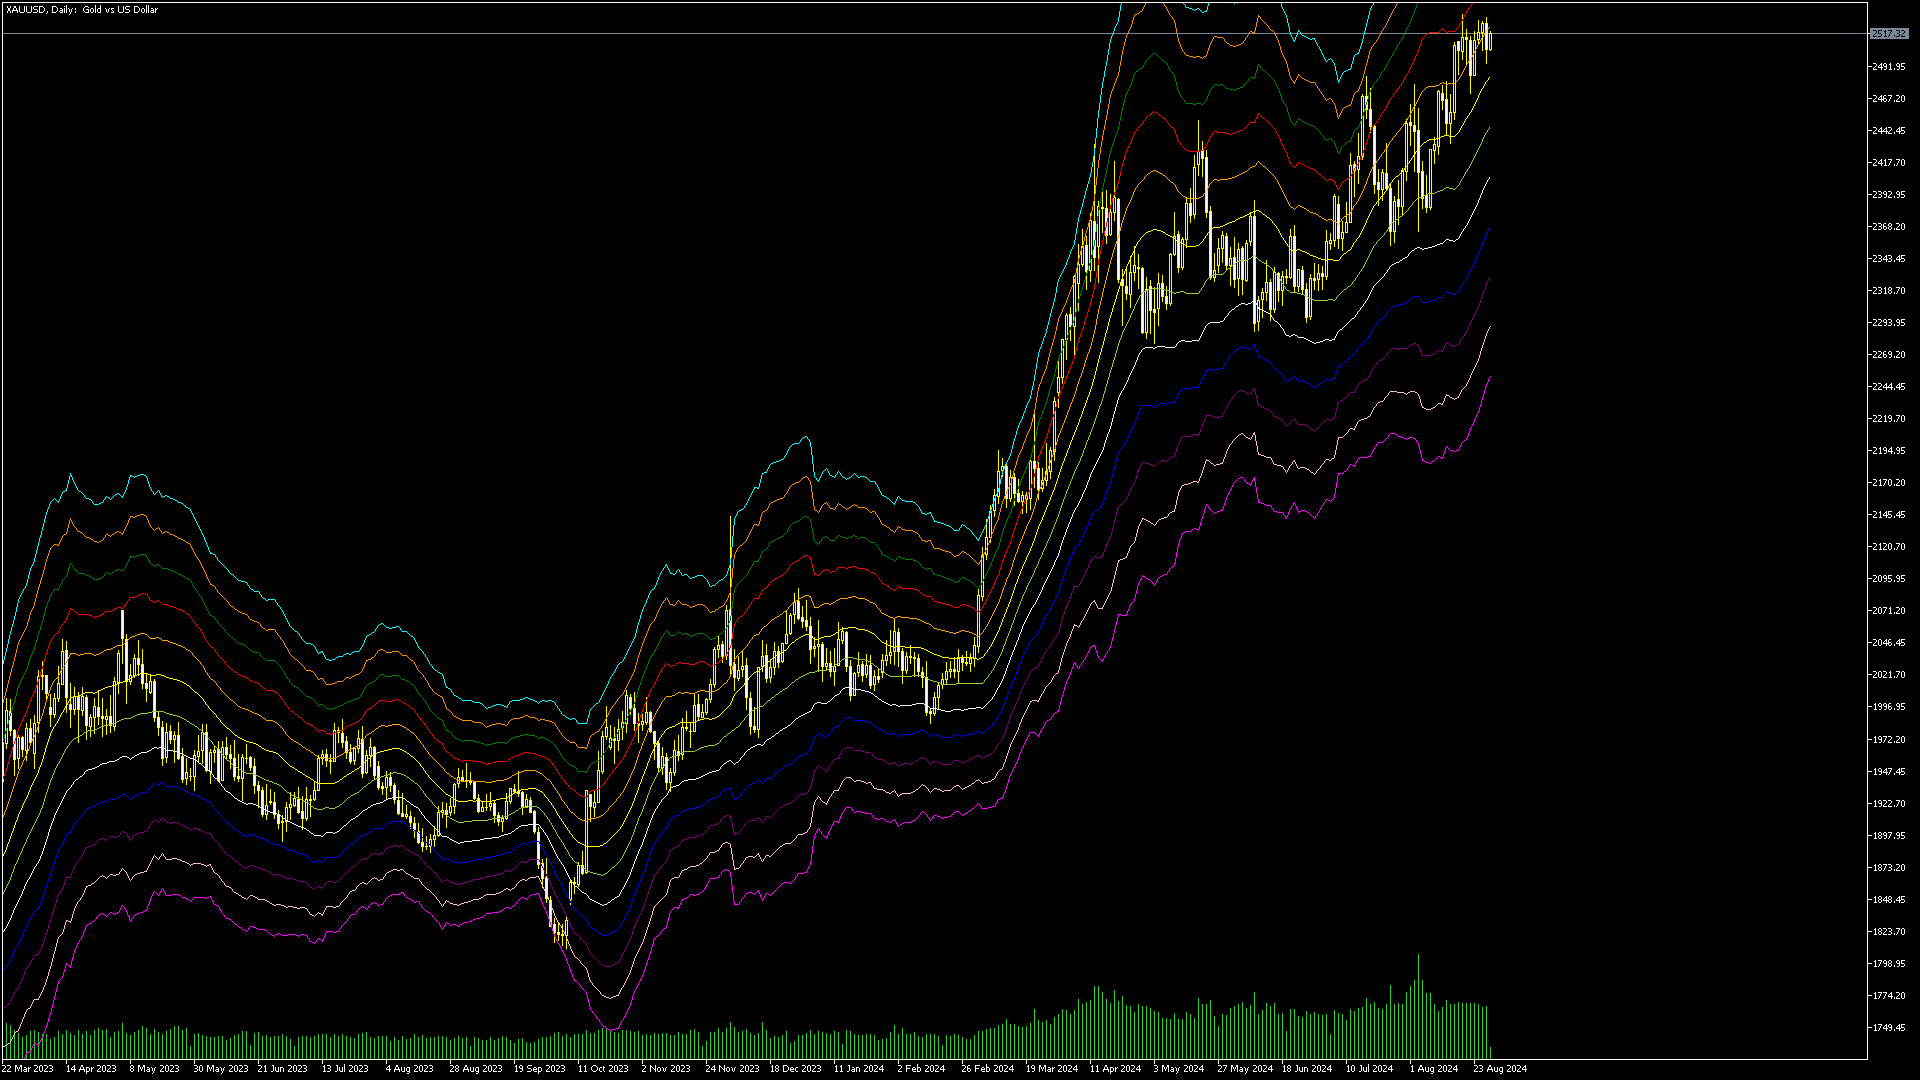
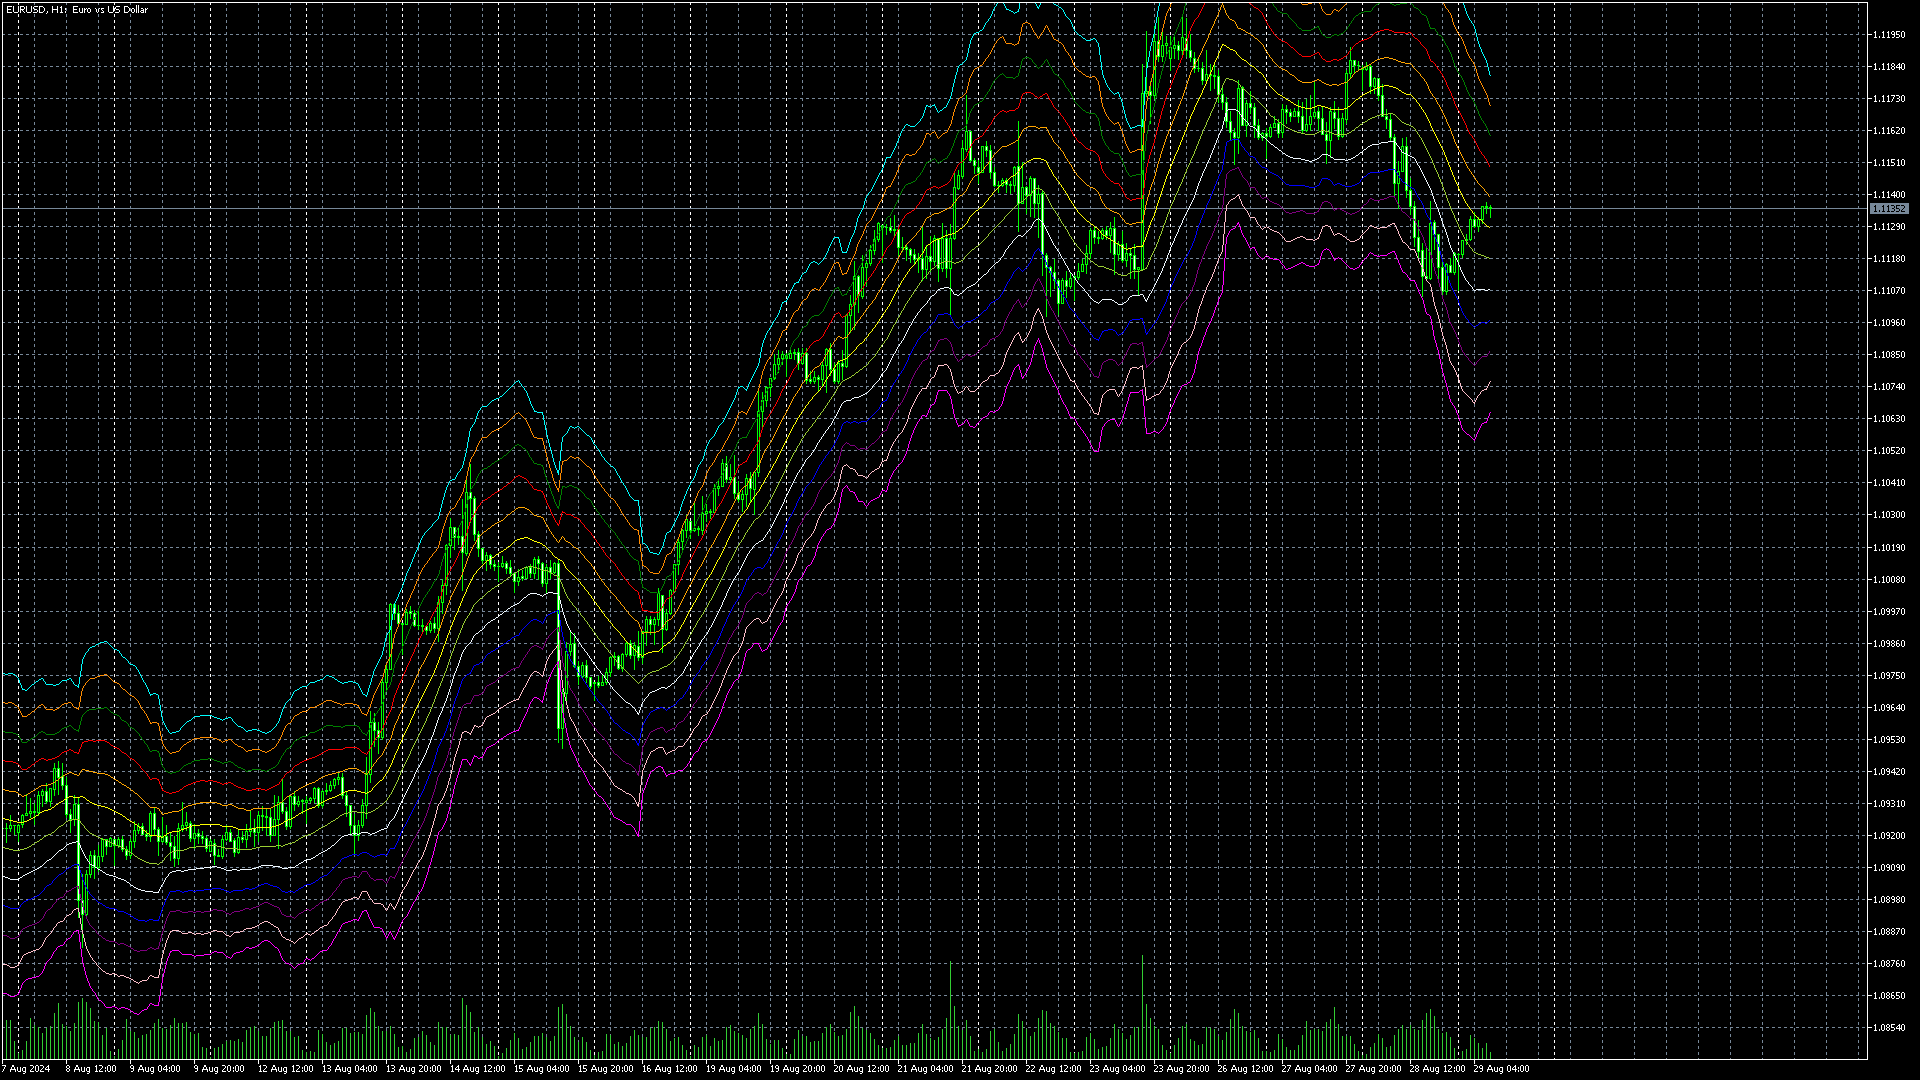
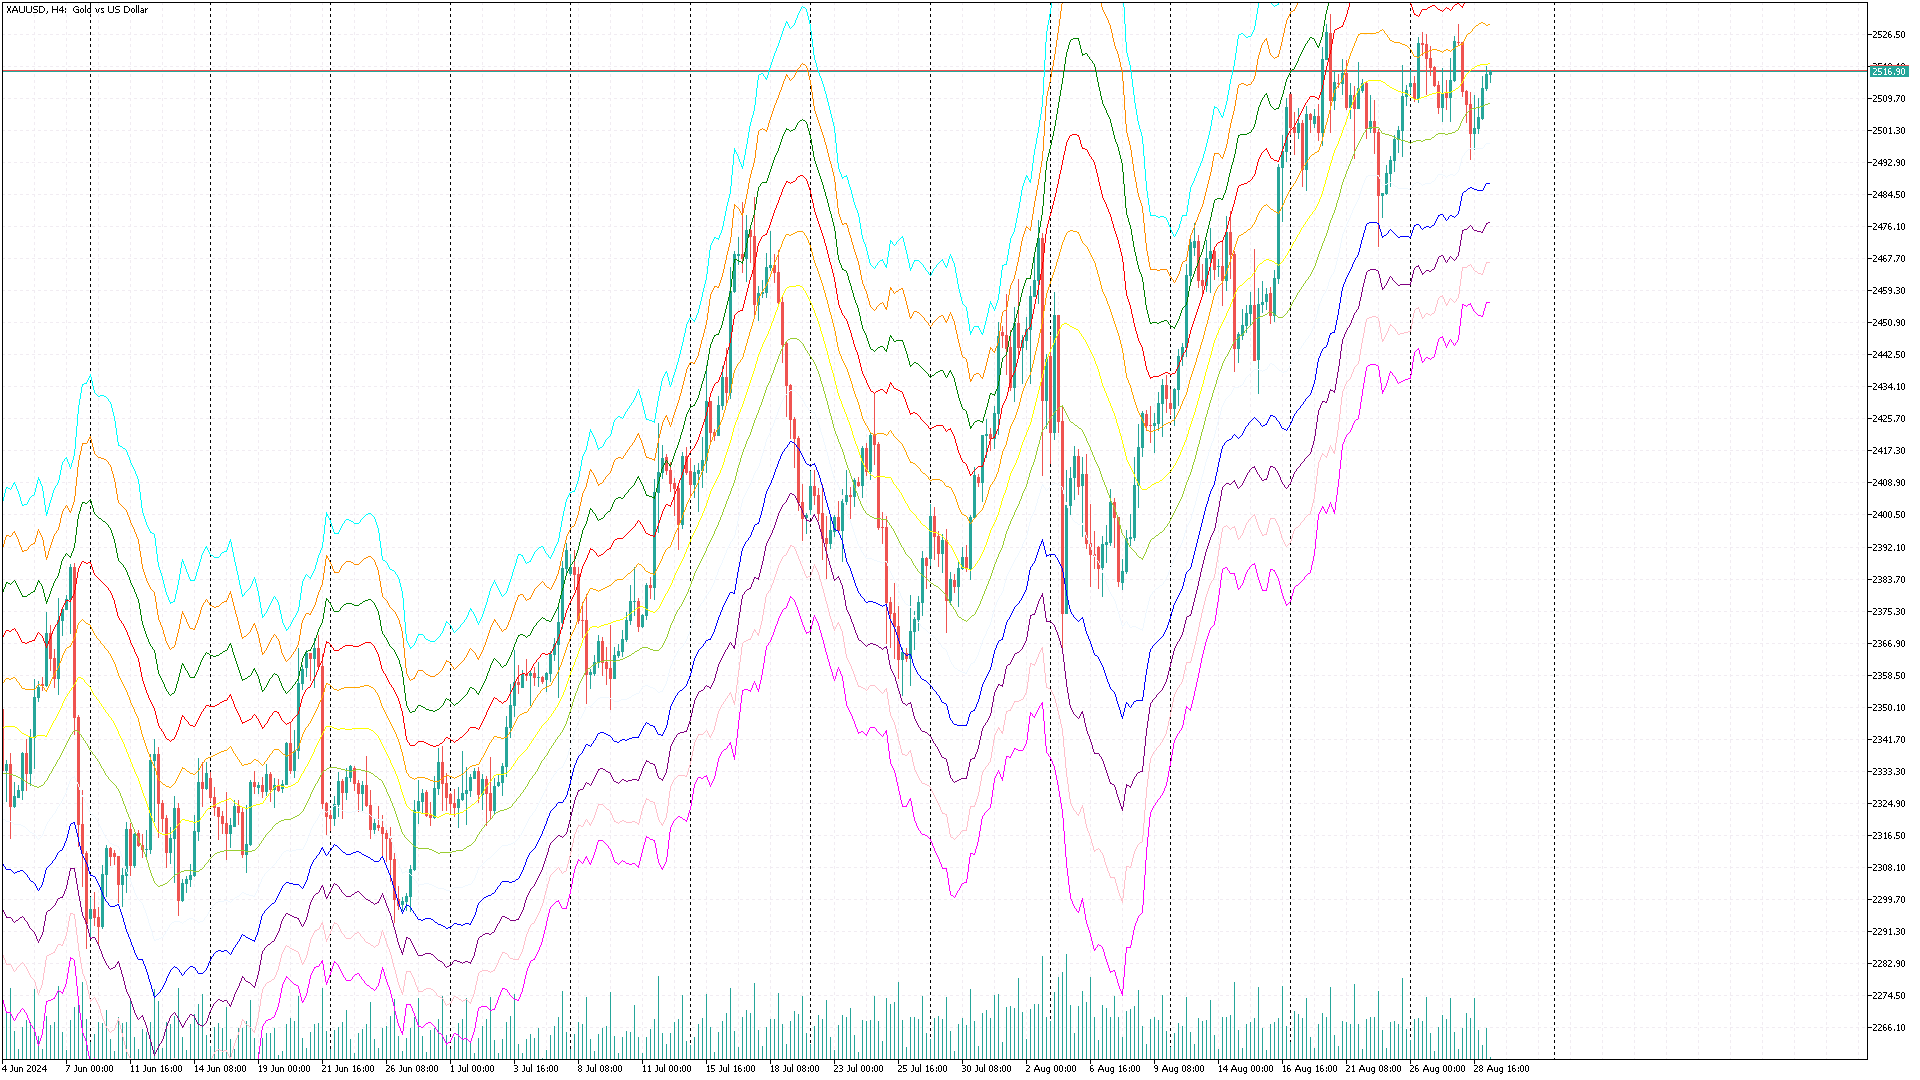
Multi Level ATR and Moving Average Band Indicator
- Indicators
- Nguyen Trung Khiem
- Version: 1.3
- Activations: 10
Overview
The Multi Level ATR and Moving Average Band Indicator is a powerful tool for traders seeking to identify market trends, support, resistance levels, and volatility with clarity. This indicator combines multiple moving averages with ATR (Average True Range) multipliers to generate visually distinct bands around price movements. It helps traders spot potential reversal zones, trending conditions, and market consolidation areas.
Features
- Multi-Band Display: Shows six dynamic bands derived from moving averages and ATR calculations, color-coded for straightforward trend detection (red, orange, yellow, green, blue, and violet).
- ATR Volatility Bands: Adjusts bands according to market volatility using ATR multipliers, providing clear visual cues for potential price reversals or continuations.
- Customizable Parameters: Full customization of ATR multipliers and moving average periods to adapt to various market conditions and trading strategies.
- Clear Trend Identification: Bands expand and contract based on volatility, allowing traders to see trends, consolidation periods, and potential price breakout points with ease.
- Multiple Timeframe Compatibility: Suitable for any trading timeframe, from scalping on lower timeframes to swing trading or longer-term investing on higher timeframes.
How to Use
- Trend Identification: Use the indicator to distinguish between trending and ranging markets. Expanding bands suggest increased volatility and potential breakouts, while contracting bands suggest low volatility and consolidation.
- Reversal Signals: When the price touches the outermost bands, it often signals potential reversal points. This allows traders to position stop-losses, set take-profit targets, or plan entry points.
- Risk Management: The indicator's volatility bands, derived from the ATR, provide guidance on setting appropriate stop-loss distances and position sizing.
Customization Options
- ATR Multiplier: Adjust the multiplier to fine-tune the sensitivity of the bands to market volatility.
- Moving Average Period: Choose the period for the moving averages to match your preferred trading style and instrument.
Ideal For
- Trend Traders: Helps confirm and identify the strength and direction of trends.
- Reversal Traders: Provides potential reversal points by analyzing price interaction with outer bands.
- Volatility-Based Strategies: Offers visual insight into periods of high and low volatility, allowing traders to adapt their strategies accordingly.
Understanding the Lines
The indicator calculates 12 lines from moving averages and ATR multipliers:
- Upper Lines: Lines above the price, based on the high moving average (MA) plus multiples of ATR.
- Lower Lines: Lines below the price, based on the low moving average (MA) minus multiples of ATR.
Strategies for Trading
Buffers and Their Corresponding Colors
FirstBuffer (Color: Red)
- Purpose: Represents the upper boundary of the highest ATR band.
- Calculation: FirstBuffer[i] = HighMa[0] + 2 * AtrMultiplier * currAtr[0]
- Explanation: Displays the highest band, which is the moving average of the high price plus twice the ATR multiplied by the ATR multiplier. It marks a higher level of resistance.
SecondBuffer (Color: Orange)
- Purpose: Represents the upper boundary of the middle ATR band.
- Calculation: SecondBuffer[i] = HighMa[0] + AtrMultiplier * currAtr[0]
- Explanation: Displays a band that is the moving average of the high price plus the ATR multiplied by the ATR multiplier. Indicates mid-level resistance.
ThirdBuffer (Color: Yellow)
- Purpose: Represents the moving average of the high prices.
- Calculation: ThirdBuffer[i] = HighMa[0]
- Explanation: Displays the moving average of the high prices, serving as a baseline or central line for the bands.
FourthBuffer (Color: YellowGreen)
- Purpose: Represents the moving average of the low prices.
- Calculation: FourthBuffer[i] = LowMa[0]
- Explanation: Holds the moving average of the low prices, showing a baseline or central line for the lower bands.
FifthBuffer (Color: AliceBlue)
- Purpose: Represents the lower boundary of the middle ATR band.
- Calculation: FifthBuffer[i] = LowMa[0] - AtrMultiplier * currAtr[0]
- Explanation: Displays a band that is the moving average of the low price minus the ATR multiplied by the ATR multiplier. Marks a lower level of support.
SixthBuffer (Color: Blue)
- Purpose: Represents the lower boundary of the lowest ATR band.
- Calculation: SixthBuffer[i] = LowMa[0] - 2 * AtrMultiplier * currAtr[0]
- Explanation: Displays the lowest band, which is the moving average of the low price minus twice the ATR multiplied by the ATR multiplier. Indicates a deeper level of support.
Trading Strategies
-
Trend Following Strategy:
- Identify the Trend: If the price is consistently above the middle lines (e.g., ThirdBuffer ), this signals an uptrend. If below, it signals a downtrend.
- Enter Long Positions: In an uptrend, enter long trades when the price touches one of the lower lines (support levels like FourthBuffer , FifthBuffer , SixthBuffer ) and bounces back upward.
- Enter Short Positions: In a downtrend, enter short trades when the price touches one of the upper lines (resistance levels like FirstBuffer , SecondBuffer , ThirdBuffer ) and starts moving down.
-
Reversion to the Mean Strategy:
- Buy near Lower Bands: When the price is near or below the lower bands (e.g., SixthBuffer , FifthBuffer ), it could indicate oversold conditions. Look for signs of price reversal and consider a buy trade.
- Sell near Upper Bands: When the price is near or above the upper bands (e.g., FirstBuffer , SecondBuffer ), it could indicate overbought conditions. Look for signs of price reversal and consider a sell trade.
-
Volatility Breakout Strategy:
- Monitor Band Expansion: When bands are expanding (widening), it signifies increasing volatility. Consider entering trades in the direction of the breakout once the price moves beyond the bands.
- Trade Breakouts: Enter trades when the price breaks through the upper bands (for long trades) or lower bands (for short trades) with increased volume and volatility.
Summary
The Multi Level ATR and Moving Average Band Indicator is a comprehensive tool designed to enhance trading strategies by providing clear visual cues about market trends, volatility, and potential reversal points. Its customizable parameters and multi-band display make it suitable for various trading styles and timeframes. By utilizing this indicator, traders can gain deeper insights into market conditions and make informed trading decisions.