Imbalance Pro
- Indicators
- Ivan Stefanov
- Version: 1.3
- Updated: 26 September 2024
- Activations: 20
For this purpose, there is a button on the top left which,
The recommended time frame is this one which estimate the line on the chart with apprx. 800-2000 candles since it has the most detail. More or less candles will blur the analysis.
Adjustable alert available.
1. Identify Key Levels
- Support and Resistance: Look for volume imbalances around key support and resistance levels. If there’s a significant volume imbalance (e.g., more buying volume) at a support level, it could indicate a strong defense of that level, signaling a potential bounce.
- Breakouts: During a breakout, if there is a significant volume imbalance favoring the direction of the breakout, it may suggest that the breakout is likely to continue.
2. Confirming Trends
- Trend Continuation: In an uptrend, if you notice a volume imbalance with more buying than selling, it can confirm the strength of the trend. Conversely, in a downtrend, more selling volume can confirm the continuation of the trend.
- Exhaustion Signals: If you see a volume imbalance with significantly higher selling volume after a prolonged uptrend, it could indicate potential trend exhaustion and a possible reversal.
3. Entry and Exit Strategies
- Entry Points: Use volume imbalance to time your entries. For instance, if you see a bullish volume imbalance at a key support level, it may be a good time to enter a long position.
- Exit Points: Similarly, if a strong imbalance in volume starts to reverse, it might be a signal to exit a trade, especially if this occurs near a resistance level or after a strong move.
4. Divergence Analysis
- Volume and Price Divergence: If the price is making new highs, but volume imbalance shows weakening buying volume, it could indicate a lack of momentum, potentially signaling a reversal. The opposite is true in downtrends.
5. Use with Other Indicators
- Combine with RSI or MACD: Pair volume imbalance with indicators like RSI or MACD to confirm overbought or oversold conditions. If there’s a volume imbalance favoring selling and RSI shows overbought, it might be a strong sell signal.
- Candlestick Patterns: Combine volume imbalance with candlestick patterns (like doji or engulfing patterns) at key levels to increase the accuracy of your trades.
6. Algorithmic Trading
- Automated Strategies: Some traders use volume imbalance as part of automated trading strategies, where algorithms detect and execute trades based on volume imbalances and other conditions.
7. Monitoring Order Flow
- Order Flow Analysis: By analyzing the order flow, you can see where large traders are placing their trades. Volume imbalance helps to identify if there is a significant push in one direction, often leading to sharp price movements.
Example:
Let’s say you are watching EUR/USD at a key support level, and you observe a volume imbalance with significantly more buy orders coming in. This could suggest that buyers are stepping in to defend the level, making it a potential buying opportunity. You might enter a long trade, placing your stop just below the support level and targeting the next resistance.
Key Considerations:
- Market Context: Always consider the broader market context. Volume imbalance in a low-liquidity period might not be as reliable as during peak trading hours.
- News Events: Be cautious around news events, as they can cause temporary volume imbalances that might not reflect true market sentiment.
By carefully analyzing volume imbalances and integrating them with your trading strategy, you can make more informed decisions in forex trading, improving your chances of success.

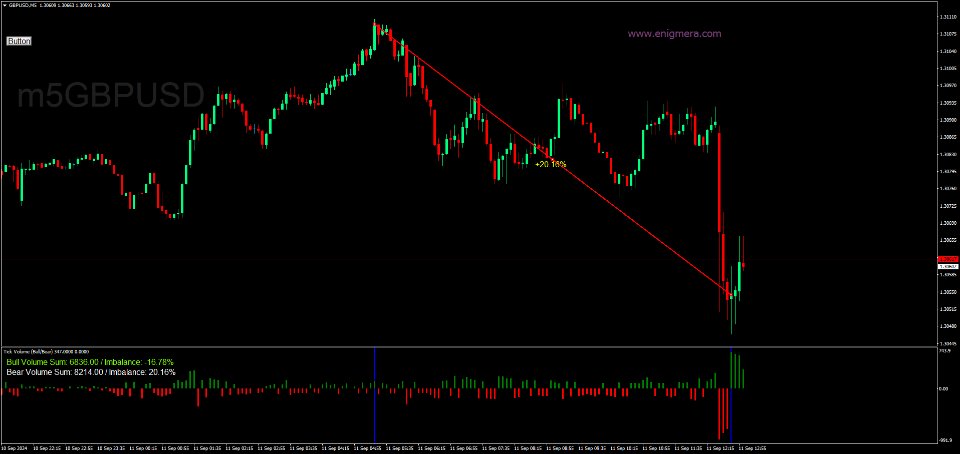
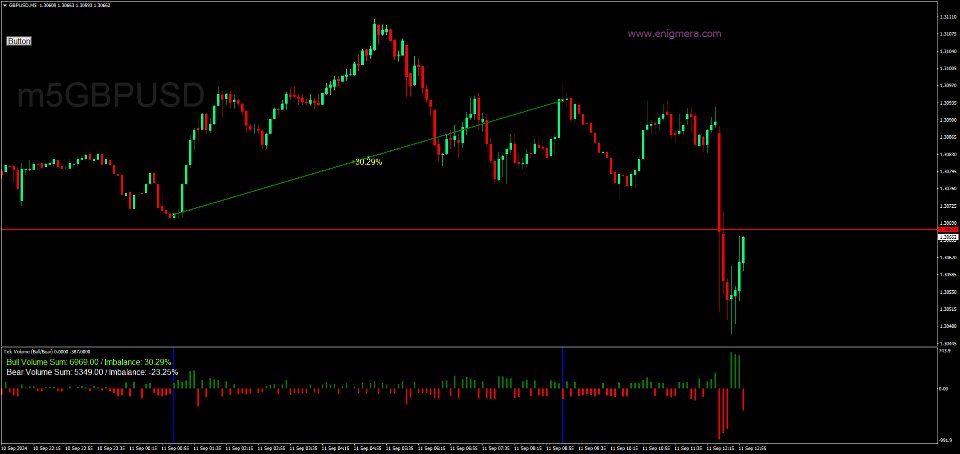
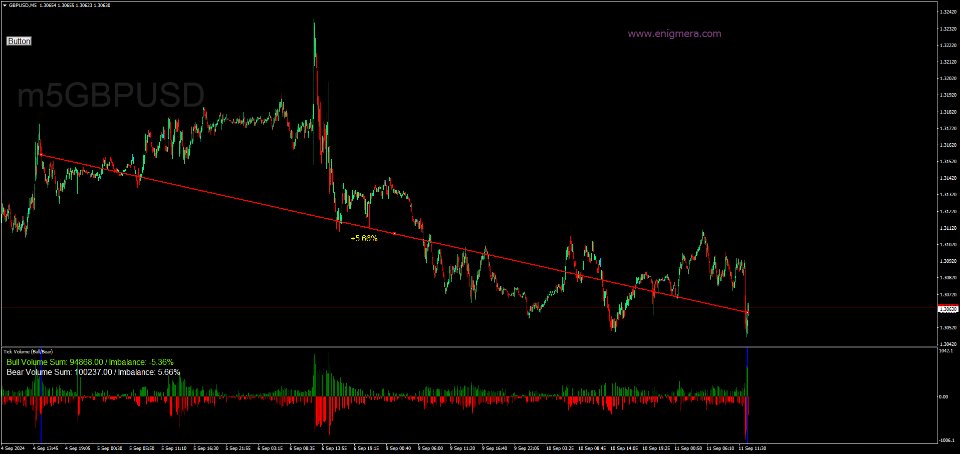
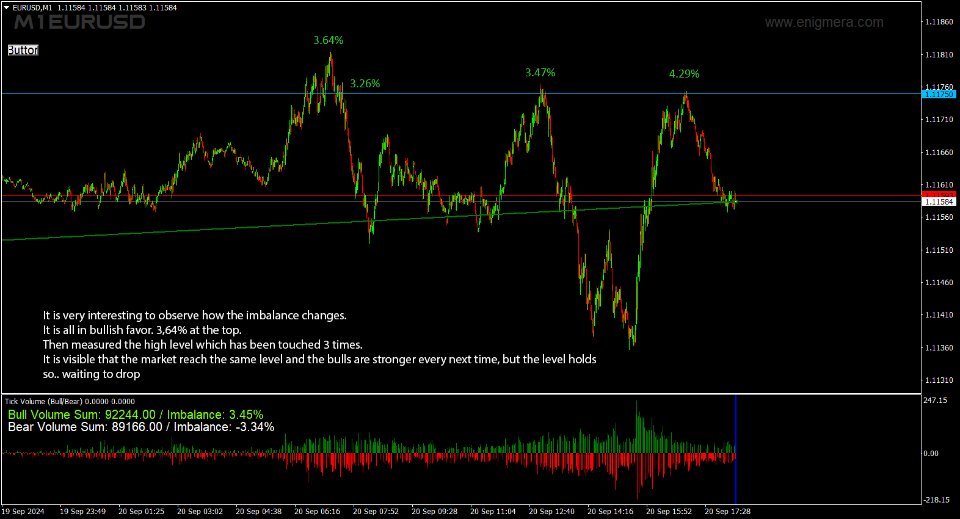
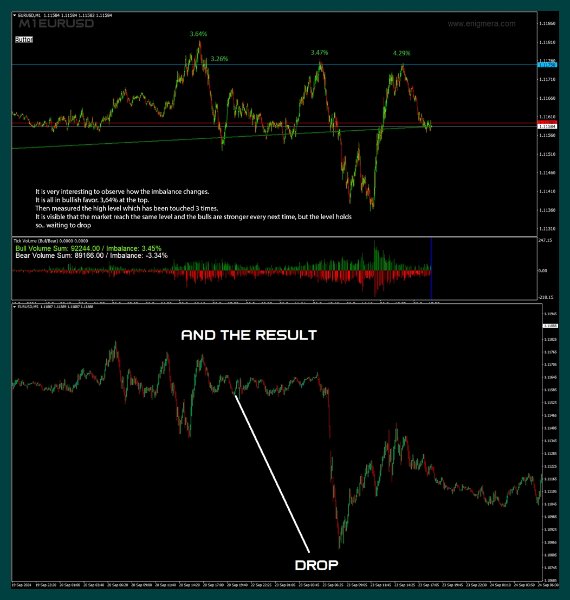







might be one of the slickest indis on the market.. ivan is the man..