• Overview
  • Reviews (1)
  • Comments (9)
  • What's new

Imbalance Pro

5
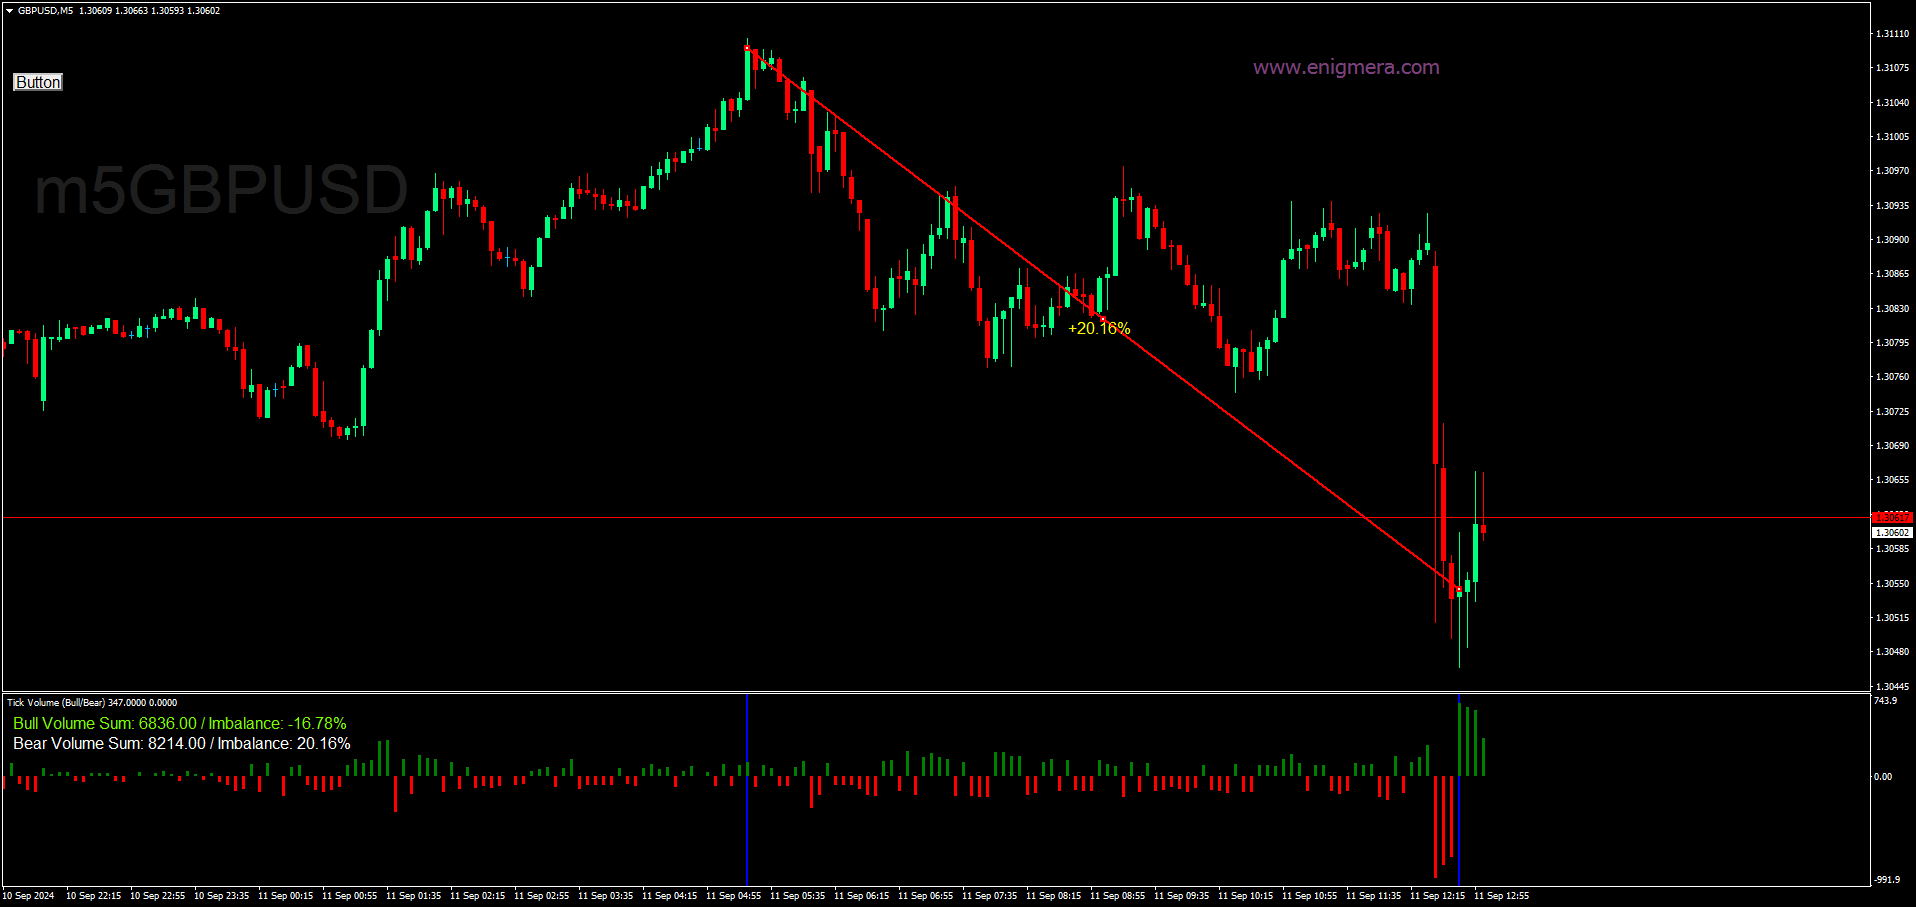
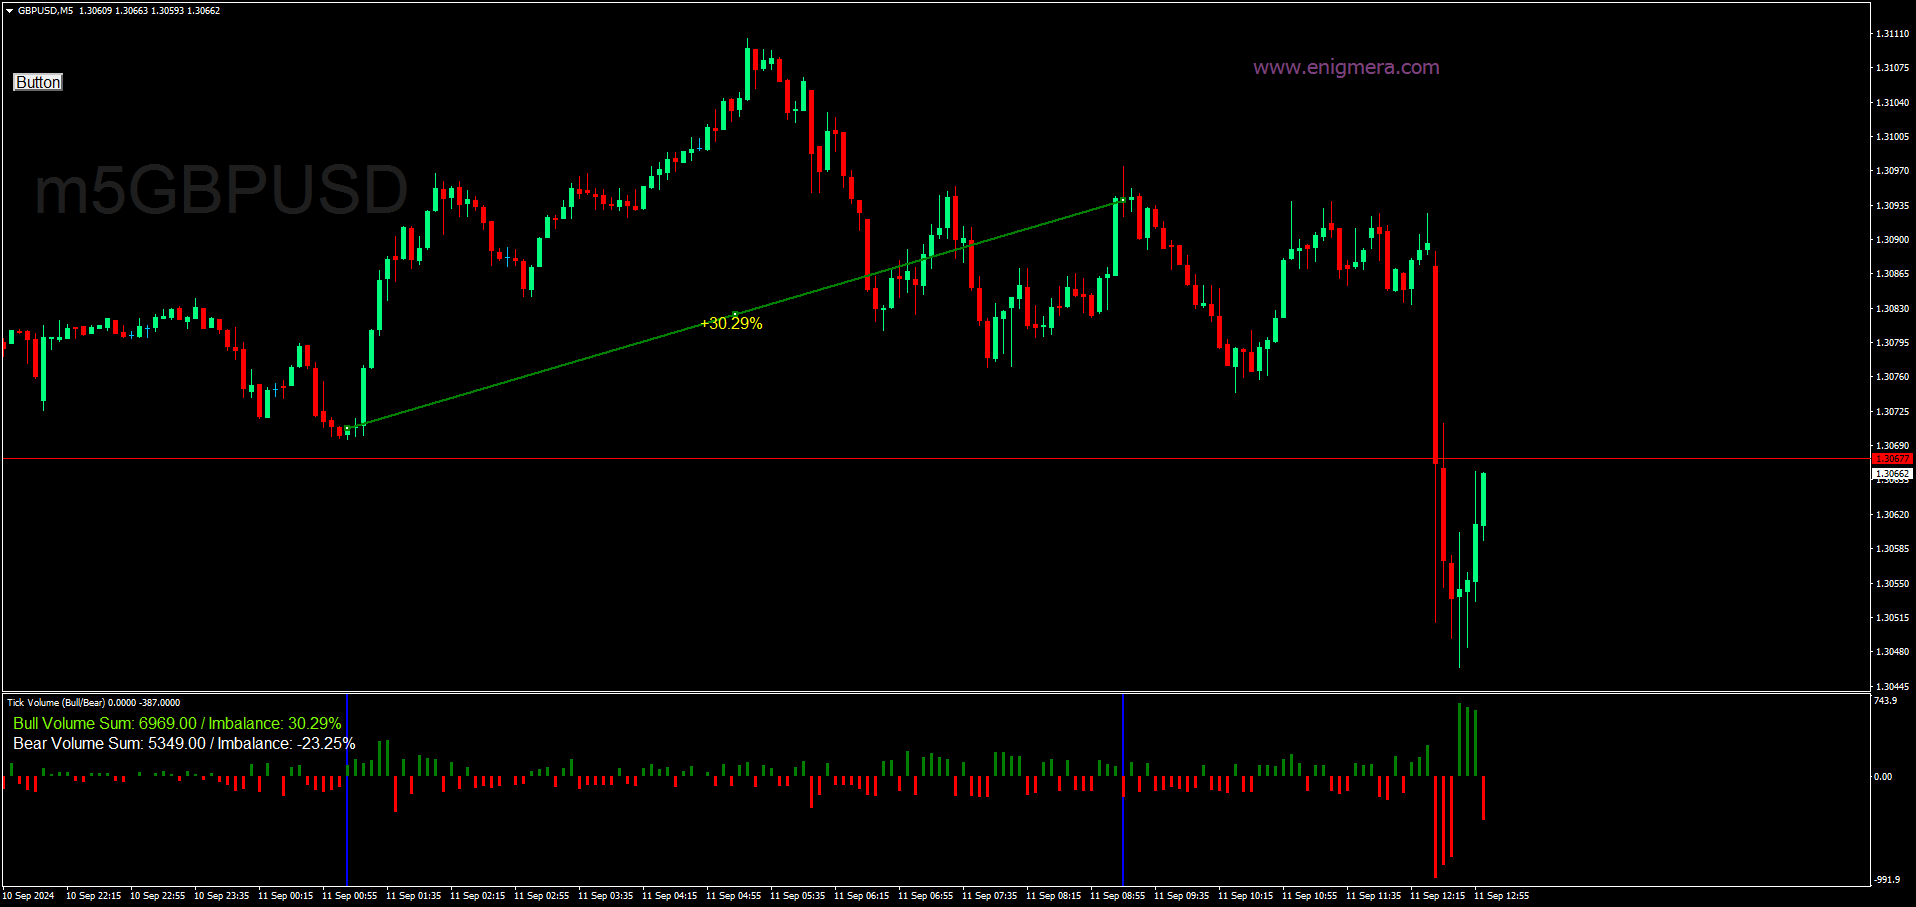
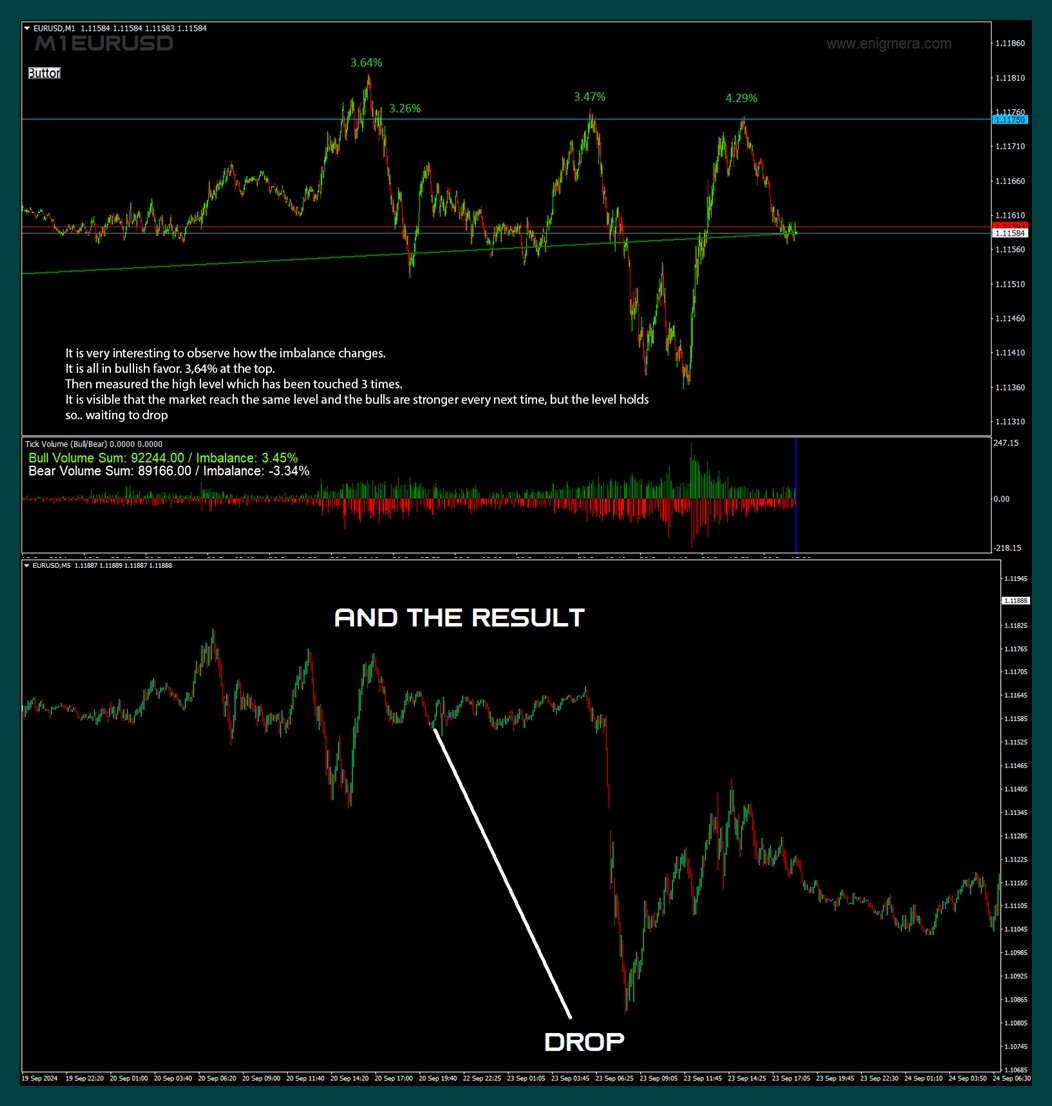
The indicator measures the imbalance between bulls and bears over a chosen period and shows a straight line between the two points.

If the bulls have more volume than the bears, the line turns green. 
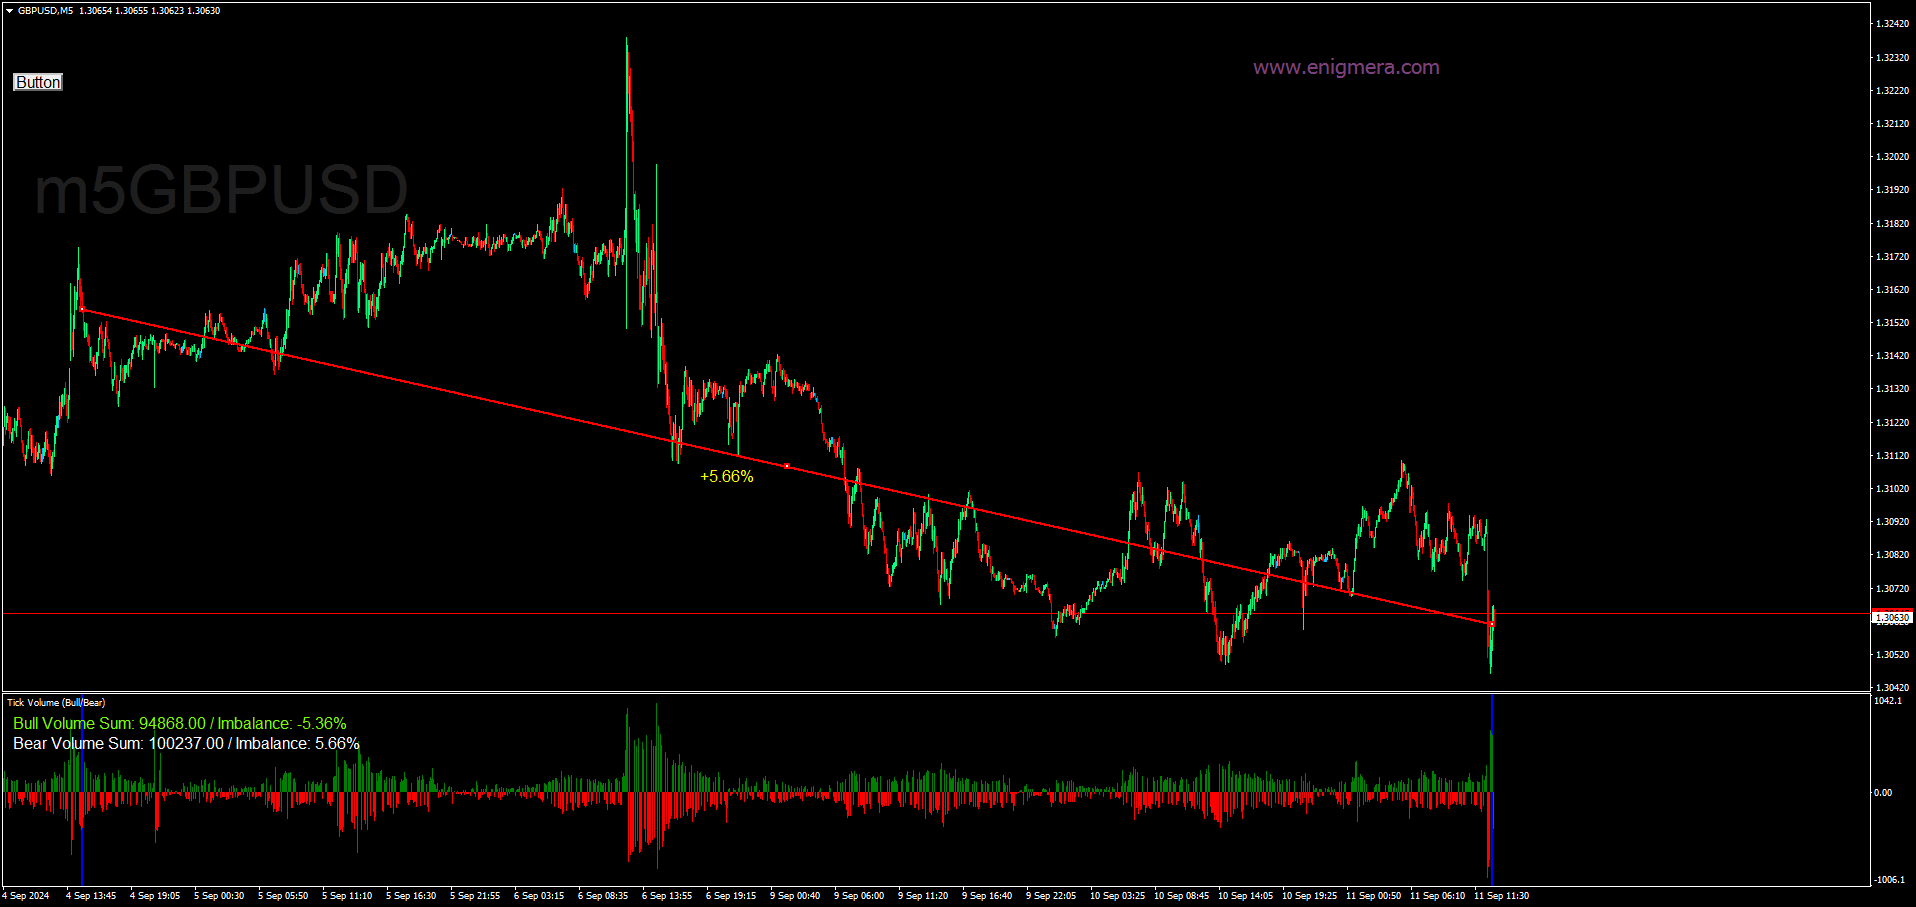
If the bears have more volume, it is red.
The line also shows the percentage difference in volume.


The indicator shows the same data in a separate window. You can also see the divided volume.

The indicator has two modes.

For this purpose, there is a button on the top left which, 

- if not pressed, measures the imbalance between an arbitrary point in the market and the current price. 
- If the button is pressed then you can measure the balance between whichever two points of the market you choose.

The recommended time frame is this one which estimate the line on the chart with apprx. 800-2000 candles since it has the most detail. More or less candles will blur the analysis.
Adjustable alert available. 

Using volume imbalance in Forex trading can be a powerful tool to identify potential market reversals or confirm trends. Volume imbalance refers to the difference in buying and selling volumes during a specific period, helping traders to gauge market sentiment. Here’s how you can use volume imbalance to your advantage:

1. Identify Key Levels

  • Support and Resistance: Look for volume imbalances around key support and resistance levels. If there’s a significant volume imbalance (e.g., more buying volume) at a support level, it could indicate a strong defense of that level, signaling a potential bounce.
  • Breakouts: During a breakout, if there is a significant volume imbalance favoring the direction of the breakout, it may suggest that the breakout is likely to continue.

2. Confirming Trends

  • Trend Continuation: In an uptrend, if you notice a volume imbalance with more buying than selling, it can confirm the strength of the trend. Conversely, in a downtrend, more selling volume can confirm the continuation of the trend.
  • Exhaustion Signals: If you see a volume imbalance with significantly higher selling volume after a prolonged uptrend, it could indicate potential trend exhaustion and a possible reversal.

3. Entry and Exit Strategies

  • Entry Points: Use volume imbalance to time your entries. For instance, if you see a bullish volume imbalance at a key support level, it may be a good time to enter a long position.
  • Exit Points: Similarly, if a strong imbalance in volume starts to reverse, it might be a signal to exit a trade, especially if this occurs near a resistance level or after a strong move.

4. Divergence Analysis

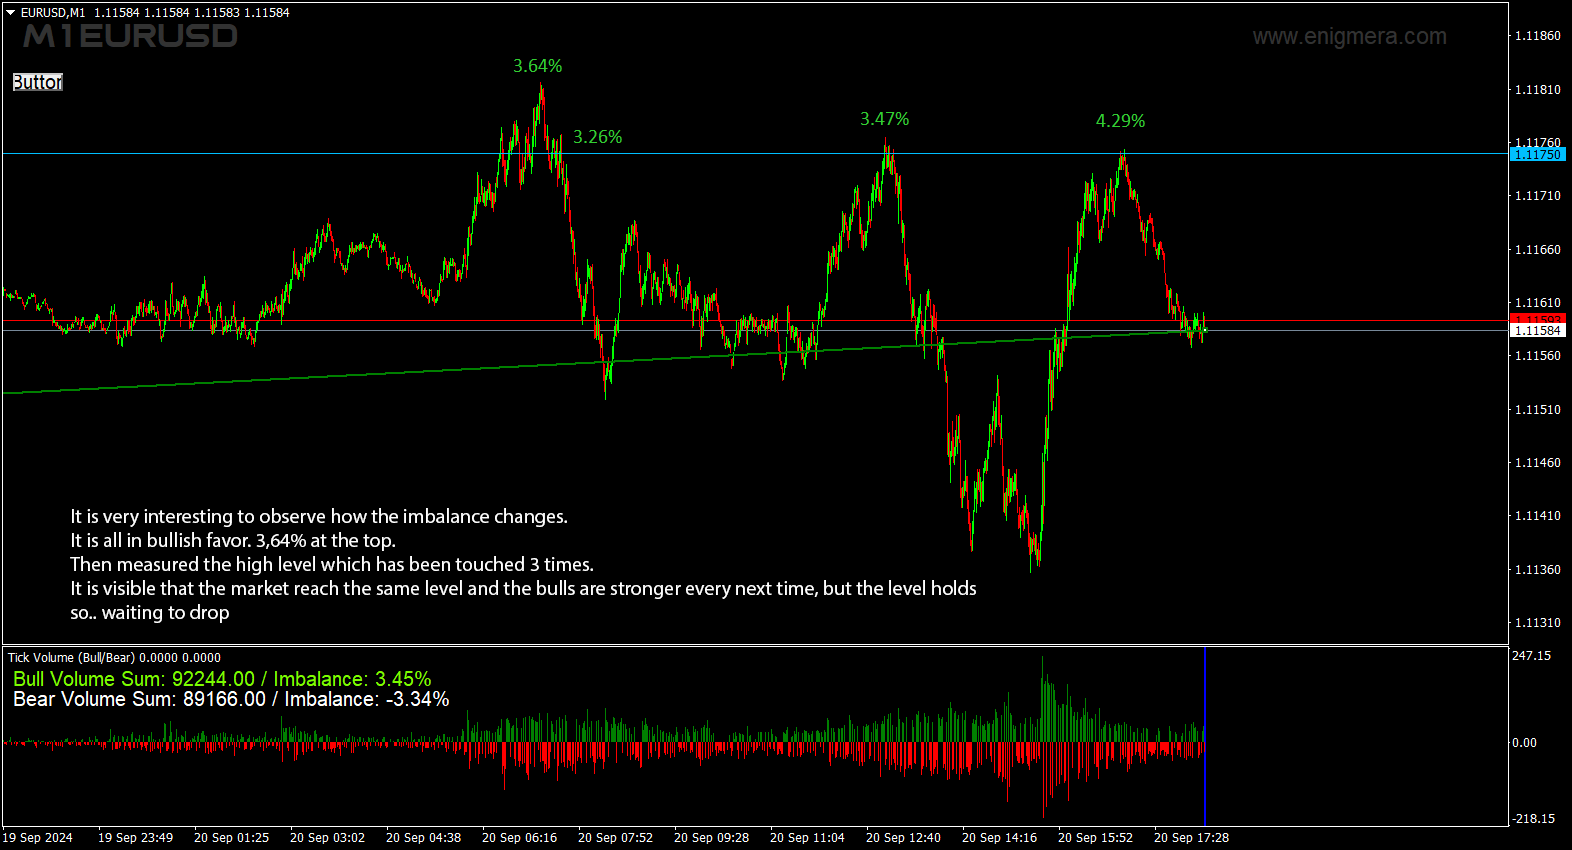
  • Volume and Price Divergence: If the price is making new highs, but volume imbalance shows weakening buying volume, it could indicate a lack of momentum, potentially signaling a reversal. The opposite is true in downtrends.

5. Use with Other Indicators

  • Combine with RSI or MACD: Pair volume imbalance with indicators like RSI or MACD to confirm overbought or oversold conditions. If there’s a volume imbalance favoring selling and RSI shows overbought, it might be a strong sell signal.
  • Candlestick Patterns: Combine volume imbalance with candlestick patterns (like doji or engulfing patterns) at key levels to increase the accuracy of your trades.

6. Algorithmic Trading

  • Automated Strategies: Some traders use volume imbalance as part of automated trading strategies, where algorithms detect and execute trades based on volume imbalances and other conditions.

7. Monitoring Order Flow

  • Order Flow Analysis: By analyzing the order flow, you can see where large traders are placing their trades. Volume imbalance helps to identify if there is a significant push in one direction, often leading to sharp price movements.

Example:

Let’s say you are watching EUR/USD at a key support level, and you observe a volume imbalance with significantly more buy orders coming in. This could suggest that buyers are stepping in to defend the level, making it a potential buying opportunity. You might enter a long trade, placing your stop just below the support level and targeting the next resistance.

Key Considerations:

  • Market Context: Always consider the broader market context. Volume imbalance in a low-liquidity period might not be as reliable as during peak trading hours.
  • News Events: Be cautious around news events, as they can cause temporary volume imbalances that might not reflect true market sentiment.

By carefully analyzing volume imbalances and integrating them with your trading strategy, you can make more informed decisions in forex trading, improving your chances of success.


Reviews 1
trick 86
455
trick 86 2024.09.13 21:21 
 

might be one of the slickest indis on the market.. ivan is the man..

Recommended products
The indicator allows you to trade binary options. The recommended time frame is М1 and the expiration time is 1,2,3 minutes. The indicator suitable for auto and manual trading. A possible signal is specified as a arrows above/under a candle. You should wait until the candle closes! Arrows are not re-painted Trade sessions: TOKYO section (Half-end) Currency pairs: USD/JPY Working time frame: M1 Expiration time: 1,2,3 minutes. The indicator also shows good results when using the martingale strateg
FREE
Rainbow MT4
Jamal El Alama
Rainbow MT4 is a technical indicator based on Moving average with period 34 and very easy to use. When price crosses above MA and MA changes color to green, it’s a signal to buy. When price crosses below MA and MA changes color to red, it’s a signal to sell. The Expert advisor ( Rainbow EA MT4) based on Rainbow MT4 indicator, as you can see in the short video below is now available here .
FREE
KT Double Top Bottom MT4
KEENBASE SOFTWARE SOLUTIONS
The double top bottom pattern is arguably one of the technical analysis's most popular chart patterns. These patterns are used to capitalize on recurring patterns and identify trend reversal patterns, thereby creating well-placed entry and exit levels. The KT Double Top Bottom is based on these patterns and fine-tunes the trade signal development process for traders. Features It's based on one of the most reliable trading patterns and brings some fine-tuning and automation to the process. A
Trade History Drawer
David Leander Tschacher
Trade History Drawer is an indicator for MetaTrader 4. It shows trades on the chart and draws them in customized colors. Furthermore, the indicator shows a trade summary and saves a CSV history file for either one selected pair or all pairs. Inputs General Settings Number Trades : Number of trades to be drawn on the chart, if -1 then all trades Magic Number : Only trades with this magic number, if -1 then ignore Line Style : Line Style Line Thickness : Line Thickness Arrow Size :
Pips forex - is a ready trading system . This indicator shows with arrows on the chart when and in what direction you need to open an order. If the arrow is green, then we open a buy deal, and if the arrow is red, then we open a sell deal. Everything is very simple and quite effective. TakeProfit set 15-25 points. StopLoss set at the level of points. When the dots move, we immediately override the StopLoss. Recommended timeframe for trading M1 and M5. This is a scalping strategy and works best
Daily Candle Predictor is an indicator that predicts the closing price of a candle. The indicator is primarily intended for use on D1 charts. This indicator is suitable for both traditional forex trading and binary options trading. The indicator can be used as a standalone trading system, or it can act as an addition to your existing trading system. This indicator analyzes the current candle, calculating certain strength factors inside the body of the candle itself, as well as the parameters of
ABCD Harmonic Patterns
Mehmet Ozhan Hastaoglu
Thanks to this indicator, you can easily see the new ABCD harmonic patterns in the chart. If the two price action lengths are equal, the system will give you a signal when it reaches the specified level. You can set the limits as you wish. For example, You can get the signal of the price, which occurs in the Fibonaci 38.2 and 88.6 retracements, and then moves for the same length, at the level you specify. For example, it will alarm you when the price reaches 80% as a percentage. In vertic
This is a new strategy for SUPPLY DEMAND areas It is based on a calculation using the tick volume to detect the big price action in market for both bear /bull actions this smart volume action candles are used to determine the supply and demand areas prices in between main supply and demand lines indicate sideway market  up arrows will be shown when prices moves above the main supply and the secondary supply lines Down arrows will be shown when prices moves below the main demand and the secondary
TPO Profile MT4
Kyra Nickaline Watson-gordon
5 (1)
Definition : TPO is a Time Price Opportunity. Instead of using bars or candles with an Open, High, Low, and Close price, each "bar" in a Market Profile is represented by horizontal bars against the price It is called Market Profile terminology. In other words time-price-opportunity (TPO) profiles are histograms of how much time was spent at each price within the span of the profile. By using a TPO chart, you are able to analyze the amount of trading activity, based on time, for each price lev
The new update makes this indicator a complete tool for studying, analyzing and operating probabilistic patterns. It includes: On-chart Multi-asset percentage monitor. Configurable martingales. Twenty-one pre-configured patterns , including Mhi patterns and C3. An advanced pattern editor to store up to 5 custom patterns. Backtest mode to test results with loss reports. Trend filter. Hit operational filter. Martingale Cycles option. Various types of strategies and alerts. Confluence between patte
This indicator prepared by using 57 days moving averagr and least square method. It can only work for 1 hr time interval. Once a signal created. It is creating order and 2 limit orders. It works in CFD pairs as well as in Forex pairs. You can fins our other products from link : https://www.mql5.com/en/users/drbastem/seller Also, you can ask all your questins from email : haskayafx@gmail.com or mobile : +90 530 867 5076 or @MehmetBastem on telegram application This system is for Long term and pr
The Penta-O is a 6-point retracement harmonacci pattern which usually precedes big market movements. Penta-O patterns can expand and repaint quite a bit. To make things easier this indicator implements a twist: it waits for a donchian breakout in the right direction before signaling the trade. The end result is an otherwise repainting indicator with a very reliable trading signal. The donchian breakout period is entered as an input. [ Installation Guide | Update Guide | Troubleshooting | FAQ | A
Super Reversal Pattern
Parfait Mujinga Ndalika
Super Reversal Pattern Indicator Unlock the power of advanced pattern recognition with our Super Reversal Pattern Indicator. Designed for traders seeking precision and reliability, this indicator identifies one of the most effective reversal patterns in technical analysis, offering a significant edge in your trading strategy. Key Features: Non-Repainting Accuracy: Enjoy the confidence of non-repainting technology. Once a Super Reversal Pattern is detected, it remains static, providing consis
This indicator Super Channel Pro indicator.Indicator displays trend movement. Indicator calculates automatically line. Features FiltPer - displays indicator channel period. deviation - displays indicator channel deviation. deviation2 - displays indicator channel deviation. How to understand the status: If the arrow is green, trend is up. If the arrow is red, trend is down. //////////////////////////////////////////////////////////////////////////////////////////////////////////////////////////
To download MT5 version please click  here . This is the exact conversion from TradingView: "WaveTrend [LazyBear]" By "zeusuk3". One of the coolest indicators out there to detect overbought and oversold zones. It can be used as a part of more complicated strategy and for confirming a potential trade setup. There are buffers to use in EAs also. The indicator is loaded light and non-repaint. - You can message in private chat for further changes you need. Thanks for downloading 
Binary Options Assistant (BOA) ICE Signals Indicator provides signals based on gkNextLevel Binary Options Strategy.  Indicators: 2 Bollinger Bands & Stochastic Stop missing trades, stop jumping from chart to chart looking for trade set-ups and get all the signals on 1 chart! U se any of the BOA Signals Indicator with the  Binary Options Assistant (BOA) Multi Currency Dashboard .   All BOA Signal Indicator settings are adjustable to give you more strategy combinations. The signals can be
FREE
Discover the power of precision and efficiency in your trading with the " Super Auto Fibonacci " MT4 indicator. This cutting-edge tool is meticulously designed to enhance your technical analysis, providing you with invaluable insights to make informed trading decisions. Key Features: Automated Fibonacci Analysis: Say goodbye to the hassle of manual Fibonacci retracement and extension drawing. "Super Auto Fibonacci" instantly identifies and plots Fibonacci levels on your MT4 chart, saving you tim
FREE
Blahtech Market Profile
Blahtech Limited
4.56 (16)
Was: $249  Now: $99   Market Profile defines a number of day types that can help the trader to determine market behaviour. A key feature is the Value Area, representing the range of price action where 70% of trading took place. Understanding the Value Area can give traders valuable insight into market direction and establish the higher odds trade. It is an excellent addition to any system you may be using. Blahtech Limited presents their Market Profile indicator for the MetaTrader community. Ins
We present you the indicator "Candle closing counter", which will become your indispensable assistant in the world of trading. That’s why knowing when the candle will close can help: If you like to trade using candle patterns, you will know when the candle will be closed. This indicator will allow you to check if a known pattern has formed and if there is a possibility of trading. The indicator will help you to prepare for market opening and market closure. You can set a timer to create a p
FRB Time MT4
Fernando Baratieri
FRB Time - FRB Trader Indicator that shows the server's time of operation. You can edit the font color and size of the timetable. Settings font color Font size Background color To move the Timetable, just click on it and move the mouse to where you want to leave it. After placing the Time where you want it, click again or press "ESC" and the time will stay where you left it.
FREE
TrendPlus
Sivakumar Subbaiya
4.08 (12)
Trend Plus   Trendplus  Indicator   Time Frame: Suitable for any time frame.  Purpose: Trend Prediction. Blue and red candle indicate the buy and sell call respectively. Buy: When the blue candle is formed buy call is initiated. close the buy trades when the next red candle will formed.   Sell: When the Red candle is formed Sell call is initiated. close the Sell trades when the next blue candle will formed.   Happy trade!!
FREE
Trend Catcher with Alert
Issam Kassas
4.72 (53)
The Trend Catcher: The Trend Catcher Strategy with Alert Indicator is a versatile technical analysis tool that aids traders in identifying market trends and potential entry and exit points. It features a dynamic Trend Catcher Strategy , adapting to market conditions for a clear visual representation of trend direction. Traders can customize parameters to align with their preferences and risk tolerance. The indicator assists in trend identification, signals potential reversals, serves as a trail
FREE
Extremum Reverse Bar
Yurij Izyumov
2.8 (5)
This indicator has been created for finding the probable reversal points of the symbol price. A small candlestick reversal pattern is used it its operation in conjunction with a filter of extremums. The indicator is not redrawn! If the extremum filter is disabled, the indicator shows all points that have a pattern. If the extremum filter is enabled, the condition works – if the history Previous bars 1 candles back contains higher candles and they are farther than the Previous bars 2 candle, such
FREE
Adjustable Consecutive Fractals  looks for 2 or more fractals in one direction and sends out a on screen alert, sound alert and push notification, for strong reversal points . Adjustable Consecutive Fractals, shows the fractals on chart along with a color changing text for buy and sell signals when one or more fractals appear on one side of price. Adjustable Consecutive Fractals is based Bill Williams Fractals . The standard Bill Williams fractals are set at a non adjustable 5 bars, BUT withe
Koala Fibo Base Time
Ashkan Hazegh Nikrou
3 (1)
Welcome to Koala Fibo Base Time Welcome to Koala Fibo Time Zone Welcome to Koala Fibo Time Extention Welcome to Missed Tool For Meta Trade! Simple Introduction : Fibonacci Time Zones are vertical lines based on the Fibonacci Sequence. These lines extend along the X axis (date axis) as a mechanism to forecast reversals based on elapsed time. A major low or high is often chosen as the starting point. Distances start relatively small and grow as the Fibonacci Sequence extends. Chartists can exten
FREE
In the age of speed, everyone wants to gets what he/she wants quickly. Trading is all about gaining money, and scalping is a way of doing it in a short time. The "Scorpion Scalper Pro" has been named on the scorpion because of its speed. The indicator serves to provide signals for the M15 timeframe. It also sends Alerts (window alert, email alert, push notification alert) whenever a buy/sell signal occurs, and the alerts are customizable (they can be turned ON or OFF). Indicator inputs : - Buy
Market Profile 3
Hussien Abdeltwab Hussien Ryad
3 (2)
Market Profile 3 MetaTrader 4 indicator  — is a classic Market Profile implementation that can show the price density over time, outlining the most important price levels, value area, and control value of a given trading session. This indicator can be attached to timeframes between M1 and D1 and will show the Market Profile for daily, weekly, monthly, or even intraday sessions. Lower timeframes offer higher precision. Higher timeframes are recommended for better visibility. It is also possible t
FREE
Scalping, Mean reversion or Position trading strategy Get into an established trend on a pullback in the market. Use the Pinch in the indicator for profit taking. Use the Pinch as a mean reversion strategy, scalping back to a moving average line.  Input Parameters Fast Sling Shot   configuration. Slow Sling Shot   configuration. Dual Sling Shot configuration. Price line configuration. Trigger zones or levels. Example   of Sling Shot trade idea: Price line sets the mood, below the baseline le
KT Horizontal Lines MT4
KEENBASE SOFTWARE SOLUTIONS
In MetaTrader, plotting multiple   horizontal lines   and then tracking their respective price levels can be a hassle. This indicator automatically plots multiple horizontal lines at equal intervals for setting price alerts, plotting support and resistance levels, and other manual purposes. This indicator is suitable for Forex traders who are new and looking for chances to make quick profits from buying and selling. Horizontal lines can help traders find possible areas to start trading when the
TrendCompass is a powerful indicator for trading in the currency and cryptocurrency markets on the MetaTrader 4 platform. This innovative tool is designed to simplify analysis and decision-making in trading. The indicator combines various technical indicators and algorithms to provide accurate and timely trading signals. Key Features: Multilevel Strategy: TrendCompass is based on a comprehensive strategy that includes analyzing major trends, support and resistance levels, and various technical
Buyers of this product also purchase
Gann Made Easy
Oleg Rodin
4.86 (83)
Gann Made Easy is a professional and easy to use Forex trading system which is based on the best principles of trading using the theory of mr. W.D. Gann. The indicator provides accurate BUY and SELL signals including Stop Loss and Take Profit Levels. You can trade even on the go using PUSH notifications. PLEASE CONTACT ME AFTER PURCHASE TO GET MY TRADING TIPS PLUS A GREAT BONUS! Probably you heard already many times about Gann trading methods. Usually Gann's theory is very complex thing not only
FX Volume
Daniel Stein
4.58 (33)
Visit our all-new   Stein Investments Welcome Page   to get the latest information, updates and trading strategies. FX Volume is the FIRST and ONLY volume indicator that provides a REAL insight into the market sentiment from a broker's point of view. It provides awesome insights into how institutional market participants, like brokers, are positioned in the Forex market, much faster than COT reports. Seeing this information directly on your chart is the real game-changer and breakthrough solut
Enigmera
Ivan Stefanov
5 (3)
ENIGMERA: The core of the market (If the demo of mql5.com doesn't working and you want to try Enigmera please message me.) Introduction This indicator and trading system is a remarkable approach to the financial markets . ENIGMERA uses the fractal cycles to accurately calculate support and resistance levels. It shows the authentic accumulation phase and gives direction and targets.  A system that works whether we are in a trend or a correction.   How does it operate? ENIGMERA comprises of fol
Atomic Analyst
Issam Kassas
5 (2)
First of all Its worth emphasizing here that this Trading Indicator is   Non-Repainting , Non Redrawing and Non Lagging Indicator   Indicator, Which makes it ideal from both manual and robot trading.  User manual: settings, inputs and strategy . The Atomic Analyst  is a PA Price Action Indicator that uses Strength and Momentum of the price to find a better edge in the market. Equipped with Advanced filters which help remove noises and false signals, and Increase Trading Potential. Using Multipl
FX Power MT4 NG
Daniel Stein
5 (13)
Trading GOLD, and currencies, with the dog walk strategy  - super smart Trading GOLD, and currencies, with the breakout strategy  - super easy Visit our all-new   Stein Investments Welcome Page   to get the latest information, updates and trading strategies. FX Power MT4 NG  is the next generation of our long-time very popular currency strength meter, FX Power.  And what does this next-generation strength meter offer? Everything you have loved about the original FX Power  PLUS GOLD/XAU stre
Trend Punch
Mohamed Hassan
4.95 (19)
This indicator is unstoppable when combined with our other indicator called  Support & Resistance . After purchase, send us a message and you will get it   for  FREE as a BONUS! Introducing Trend Punch , the revolutionary forex trend indicator that will transform the way you trade! Trend Punch is uniquely designed to provide precise buy and sell arrows during strong market trends, making your trading decisions clearer and more confident. Whether you're trading major currency pairs or exotic sym
Gann Swing Structure
Kirill Borovskii
5 (1)
This indicator is based on the mathematics of the great trader W.D. Ganna. With its help, you can easily find strong levels by analyzing swings to find the optimal entry point. The indicator works on all instruments and all timeframes. The indicator is fully manual and has control buttons. All you need to do is press the NEW button, a segment will appear, which you can place on any movement, swing or even 1 candle that you want to analyze. By placing the segment, press the OK button. A grid (th
Scalper Inside PRO
Alexey Minkov
4.73 (56)
An exclusive indicator that utilizes an innovative algorithm to swiftly and accurately determine the market trend. The indicator automatically calculates opening, closing, and profit levels, providing detailed trading statistics. With these features, you can choose the most appropriate trading instrument for the current market conditions. Additionally, you can easily integrate your own arrow indicators into Scalper Inside Pro to quickly evaluate their statistics and profitability. Scalper Inside
Dynamic Forex28 Navigator
Bernhard Schweigert
5 (1)
Dynamic Forex28 Navigator - The Next Generation Forex Trading Tool CURRENTLY 49% OFF. Dynamic Forex28 Navigator is the evolution of our long-time, popular indicators, combining the power of three into one: Advanced Currency Strength28 Indicator (695 reviews) + Advanced Currency IMPULSE with ALERT (520 reviews) + CS28 Combo Signals (recent Bonus) Details about the indicator   https://www.mql5.com/en/blogs/post/758844 What Does The Next-Generation Strength Indicator Offer? Everything you loved
Currently 20% OFF ! Best Solution for any Newbie or Expert Trader! This dashboard software is working on 28 currency pairs plus one. It is based on 2 of our main indicators (Advanced Currency Strength 28 and Advanced Currency Impulse). It gives a great overview of the entire Forex market plus Gold or 1 indices. It shows Advanced Currency Strength values, currency speed of movement and signals for 28 Forex pairs in all (9) timeframes. Imagine how your trading will improve when you can watch the e
TPSproTREND PrO
Roman Podpora
4.79 (19)
TPSpro TRENDPRO  - is a trend indicator that automatically analyzes the market and provides information about the trend and each of its changes, as well as giving signals for entering trades without redrawing! The indicator uses each candle, analyzing them separately. referring to different impulses - up or down impulse. Exact entry points into transactions for currencies, crypto, metals, stocks, indices!  Version MT5             DETAILED DESCRIPTION              R ecommended to use with an indi
Introducing ON Trade Waves Patterns Harmonic Elliot Wolfe, an advanced indicator designed to detect various market patterns using both manual and automated methods. Here's how it works: Harmonic Patterns: This indicator can identify harmonic patterns that appear on your chart. These patterns are essential for traders practicing harmonic trading theory, as popularized by Scott Carney's book "Harmonic Trading vol 1&2." Whether you draw them manually or rely on automated detection, ON Trade Waves
Scalper Vault
Oleg Rodin
5 (27)
Scalper Vault is a professional scalping system which provides you with everything you need for successful scalping. This indicator is a complete trading system which can be used by forex and binary options traders. The recommended time frame is M5. The system provides you with accurate arrow signals in the direction of the trend. It also provides you with top and bottom signals and Gann market levels. The indicator provides all types of alerts including PUSH notifications. PLEASE CONTACT ME AFT
TPA True Price Action indicator reveals the true price action of the market makers through 100% non-repainting signals (except early signals mode) strictly at the close of a candle! TPA shows entries and re-entries, every time the bulls are definitely stronger than the bears and vice versa. Not to confuse with red/green candles. The shift of power gets confirmed at the earliest stage and is ONE exit strategy of several. There are available now two free parts of the TPA User Guide for our custo
Currency Strength Wizard is a very powerful indicator that provides you with all-in-one solution for successful trading. The indicator calculates the power of this or that forex pair using the data of all currencies on multiple time frames. This data is represented in a form of easy to use currency index and currency power lines which you can use to see the power of this or that currency. All you need is attach the indicator to the chart you want to trade and the indicator will show you real str
PRO Renko System
Oleg Rodin
5 (25)
PRO Renko System is a highly accurate trading system specially designed for trading RENKO charts. The ARROWS and Trend Indicators DO NOT REPAINT! The system effectively neutralizes so called market noise giving you access to accurate reversal signals. The indicator is very easy to use and has only one parameter responsible for signal generation. You can easily adapt the tool to any trading instrument of your choice and the size of the renko bar. I am always ready to provide extra support to help
TPSpro RFI Levels
Roman Podpora
4.82 (22)
A key element in trading is zones or levels from which decisions to buy or sell a trading instrument are made. Despite attempts by major players to conceal their presence in the market, they inevitably leave traces. Our task was to learn how to identify these traces and interpret them correctly. INSTRUCTIONS    RUS    -    ENG            R ecommended to use with an indicator   -   TPSpro  TREND PRO -  Version MT5 Main functions: Displaying active zones for sellers and buyers! The indicator show
Currency Strength Exotics
Bernhard Schweigert
4.87 (30)
CURRENTLY 20% OFF ! Best Solution for any Newbie or Expert Trader! This Indicator is specialized to show currency strength for any symbols like Exotic Pairs Commodities, Indexes or Futures. Is first of its kind, any symbol can be added to the 9th line to show true currency strength of Gold, Silver, Oil, DAX, US30, MXN, TRY, CNH etc. This is a unique, high quality and affordable trading tool because we have incorporated a number of proprietary features and a new formula. Imagine how your trading
Trend Pulse
Mohamed Hassan
5 (4)
Please contact me after purchase to immediately get your PDF strategy + documentation for Trend Pulse !  Introducing Trend Pulse , a unique and robust indicator capable of detecting bullish, bearish, and even ranging trends! Trend Pulse uses a special algorithm to filter out market noise with real precision. If the current symbol is moving sideways, Trend Pulse will send you a ranging signal, letting you know that it's not a good time to enter a trade. This excellent system makes Trend Pulse
MetaBands M4
Vahidreza Heidar Gholami
5 (2)
MetaBands uses powerful and unique algorithms to draw channels and detect trends so that it can provide traders with potential points for entering and exiting trades. It’s a channel indicator plus a powerful trend indicator. It includes different types of channels which can be merged to create new channels simply by using the input parameters. MetaBands uses all types of alerts to notify users about market events. Features Supports most of the channel algorithms Powerful trend detection algorith
Gold Channel is a volatility-based indicator, developed with a specific timing algorithm for the XAUUSD pair, which consists of finding possible corrections in the market. This indicator shows two outer lines, an inner line (retracement line) and an arrow sign, where the theory of the channel is to help identify overbought and oversold conditions in the market. The market price will generally fall between the boundaries of the channel. If prices touch or move outside the channel it is a tra
Automated Trendlines
Georgios Kalomoiropoulos
5 (16)
Trendlines  are the most essential tool of technical analysis in forex trading.  Unfortunately, most  traders don’t draw them correctly. Automated Trendlines indicator is a professional tool for serious traders that help you visualize the trending movement of the markets . There are two types of Trendlines Bullish Trendlines and Bearish Trendlines. In the uptrend, Forex trend line is drawn through the lowest swing-points of the price move. Connecting at least two "lowest lows" will create a
Reversal Sniper is designed to find the extreme reversals of the price. Indicator collects data of Cycle Sniper Indicator. NOTE: REVERSAL SNIPER Indicator is made for Cycle Sniper Users as an additional tool.  However, it can be used by the traders who look for finding out strong reversal levels. Indicator works on all timeframes and all instruments. Reversal  Sniper  Checks: Harmonic Patterns RSI Zig Zag and Harmonic Swings Cycle Sniper Indicator's Buy / Sell Signals The complex algo i
PLEASE READ THE INFO DOWN BELOW BEFORE PURCHASING THE PRODUCT! Apollo Pips PLUS SP is a unique product!  IT IS FOR THOSE WHO WANT TO GET MY NEW "APOLLO PIPS" INDICATOR PLUS "SUPER PACK" BONUS WITH ACCESS TO ALL MY TRADING INDICATORS! By purchasing the Apollo Pips PLUS SP product you're actually purchasing an absolutely new version of my Apollo Pips indicator. This version of the indicator has got an improved algorithm and an easy to use parameter which gives you the opportunity to use the indica
Introducing the South African Sniper indicator created by a small group of traders with a few years trading trading the financial market profitably . This is a plug and play indicator that provides you with  BUY and SELL (SNIPER ENTRY) signals with TARGET and trail stops. The indicator Works with all MT4 trading instruments. The indicator uses previous  chart data as receipt to speculate on future market moves.
This dashboard shows the latest available harmonic patterns for the selected symbols, so you will save time and be more efficient / MT5 version . Free Indicator:   Basic Harmonic Pattern Comparison of "Basic Harmonic Pattern" vs. "Basic Harmonic Patterns Dashboard" Indicators Feature Basic Harmonic Pattern Basic Harmonic Patterns Dashboard Functionality Detects and displays harmonic patterns on a single chart Searches multiple symbols and timeframes for harmonic patterns, displays result
PowerBall Signals is a BUY/SELL signals indicator based on the idea of using support/resistance zones. The indicator detects special reversal patterns based on support/resistance zones and provide these signals on your chart. The main idea of the indicator is using the MTF (Multi Time Frame) analysis and provide signals based on the levels from your current and next higher time frame. This method allows to predict possible price reversals on any market be it currencies, metals, indices or even c
IX Power MT4
Daniel Stein
5 (5)
IX Power finally brings the unbeatable precision of FX Power to all your trading symbols. It accurately determines the intensity of short, medium and long-term trends in your favourite indices, stocks, commodities, ETFs, and even cryptocurrencies. You can analyse everything your terminal has to offer. Try it out and experience how your timing improves significantly when trading. Read about our latest strategic development -  Easy scalping with IX Power Visit our all-new   Stein Investments
Apollo BuySell Predictor is a professional trading system which includes several trading modules. It provides a trader with breakout zones, fibonacci based support and resistance levels, pivot trend line, pullback volume signals and other helpful features that any trader needs on a daily basis. The system will work with any pair. Recommended time frames are M30, H1, H4. Though the indicator can work with other time frames too except for the time frames higher than H4. The system is universal as
Ultimate Gold Advisor for MetaTrader 4 The Ultimate Gold Advisor is an advanced technological tool designed to optimize the trading experience on MetaTrader 4. Created to meet the needs of experienced traders, this indicator combines precision, sophisticated analysis, and versatile functionality, offering support for informed trading decisions. Ideal for gold trading but also applicable across a wide range of assets, the Ultimate Gold Advisor can help you improve your market strategies. What ma
More from author
Enigmera
Ivan Stefanov
5 (3)
ENIGMERA: The core of the market (If the demo of mql5.com doesn't working and you want to try Enigmera please message me.) Introduction This indicator and trading system is a remarkable approach to the financial markets . ENIGMERA uses the fractal cycles to accurately calculate support and resistance levels. It shows the authentic accumulation phase and gives direction and targets.  A system that works whether we are in a trend or a correction.   How does it operate? ENIGMERA comprises of fol
Master GANN’s precise targets are calculated based on his time-tested methods and presented right in front of you. This tool is designed to make trading smoother and more intuitive. By adjusting the white line upwards or the green line downwards, you’ll immediately see the reason GANN's techniques remain influential in the world of trading. GANN’s strategies revolve around predicting market movements with a high degree of accuracy, and this tool brings that power to your fingertips. Whether you’
Sense
Ivan Stefanov
SENSE is an automated fusion of  GANN target levels combined with fractal trend support. Mighty powerful combination. The system tells us where to open and close our trades. No redrawing.  No more wasting time on complex calculations— SENSE does it all for you. Just insert the indicator. Key Principles: Market is bullish when price is above the white lines - Buy above the white lines, stop below - Green lines are bullish targets Market is bearish when price is below the white lines - Sell
Two Snakes
Ivan Stefanov
5 (1)
2 SNAKES  is a first class scalping system. As the entries are quite precise, you are likely to become addicted to this system very quickly.  You have 2 snakes. When you see a candle above or below them that does not touch them - that is your scalping signal. Then buy or sell at the green line or close. If you use a larger time frame, scalping can become trend following. The snakes are calculated precisely in relation to the current state of the market. They ARE NOT moving averages.  You dec
Levelss
Ivan Stefanov
5 (1)
The LEVELSS indicator shows: - Daily bullish and bearish zone. It is visible everyday from 00:00 to 23:59.  - The weekly bullish and bearish zone. It is visible from Monday 0:00 to Friday 23:59 every week. - Specially calculated channel from a specific timeframe that is displayed on all other timeframe. By default, this is the 4-hour timeframe that you can change to whichever other timeframe you wish to trade. It is calculated non-stop. At the top left of the screen there is an indication of
This is the indicator for the biggest money.  It's performance is exceptional. Whatever interest there is in the market you will see it.  In almost all cases it will only give you a long term view of the market, but don't be fooled into thinking this is event bound. Nothing like that. It finds where the biggest interest is in the market and shows it to you. Do not forget that the biggest money (interests)  not shown on the market everyday . That's something you haven't encountered.The price is
This indicator is based on practical experience.  Insert the date/time of your top/bottom. It calculates the most visited level from top/bottom up to the current moment. It updates automatically with each new candle. You can simultaneously use multiple indicators for different trends and timeframes. The length is always plotted from the beginning of your period to the present. Recommendations: Currency pair: All pairs, all markets Timeframe: All timeframes Minimum deposit : No minimum dep
FREE
This indicator effectively separates the tick volume in the forex market into bullish and bearish categories. Additionally, it provides the functionality to calculate and display the sum of bullish and bearish tick volumes for any selected period of your choice. You can easily adjust the period by moving the two blue lines on the chart, allowing for customizable and precise volume analysis tailored to your trading needs. If you find it usefull your reviews will be appreciated! Happy trading!
FREE
Versuss
Ivan Stefanov
Versuss is a special tool. The indicator can create new tools for your analysis. You can compare any two instruments on your platform. Example 1 If you are trading USDJPY, your analysis may also include SP500 and NIKKEI225. With Versuss , you can compare how one index moves relative to the other and then compare this to the USDJPY pair. If the forex market follows the movement of the indices, you can get a clear forecast of what is coming next and make decisions in advance. You can apply the
FREE
In the trading world, a trend that follows a 45-degree angle is considered sustainable.  However, accurately measuring this critical angle remains a challenge as there is no clear method described. Traders can only guess how it is calculated, how many candle counts there should be, and what the appropriate chart zoom is. We have solved this problem and defined all the conditions logically, and now presenting you Trend Angle 45. It is a tool that visualizes the 45-degree trend line based on a
Filter:
trick 86
455
trick 86 2024.09.13 21:21 
 

might be one of the slickest indis on the market.. ivan is the man..

Ivan Stefanov
2009
Reply from developer Ivan Stefanov 2024.09.16 20:52
Thank you! Enjoy!
Reply to review
Version 1.3 2024.09.26
In the new version, below the sum of the bullish and bearish volume, you can see the number of candles covered by the line on the chart. This would help for more accurate analysis.
Version 1.2 2024.09.18
Alert changed to every new candle instead on tick.
Version 1.1 2024.09.18
Alert added. You can choose the imbalance % for the alert.