CM Ema Trend Bars
- Indicators
- Biswarup Banerjee
- Version: 2.0
- Updated: 23 August 2024
Indicator Name: CM EMA Trend Bars
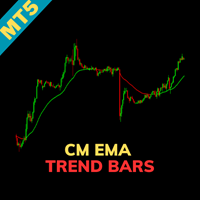
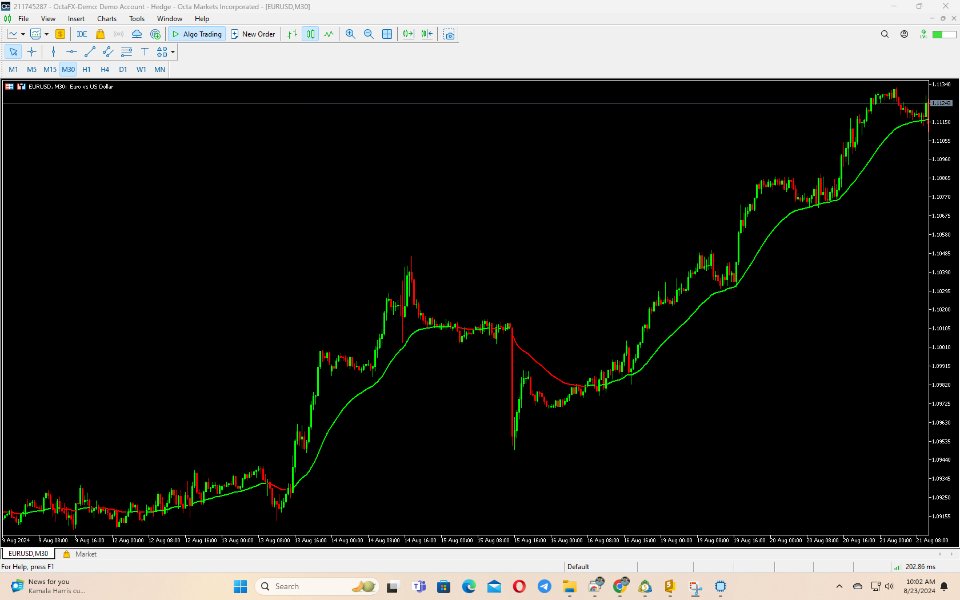
Overview: The CM EMA Trend Bars indicator is a straightforward yet effective tool that changes the color of price bars based on their relationship to the Exponential Moving Average (EMA). This visual cue helps traders quickly identify trend direction and potential trading opportunities.
Key Features:
- Dynamic Bar Coloring: The indicator changes the color of the bars depending on whether they are above or below the EMA, providing a clear visual representation of the current trend.
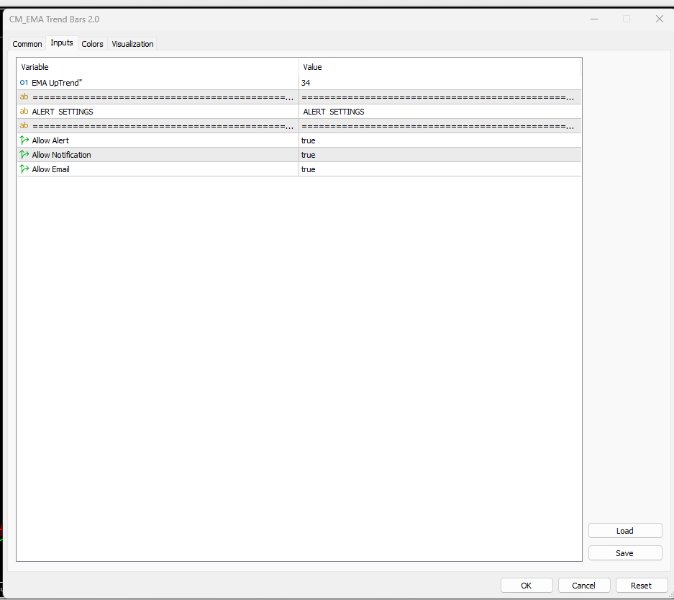
- Customizable EMA Period: Users can adjust the EMA period via the Inputs tab, allowing for flexibility in adapting the indicator to different trading styles and market conditions.
- Optional EMA Plotting: The indicator allows users to toggle the visibility of the EMA on the chart, giving the option to focus solely on the color-coded bars or include the EMA line for additional context.
- HLC/3 Calculation Method: The indicator uses the average of the high, low, and close (HLC/3) to determine whether a bar is above or below the EMA. This approach helps to filter out market noise and reduces false signals, particularly during periods of market chop.
Designed For:
- Trend Followers: Ideal for traders who want a quick and easy way to identify the prevailing trend.
- All Timeframes: The indicator is versatile and can be applied across various timeframes, from short-term intraday charts to longer-term analysis.
















Very good indicator. Thank you yery much!