• Overview
  • Reviews
  • Comments

CVD SmoothFlow Pro

CVD SmoothFlow Pro - Unlimited Volume Analysis for Any Asset!

CVD SmoothFlow Pro is the ultimate solution for traders seeking precise and unlimited volume analysis. Utilizing Cumulative Volume Delta (CVD) with advanced noise filtering, the Pro Version provides the flexibility and precision needed to trade any financial asset.

🔍 What does CVD SmoothFlow Pro offer?

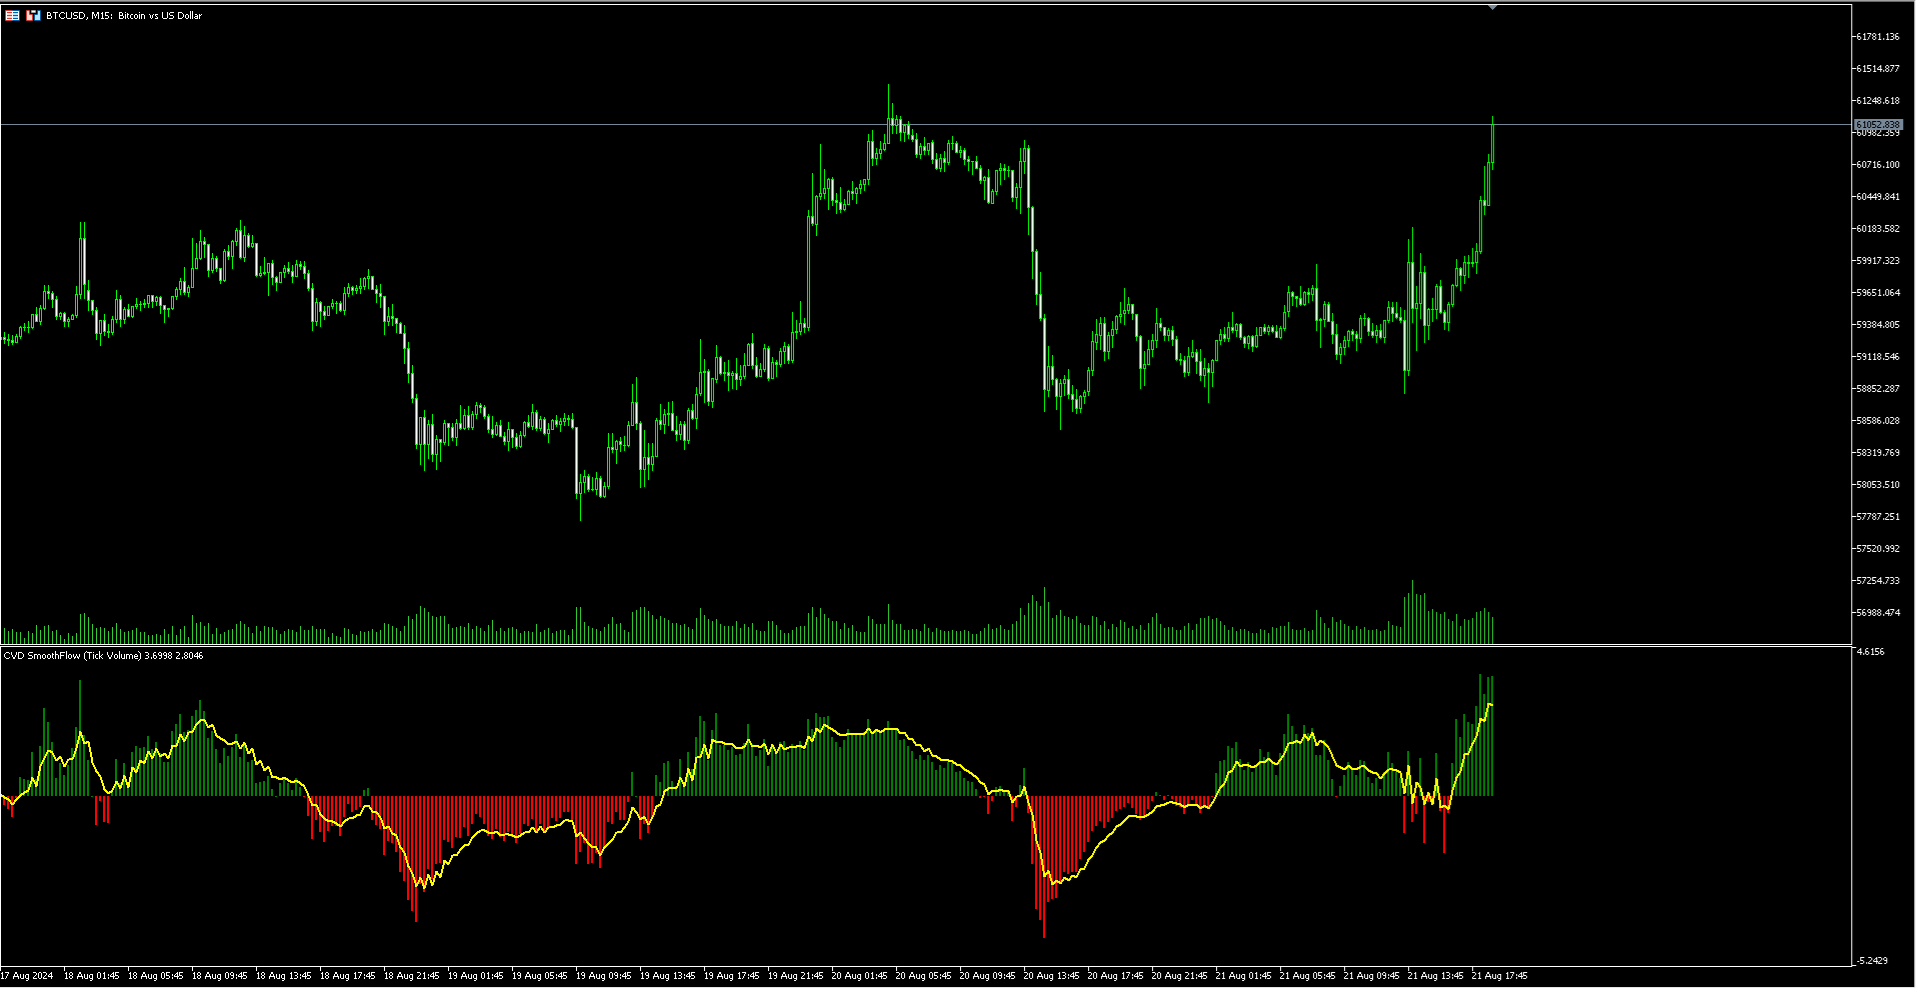
📊 Clear Analysis: Filters out noise and highlights significant volume movements across any financial asset.

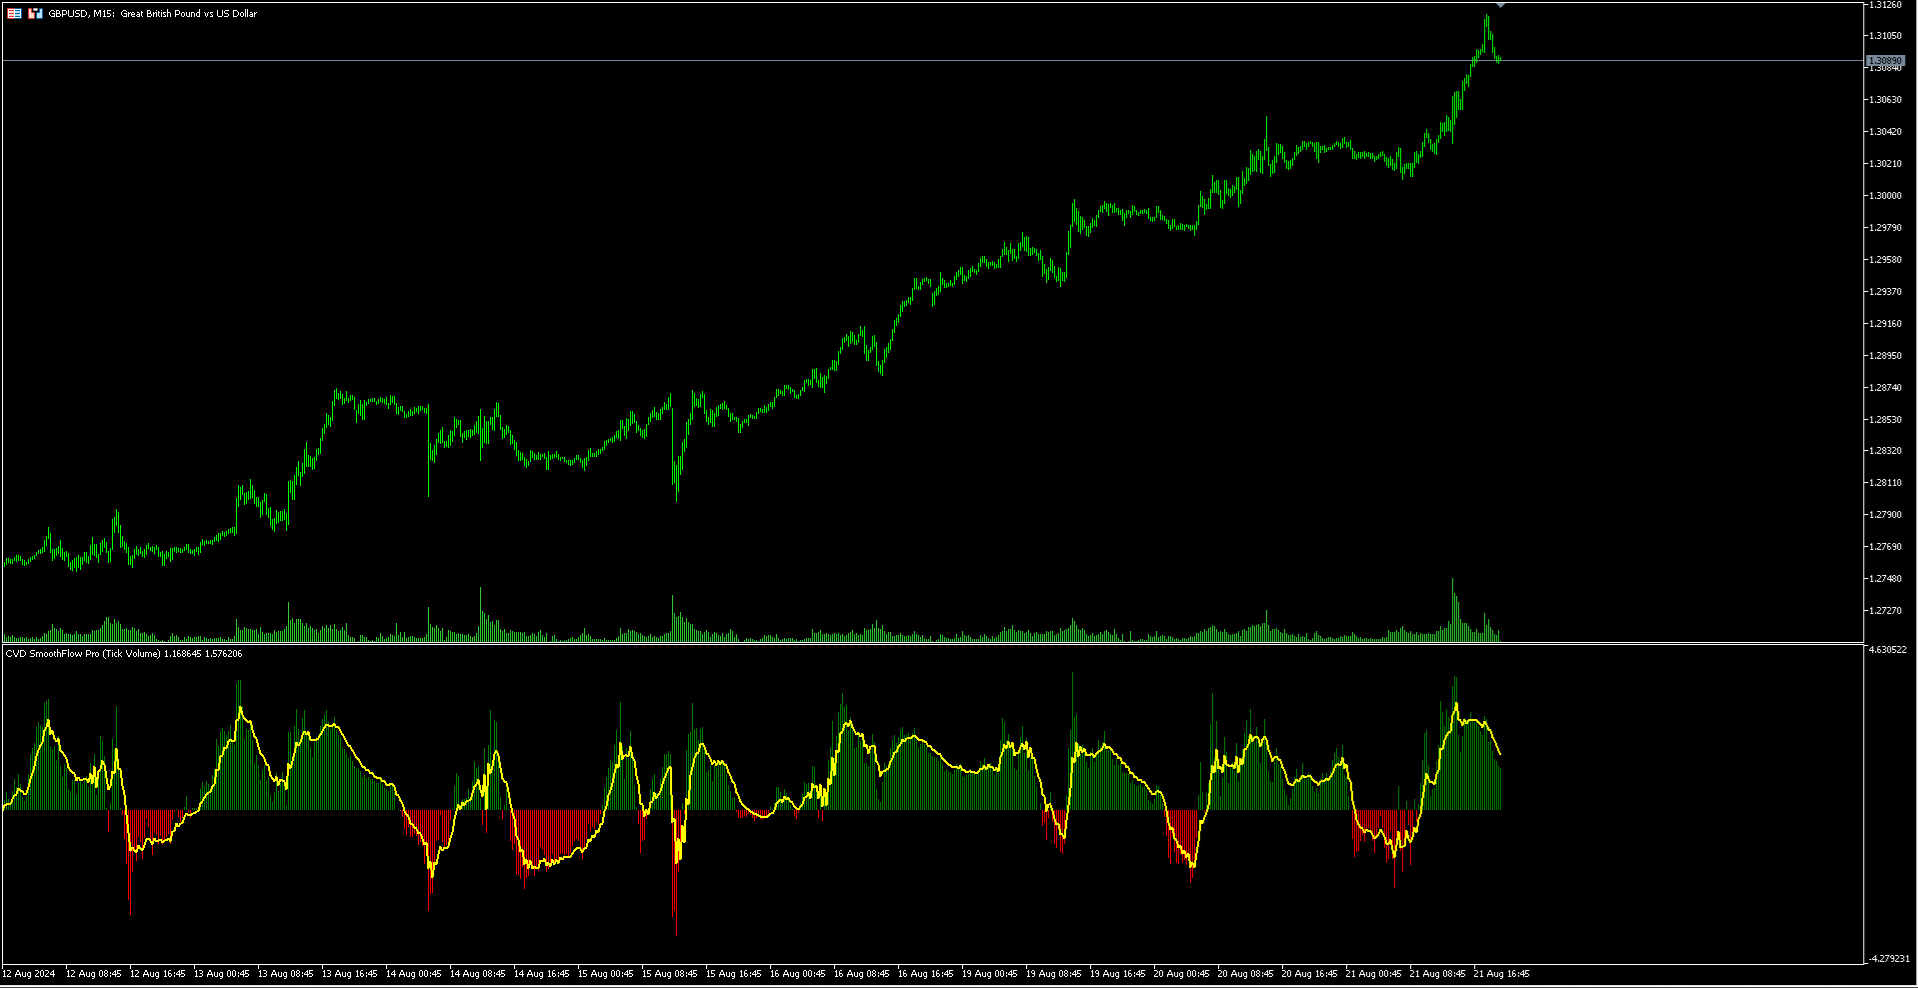
⚙️ Precise Calculation: Monitors the differences between buys and sells, offering a detailed view of volume behavior in forex, indices, cryptocurrencies, and more.

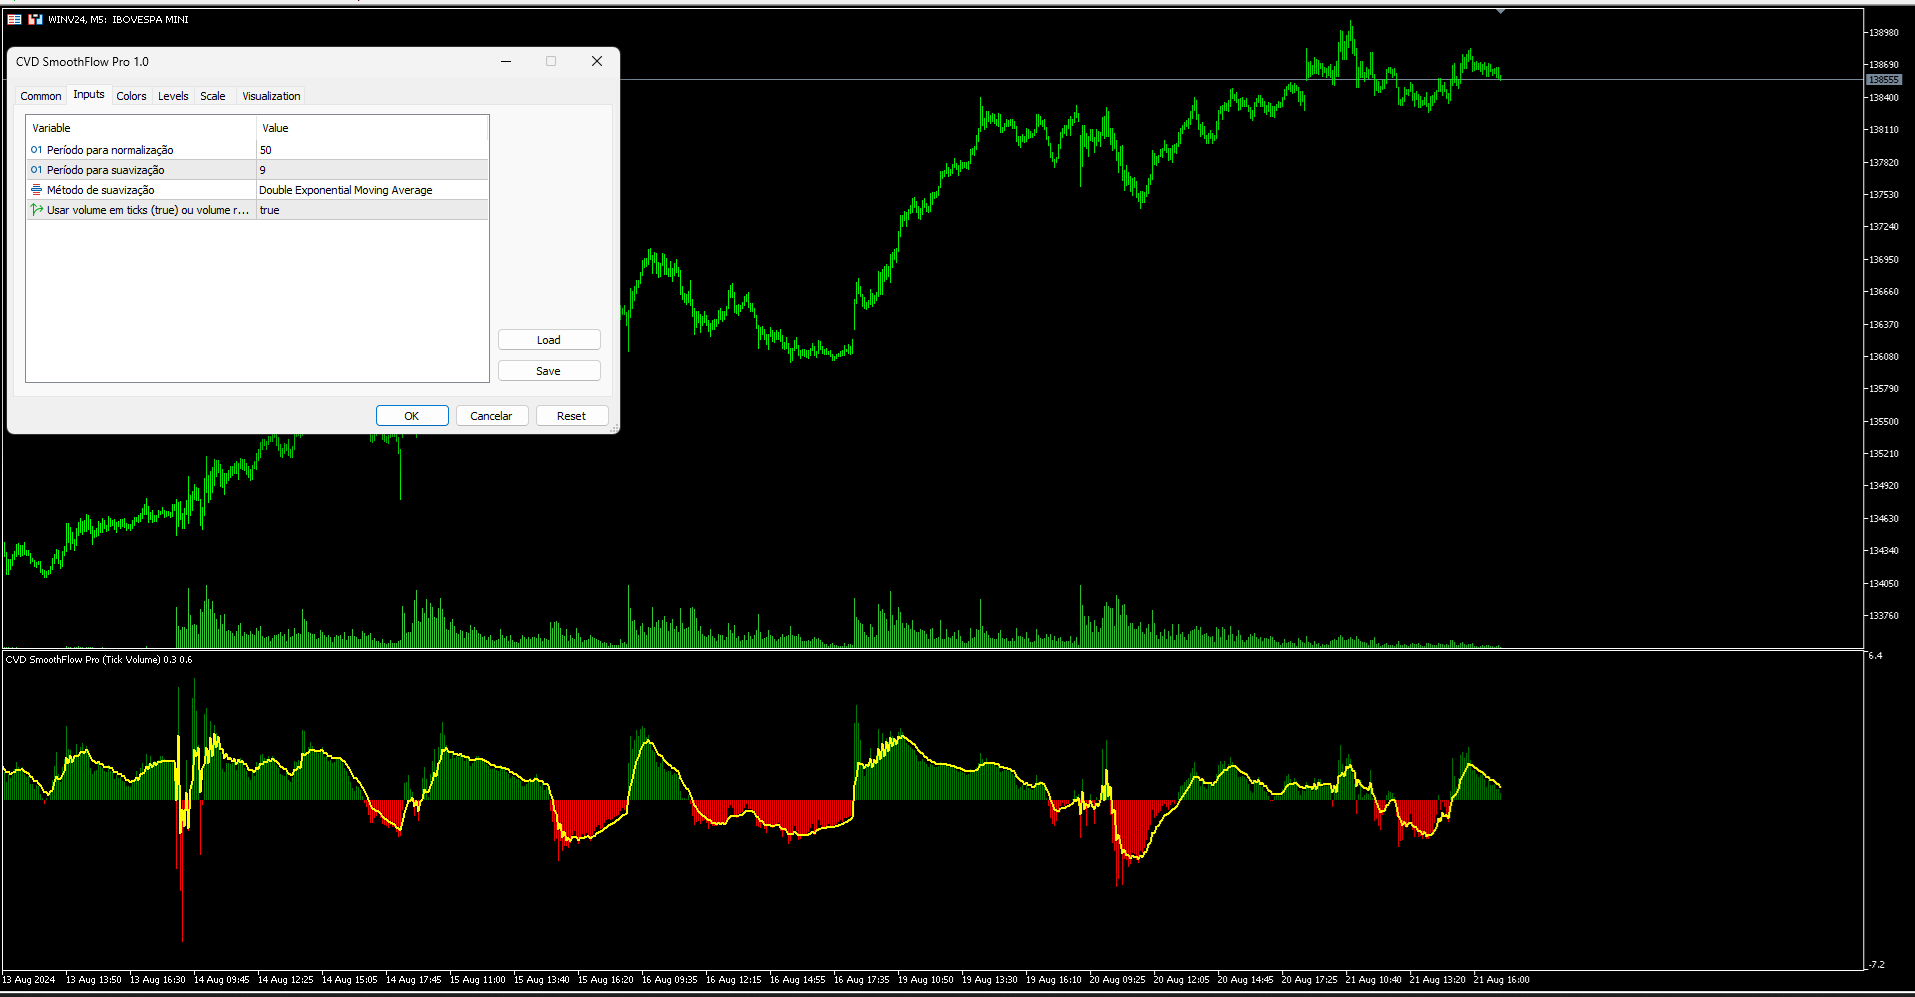
💡 Intuitive Interface: Provides accessible and efficient analysis with a clear presentation of data.

📈 Trend Identification: Identify market trends with confidence, aiding in informed decision-making.

💼 Practical Applications:

  • Monitor the balance between buyers and sellers in real time for any asset.
  • Spot trend reversals based on volume.
  • Focus on relevant movements with precise filtering in forex, indices, cryptocurrencies, and other assets.

🔓 Unlimited Pro Version!

The Pro Version offers unrestricted access to all features, allowing detailed and unlimited analysis across any financial asset.


Recommended products
Value Chart Candlesticks
Flavio Javier Jarabeck
4.7 (10)
The idea of a Value Chart indicator was presented in the very good book I read back in 2020 , " Dynamic Trading Indicators: Winning with Value Charts and Price Action Profile ", from the authors Mark Helweg and David Stendahl. The idea is simple and the result is pure genius: Present candlestick Price analysis in a detrended way! HOW TO READ THIS INDICATOR Look for Overbought and Oversold levels. Of course, you will need to test the settings a lot to find the "correct" one for your approach.
FREE
Weis Waves
Flavio Javier Jarabeck
3.15 (26)
The original author is David Weis, an expert in the Wyckoff Method. The Weis Wave is a modern adaptation of the 1930's Wyckoff Method, another expert in Tape Reading techniques and Chart Analysis. Weis Waves takes market volume and stacks it into waves according to price conditions giving the trader valuable insights about the market conditions. If you want to learn more about this subject you can find tons of videos in YouTube. Just look for "The Wickoff Method", "Weis Wave" and "Volume Spread
FREE
Aggression Volume
Flavio Javier Jarabeck
3.91 (22)
Aggression Volume Indicator is the kind of indicator that is rarely found in the MQL5 community because it is not based on the standard Volume data provided by the Metatrader 5 platform. It requires the scrutiny of all traffic Ticks requested on the platform... That said, Aggression Volume indicator requests all Tick Data from your Broker and processes it to build a very special version of a Volume Indicator, where Buyers and Sellers aggressions are plotted in a form of Histogram. Additionally,
FREE
This indicator allows you to enjoy the two most popular products for analyzing request volumes and market deals at a favorable price: Actual Depth of Market Chart Actual Tick Footprint Volume Chart This product combines the power of both indicators and is provided as a single file. The functionality of Actual COMBO Depth of Market AND Tick Volume Chart is fully identical to the original indicators. You will enjoy the power of these two products combined into the single super-indicator! Below is
Weis Wave Result MT5
Sant Clear Ali Costa
Features 3 types of waves: bullish, bearish and unknown. The unknown tower comes when prices move in opposite the direction of the current tower. Label that shows the percentage remaining for the next tower. Allows you set the type of volume that will be accumulated in the towers, either real or tick volumes. Thus, the indicator works in any market, for example: stocks, futures, forex, commodities, etc. Allows you to set the required score for the tower exchange. Allows you to set the font size
VP hidden
Emr Aljnaby
4.44 (9)
The indicator works to convert normal volume into levels and determine financial liquidity control points. It is very similar in function to Fixed Volume Profile. But it is considered more accurate and easier to use than the one found on Trading View because it calculates the full trading volumes in each candle and in all the brokers present in MetaTrade, unlike what is found in Trading View, as it only measures the broker’s displayed prices. To follow us on social media platforms: tel
FREE
Was: $249  Now: $99   Market Profile defines a number of day types that can help the trader to determine market behaviour. A key feature is the Value Area, representing the range of price action where 70% of trading took place. Understanding the Value Area can give traders valuable insight into market direction and establish the higher odds trade. It is an excellent addition to any system you may be using. Inspired by Jim Dalton’s book “Mind Over Markets”, this indicator is designed to suit the
Wapv Price and volume
Eduardo Da Costa Custodio Santos
The WAPV Price and Volume Indicator for MT5 is part of the ( Wyckoff Academy Wave Market ) and (Wyckoff Academy Price and Volume) toolset. The WAPV Price and Volume Indicator for MT5 was created to make it easy to visualize the volume movement on the chart in an intuitive way. With it you can observe the moments of peak volume and moments when the market has no professional interest Identify moments when the market is moving by inertia and not by movement of "smart money". It consists of 4 color
Segmented Volume MT5
Eduardo Da Costa Custodio Santos
The Segmented Volume MT5 indicator was created to facilitate those who trade using price and volume analysis, VSA, VPA, Wyckoff Method and Smart Money System . Segmented volume works on any Market ( Crypto, CFD, Forex, Futures, Stocks... ) and works on any Chart time. See how easy your interpretation is: #Green: Volume much higher than the market average #Dark pink: Larger than average volume #Blue: Positive normal volume #Red: Negative normal volume #Pink: Low volume #Yellow: Ultra Low Volume T
If you like this project, leave a 5 star review. Follow on TikTok: @quantum.trader       [ Any Symbol Can Be ADDED ]       DM me for adding any Pair symbol, crypto, index, stock or anything related. you can also DM me in TikTok [@quantum.trader] Works on [ EURUSD-GBPUSD-GBPJPY-USDJPY-XAUUSD ] This indicator calculate and draw the Prediction or Forecast the peaks of the current day ( forecast high - forecast low - forecast middle - forecast upper q - forecast lower q ) These are important
Do you use volume in your reading of the market? Certainly many traders use it, and do not imagine operating without it. The Color Histogram Volume Set indicator allows the user to choose the value that he considers interesting to monitor. When you pass this you will have visual confirmation and if you want you will also have the audible alert that is given by the indicator. Of course, there are other ways to try to find a high volume, such as assessing whether the volume
Volumes Direction MT5
William Oswaldo Mayorga Urduy
VOLUMES DIRECTION MT5 Normally the volume indicator has a default color change when the current volume is higher than the previous one, it is important but not very useful. For this reason, this indicator was created that in addition to the normal volume, when the candle is bullish or bearish, it paints them a different color, by default is blue for bullish and red for bearish, but these colors can be customized to the Trader's taste . Don't forget to check out my other indicators tha
VolumeDeltaBars
Stanislav Korotky
This indicator is a conventional analytical tool for tick volumes changes. It calculates tick volumes for buys and sells separately, and their delta on every bar, and displays volumes by price clusters (cells) within a specified bar (usually the latest one). The algorithm used internally is the same as in the indicator VolumeDeltaMT5 , but results are shown as cumulative volume delta bars (candlesticks). Analogous indicator for MetaTrader 4 exists - CumulativeDeltaBars . This is a limited substi
Volume by Price MT5
Brian Collard
3.6 (5)
The Volumebyprice.com Indicator for MetaTrader 5 features Volume Profile and Market Profile TPO (Time Price Opportunity). Volume and TPO histogram bar and line charts. Volume Footprint charts. TPO letter and block marker collapsed and split structure charts. Static, dynamic and flexible range segmentation and compositing methods with relative and absolute visualizations. Session hours filtering and segment concatenation with Market Watch and custom user specifications. Graphical layering, posit
Market Profile 3 ForexArby com
Hussien Abdeltwab Hussien Ryad
3.92 (13)
Market Profile 3 MetaTrader 5 indicator  version 4.70— is a classic Market Profile implementation that can show the price density over time, outlining the most important price levels, value area, and control value of a given trading session. This indicator can be attached to timeframes between M1 and D1 and will show the Market Profile for daily, weekly, monthly, or even intraday sessions. Lower timeframes offer higher precision. Higher timeframes are recommended for better visibility. It is als
FREE
Waves PRO
Flavio Javier Jarabeck
For those who appreciate Richard Wyckoff approach for reading the markets, we at Minions Labs designed a tool derived - yes, derived, we put our own vision and sauce into this indicator - which we called Waves PRO . This indicator provides a ZigZag controlled by the market volatility (ATR) to build its legs, AND on each ZigZag leg, we present the vital data statistics about it. Simple and objective. This indicator is also derived from the great book called " The Secret Science of Price and Volum
Golden Limit
Renato Fridschtein
There are no limits! Golden Limit is the ultimate indicator to get clear and easy readings of price movements on charts. It projects support and resistance ranges, calculated by statistical models involving Price Action and the Fibonacci sequence, revealing in advance the behavior of prices and the best places to trade and not to trade. It also has two moving averages to help choose the best entries. The Golden Limit method was created from a proven model. In summary: We use the names of preci
BoxInside MT5
Evgeny Shevtsov
5 (4)
This indicator calculates the volume profile and places labels that correspond to the VAH, VAL and POC levels, for each candle individually. Indicator operation features The indicator works on the timeframes from M3 to MN, but it uses the history data of smaller periods: M1 - for periods from M3 to H1, M5 - for periods from H2 to H12, M30 - for the D1 period, H4 - for the W1 period, D1 - for the MN period. The color and location of the VAL, VAH and POC labels on the current candle are consider
FREE
The VWAP indicator is our version of the popular Volume-Weighted Average Price indicator. The VWAP is the ratio between the value traded (price multiplied by the number of volume traded) and the total volume traded over a specific time period. As a result, it measures the average price of the instrument much better than the simple moving average. Although there are many ways to use the VWAP, most investors use it to calculate the daily average.  The indicator works in five modes: Moving  - In
The indicator builds current quotes, which can be compared with historical ones and on this basis make a price movement forecast. The indicator has a text field for quick navigation to the desired date. Options: Symbol - selection of the symbol that the indicator will display; SymbolPeriod - selection of the period from which the indicator will take data; IndicatorColor - indicator color; Inverse - true reverses quotes, false - original view; Next are the settings of the te
A countdown timer for the  Volume bar chart generator  and  Tick chart generator  products, which are available for download from the MQL5 Market: Tick chart generator: https://www.mql5.com/en/market/product/29215 Volume bar chart generator: https://www.mql5.com/en/market/product/47197 The counter conveniently displays the number of ticks or transactions (depending on the chart) that need to pass for a new bar to start printing. The user can set the following indicator inputs. Volume type
FREE
FRB Support and Resistance
Fernando Baratieri
5 (2)
FRB Trader - Our mission is to provide the best support to customers through conted and tools so that they can achieve the expected results FRB Support and Resistance - Indicator places lines on the chart to show Support and Resistance regions. - You can choose the timeframe you want to calculate, as well as the colors of the lines. - Algorithm calculates the points where the strengths of the asset are considered and are extremely important for decision making.
FREE
BoxChart MT5
Evgeny Shevtsov
5 (7)
The market is unfair if only because 10% of participants manage 90% of funds. An ordinary trader has slim changes to stand against these "vultures". This problem can be solved. You just need to be among these 10%, learn to predict their intentions and move with them. Volume is the only preemptive factor that faultlessly works on any timeframe and symbol. First, the volume appears and is accumulated, and only then the price moves. The price moves from one volume to another. Areas of volume accumu
UPD1 Profile Levels MT5
Vitaliy Kuznetsov
5 (3)
The indicator finds the levels of the maximum and minimum price volume (market profile) on the working histogram for the specified number of bars.  Composite profile . The height of the histogram is fully automatic and adapts to any instrument and timeframe. The author's algorithm is used and does not repeat well-known analogues. The height of the two histograms is approximately equal to the average height of the candle. Smart alert will help you to inform about the price concerning the volume l
VolumeProfile MT5
Robert Hess
3.75 (8)
Description: The Volume Profile displays detailed informations of historical trading activities at certain price levels (Market Profile). Locate the areas with the best prices in the market and get an advantage over other market participants. Features: Customizable Market Profile Shows the "fair" Value Area with 70% of all Volume Shows critical low volume zones Shows VPOC, VAL and VAH Points integrated resource management to reduce the load while working with multiple charts Works on all tim
Blahtech Supply Demand MT5
Blahtech Limited
4.54 (13)
Was: $299  Now: $99   Supply Demand uses previous price action to identify potential imbalances between buyers and sellers. The key is to identify the better odds zones, not just the untouched ones. Blahtech Supply Demand indicator delivers functionality previously unavailable on any trading platform. This 4-in-1 indicator not only highlights the higher probability zones using a multi-criteria strength engine, but also combines it with multi-timeframe trend analysis, previously confirmed swings
WAPV Weis Wave Chart Forex
Eduardo Da Costa Custodio Santos
The Weis Wave Chart Forex for MT5 is a Price and Volume indicator. The Price and Volume reading was widely disseminated through Richard Demille Wyckoff based on the three laws created by him: Supply and Demand, Cause and Effect and Effort vs. Result. In 1900 R.Wyckoff already used the wave chart in his analyses. Many years later, around 1990, David Weis Automated R. Wyckoff's wave chart and today we bring you the evolution of David Weis' wave chart. It shows the amount of Volume and the amount o
Donchian Pro
Paulo Henrique Faquineli Garcia
5 (2)
The Donchian Channel Channels are among the most popular tools of technical analysis, as they visually convey to the analyst the limits within which most price movement tends to occur. Channel users know that valuable information can be obtained at any time, whether prices are in the central region of a band or close to one of the border lines. One of the best known techniques to explore these concepts is Bollinger Bands. However, John Bollinger was not the only one to research the applicatio
FREE
Mini Chart Indicators
Flavio Javier Jarabeck
The Metatrader 5 has a hidden jewel called Chart Object, mostly unknown to the common users and hidden in a sub-menu within the platform. Called Mini Chart, this object is a miniature instance of a big/normal chart that could be added/attached to any normal chart, this way the Mini Chart will be bound to the main Chart in a very minimalist way saving a precious amount of real state on your screen. If you don't know the Mini Chart, give it a try - see the video and screenshots below. This is a gr
No Demand No Supply MT5
Trade The Volume Waves Single Member P.C.
No Demand No Supply   This indicator identifies   No Demand –No Supply candles to your chart and plots volume bars colored according to the signal. It can be applied to all timeframes or to a specific one only. It can also be used as regular volume indicator  with exceptional future of WEIGHTED VOLUME. Furthermore is has an alert notification, sound and email when a signals occurs. The indicator does not repaint but the alert will come on two candles back due to the definition of No Demand No Su
Buyers of this product also purchase
Atomic Analyst MT5
Issam Kassas
4.79 (19)
First of all Its worth emphasizing here that this Trading Indicator is   Non-Repainting   , Non Redrawing and Non Lagging Indicator   Indicator, Which makes it ideal from both manual and robot trading.  User manual: settings, inputs and strategy . The Atomic Analyst  is a PA Price Action Indicator that uses Strength and Momentum of the price to find a better edge in the market. Equipped with Advanced filters which help remove noises and false signals, and Increase Trading Potential. Using Mult
First of all Its worth emphasizing here that this Trading System is Non-Repainting   , Non Redrawing and Non Lagging Indicator Which makes it ideal from both manual and robot trading .  Online course, manual and download presets. The Smart Trend Trading System MT5 is a comprehensive trading solution tailored for new and experienced traders . It combines over 10 premium indicators and features more than 7 robust trading strategies , making it a versatile choice for diverse market conditions . Tre
TPSproTREND PrO MT5
Roman Podpora
4.89 (9)
TPSpro TREND PRO  - is a trend indicator that automatically analyzes the market and provides information about the trend and each of its changes, as well as giving signals for entering trades without redrawing! The indicator uses each candle, analyzing them separately. referring to different impulses - up or down impulse. Exact entry points into transactions for currencies, crypto, metals, stocks, indices!  Version MT4               DETAILED DESCRIPTION               R ecommended to use with an
TPSpro RFI Levels MT5
Roman Podpora
4.67 (9)
Reversal First Impulse levels (RFI)      INSTRUCTIONS        RUS       -       ENG              R ecommended to use with an indicator   -   TPSpro  TREND PRO -  Version MT4                 A key element in trading is zones or levels from which decisions to buy or sell a trading instrument are made. Despite attempts by major players to conceal their presence in the market, they inevitably leave traces. Our task was to learn how to identify these traces and interpret them correctly. Main functi
Top indicator for MT5   providing accurate signals to enter a trade without repainting! It can be applied to any financial assets:   forex, cryptocurrencies, metals, stocks, indices .  Watch  the video  (6:22) with an example of processing only one signal that paid off the indicator! MT4 version is here It will provide pretty accurate trading signals and tell you when it's best to open a trade and close it. Most traders improve their trading results during the first trading week with the help of
Quantum Trend Sniper
Bogdan Ion Puscasu
4.92 (48)
Introducing   Quantum Trend Sniper Indicator , the groundbreaking MQL5 Indicator that's transforming the way you identify and trade trend reversals! Developed by a team of experienced traders with trading experience of over 13 years,   Quantum Trend Sniper Indicator   is designed to propel your trading journey to new heights with its innovative way of identifying trend reversals with extremely high accuracy. ***Buy Quantum Trend Sniper Indicator and you could get Quantum Breakout Indicator fo
FX Power MT5 NG
Daniel Stein
5 (6)
Trading GOLD, and currencies, with the dog walk strategy  - super smart Trading GOLD, and currencies, with the breakout strategy  - super easy Visit our all-new   Stein Investments Welcome Page   to get the latest information, updates and trading strategies. FX Power MT5 NG  is the next generation of our long-time very popular currency strength meter, FX Power.  And what does this next-generation strength meter offer? Everything you have loved about the original FX Power  PLUS GOLD/XAU st
FX Volume MT5
Daniel Stein
4.94 (17)
Visit our all-new   Stein Investments Welcome Page   to get the latest information, updates and trading strategies. FX Volume is the FIRST and ONLY volume indicator that provides a REAL insight into the market sentiment from a broker's point of view. It provides awesome insights into how institutional market participants, like brokers, are positioned in the Forex market, much faster than COT reports. Seeing this information directly on your chart is the real game-changer and breakthrough solut
XQ Indicator MetaTrader 5
Marzena Maria Szmit
3.5 (2)
Step into the realm of Forex trading with confidence and precision using XQ, a cutting-edge Forex indicator designed to elevate your trading game to unprecedented heights. Whether you're a seasoned trader or just stepping into the world of currency exchange, XQ Forex Indicator empowers you with the insights and signals needed to make informed trading decisions. The signal conditions are a combination of three indicators, and XQ Forex Indicator only display  medium and long-term trends . The ind
This dashboard shows the latest available   harmonic patterns   for the selected symbols, so you will save time and be more efficient /   MT4 version . Free Indicator:   Basic Harmonic Pattern Indicator columns Symbol:  the selected symbols will appear Trend:   bullish or bearish Pattern:  type of pattern (gartley, butterfly, bat, crab, shark, cypher or ABCD) Entry:  entry price SL:  stop loss price TP1:   1st take profit price TP2:  2nd take profit price TP3:  3rd take profit price Current
TrendMaestro5
Stefano Frisetti
note: this indicator is for METATRADER4, if you want the version for METATRADER5 this is the link:  https://www.mql5.com/it/market/product/108106 TRENDMAESTRO ver 2.4 TRENDMAESTRO recognizes a new TREND in the bud, he never makes mistakes. The certainty of identifying a new TREND is priceless. DESCRIPTION TRENDMAESTRO identifies a new TREND in the bud, this indicator examines the volatility, volumes and momentum to identify the moment in which there is an explosion of one or more of these data a
Gartley Hunter Multi
Siarhei Vashchylka
5 (8)
Gartley Hunter Multi - An indicator for searching for harmonic patterns simultaneously on dozens of trading instruments and on all possible timeframes. Manual (Be sure to read before purchasing) | Version for MT4 Advantages 1. Patterns: Gartley, Butterfly, Shark, Crab. Bat, Alternate Bat, Deep Crab, Cypher 2. Simultaneous search for patterns on dozens of trading instruments and on all possible timeframes 3. Search for patterns of all possible sizes. From the smallest to the largest 4. A
PZ Support Resistance MT5
PZ TRADING SLU
4.17 (6)
Unlock key market insights with automated support and resistance lines Special Offer: Purchase now to receive free bonuses worth $89! (Read more for details) Tired of plotting support and resistance lines? This is a multi-timeframe indicator that detects and plots supports and resistance lines in the chart with the same precision as a human eye would. As price levels are tested over time and its importance increases, the lines become thicker and darker, making price leves easy to glance and ev
Volatility Trend System - a trading system that gives signals for entries. The volatility system gives linear and point signals in the direction of the trend, as well as signals to exit it, without redrawing and delays. The trend indicator monitors the direction of the medium-term trend, shows the direction and its change. The signal indicator is based on changes in volatility and shows market entries. The indicator is equipped with several types of alerts. Can be applied to various trading in
Gold TMAF MTF  - this is a best stock technical indicator. The indicator algorithm analyzes the price movement of an asset and reflects volatility and potential entry zones. The best indicator signals: For SELL = red upper boundary of TMA2 above the red upper boundary of TMA1 + red fractal indicator above + yellow SR signal arrow in the same direction. For BUY = blue lower boundary of TMA2 below the blue lower boundary of TMA1 + blue fractal indicator from below + aqua SR signal arrow in the s
Automated Trendlines MT5
Georgios Kalomoiropoulos
Trendlines  are the most essential tool of technical analysis in forex trading.  Unfortunately, most  traders don’t draw them correctly. Automated Trendlines indicator is a professional tool for serious traders that help you visualize the trending movement of the markets . AMAZING OFFER --> Activations from 5 to 20 for "MTF Supply Demand Zones" and "Automated Trendlines" There are two types of Trendlines Bullish Trendlines and Bearish Trendlines. In the uptrend, Forex trend line is drawn th
TPA True Price Action indicator reveals the true price action of the market makers through 100% non-repainting signals strictly at the close of a candle! TPA shows entries and re-entries, every time the bulls are definitely stronger than the bears and vice versa. Not to confuse with red/green candles. The shift of power gets confirmed at the earliest stage and is ONE exit strategy of several. There are available now two free parts of the TPA User Guide for our customers. The first "The Basics"
Introducing   Quantum Breakout PRO , the groundbreaking MQL5 Indicator that's transforming the way you trade Breakout Zones! Developed by a team of experienced traders with trading experience of over 13 years,   Quantum Breakout PRO   is designed to propel your trading journey to new heights with its innovative and dynamic breakout zone strategy. Quantum Breakout Indicator will give you signal arrows on breakout zones with 5 profit target zones and stop loss suggestion based on the breako
If you want to find good trading opportunities, then you must trade near the Trend Line. This allows you to have a tighter         stop loss   on your trades — which improves your       risk to reward . But that’s not all… Because if you combine Trend Line with Support and Resistance, that’s where you find the best trading opportunities. Now you might wonder: “So when do I enter a trade?” Well, you can use reversal     candlestick patterns   (like the   Hammer, Bullish Engulfing, etc.) as your e
Owl Smart Levels MT5
Sergey Ermolov
4.31 (39)
MT4 version  |   FAQ The Owl Smart Levels Indicator is a complete trading system within the one indicator that includes such popular market analysis tools as Bill Williams' advanced fractals , Valable ZigZag which builds the correct wave structure of the market, and Fibonacci levels which mark the exact levels of entry into the market and places to take profits. Detailed description of the strategy Instructions for working with the indicator Advisor-assistant in trading Owl Helper Private User
Gold ATR MTF - this is a fine stock technical indicator.  The algorithm of the indicator ATR (Average True Range) analyses the movement of the asset price and reflects volatility by drawing the corresponding levels in specified percentages (%) of the opening price of the specified timeframe (D1). Indicators (red and/or blue D1 H4) of the symbol price movement direction and arrow signals are additional and essential aids for comfortable and profitable intraday trading and/or scalping. Daily profi
Our innovative   Basic Candlestick Patterns Dashboard   is specifically designed to identify profitable candlestick patterns on the chart automatically. This dashboard uses advanced algorithms to scan price charts in real time and detect a wide range of candlestick patterns, from classic to complex. In addition, it has an easy-to-use interface that allows you to visualize the detected patterns on different time frames, making it easy to make informed decisions /   MT4 version Free indicator:  B
Elliot Waves Analyzer Pro
Viktor Weidenthal
3.25 (4)
Elliot Waves Analyzer Pro calculates Elliot Waves to Help Identify Trend direction and Entry Levels. Mainly for Swing Trading Strategies. Usually one would open a Position in trend direction for Wave 3 or a Correction for Wave C . This Indicator draws Target Levels for the current and next wave. Most important Rules for Elliot Wave Analysis are verified by the Indicator.  The Pro version analyzes Multiple Timeframes and shows the Subwaves and Target-Levels.   For an Overview  " Elliot Waves Anal
Bill Williams Advanced
Siarhei Vashchylka
5 (7)
Bill Williams Advanced is designed for automatic chart analysis using Bill Williams' "Profitunity" system. The indicator analyzes four timeframes at once. Manual (Be sure to read before purchasing) Advantages 1. Automatically analyzes the chart using the "Profitunity" system of Bill Williams. The found signals are placed in a table in the corner of the screen. 2. Equipped with a trend filter based on the Alligator indicator. Most of the system signals are recommended to be used only accordi
Trend Master Pro MT5
Tatiana Zyrianova
4.67 (3)
MT5 trend indicator with a probability of reaching a profit of 70-90%! Works without redrawing and delays. Trend Master PRO shows good results on all trading instruments: currencies, metals, indices, stocks, cryptocurrencies. Recommended timeframe: H1-H4. More information about the indicator is here :  https://www.mql5.com/en/blogs/post/744748 Recommendations for use Use automatic period detection           The main feature of the indicator is the self-optimization function.             Th
Trade smarter, not harder: Empower your trading with Harmonacci Patterns Special Offer: Purchase now to receive free bonuses worth $165! (Read more for details) This is arguably the most complete harmonic price formation auto-recognition indicator you can find for the MetaTrader Platform. It detects 19 different patterns, takes fibonacci projections as seriously as you do, displays the Potential Reversal Zone (PRZ) and finds suitable stop-loss and take-profit levels. [ Installation Guide | Up
Advanced Supply Demand MT5
Bernhard Schweigert
4.53 (15)
Best Solution for any Newbie or Expert Trader! This indicator is a unique, high quality and affordable trading tool because we have incorporated a number of proprietary features and a new formula. With this update, you will be able to show double timeframe zones. You will not only be able to show a higher TF but to show both, the chart TF, PLUS the higher TF: SHOWING NESTED ZONES. All Supply Demand traders will love it. :) Important Information Revealed Maximize the potential of Advanced Suppl
PipFinite Trend PRO MT5
Karlo Wilson Vendiola
4.87 (666)
Breakthrough Solution For Trend Trading And Filtering With All Important Features Built Inside One Tool! Trend PRO's smart algorithm detects the trend, filters out market noise and gives entry signals with exit levels. The new features with enhanced rules for statistical calculation improved the overall performance of this indicator. Important Information Revealed Maximize the potential of Trend Pro, please visit www.mql5.com/en/blogs/post/713938 The Powerful Expert Advisor Version Automa
Trend Forecaster
Alexey Minkov
5 (6)
The Trend Forecaster indicator utilizes a unique proprietary algorithm to determine entry points for a breakout trading strategy. The indicator identifies price clusters, analyzes price movement near levels, and provides a signal when the price breaks through a level. The Trend Forecaster indicator is suitable for all financial assets, including currencies (Forex), metals, stocks, indices, and cryptocurrencies. You can also adjust the indicator to work on any time frames, although it is recommen
AT Forex Indicator MT5
Marzena Maria Szmit
5 (4)
The AT Forex Indicator MT5 is a sophisticated trading tool designed to provide traders with a comprehensive analysis of multiple currency pairs. This powerful indicator simplifies the complex nature of the forex market, making it accessible for both novice and experienced traders. AT Forex Indicator uses advanced algorithms to detect trends, patterns and is an essential tool for traders aiming to enhance their forex trading performance. With its robust features, ease of use, and reliable signal
More from author
AI Channel
Thalles Nascimento De Carvalho
4 (4)
Welcome to the presentation of the AI Channel indicator, a powerful tool that uses artificial intelligence for price channel analysis in the financial market. In this session, we will explore how this revolutionary indicator can assist investors and traders in making more informed and strategic decisions. Let's get started! I. What is the AI Channel indicator? AI Channel is an indicator developed based on advanced artificial intelligence algorithms. It utilizes historical price data of financial
FREE
Master OBV FX
Thalles Nascimento De Carvalho
5 (1)
MasterOBV: Master Market Trends with Precision! The MasterOBV is a technical analysis indicator that combines volume , positive correlation , and a Moving Average (MA) to refine trend identification in financial markets. Key Features: Smart Volume: Analyzes trading volume to identify significant changes in trend strength. Positive Correlation: Incorporates correlated assets for a broader and more accurate view, reinforcing the potential for price displacement based on pair volume.
FREE
Long Short
Thalles Nascimento De Carvalho
4.67 (3)
Long & Short Indicator: The Ultimate Tool for Market Movement Analysis High Hit Rate with Real-Time Information Track asset movements with high accuracy and base your decisions on up-to-date data. ️ Safer Trade Entries Leverage positive and negative correlations to make more secure and informed trade entries. Facilitates Short and Long-Term Reading Ideal for both short and long-term strategies, adapting to your trading needs. Alert Option for Specific Levels Enable alerts
FREE
CVD SmoothFlow
Thalles Nascimento De Carvalho
CVD SmoothFlow - Simplify Volume Analysis with Precision for BTCUSD! CVD SmoothFlow is a technical indicator developed specifically for traders operating the BTCUSD pair. Using Cumulative Volume Delta (CVD) calculation, it applies advanced noise filtering, providing a clear and accurate market reading. What does CVD SmoothFlow offer? Clear Analysis: Filters market noise, allowing you to focus on the most relevant and significant volume movements. ️ Precise Calculation: Monitors the differ
FREE
Swing Point Volume
Thalles Nascimento De Carvalho
Swing Point Volume, the indicator that signals weakness and strength at the tops and bottoms. This indicador can be for used the Wyckoff Method. Information provided; - Swing on customized ticks. - Volume and points in each balance sheet. - Percentage of Displacement. - Sound alert option on top and bottom breaks. - Volume in ticks and Real Volume. - Volume HL (extreme) or (opening and closing) - Customized volume shapes.
Atr Projection
Thalles Nascimento De Carvalho
The ATR Projection Indicator stands out as a robust tool in technical analysis, designed to provide accurate insights into potential price movement limits in the financial market. Its flexible approach allows users to customize analysis metrics intuitively, adapting to the specific needs of each traded asset. Customizable Operation: By default, the ATR Projection operates considering 30% of the average of the last 100 candles. This flexibility enables users to adjust metrics according to t
Box Weis Wave
Thalles Nascimento De Carvalho
5 (1)
Elevate Your Analysis with the Weis Wave Box! If you’re looking for precision and clarity in your trading, the Weis Wave Box is the tool you need. This advanced indicator offers a detailed visual analysis of volume waves and swing points, helping you better understand the relationship between effort and results in the market. Key Features of the Weis Wave Box: Customizable Volume Waves: Adjust volume waves in ticks to fit your trading strategies. Adjustable History: Focus on specific
Long Short Pro
Thalles Nascimento De Carvalho
Long & Short Indicator - Pro Version: Unlock Unlimited Market Analysis Potential! No Restrictions for Any Asset The Pro version of the Long & Short Indicator offers complete freedom to use it on any financial asset. No more limits - apply the same indicator to all your favorite assets! No Restrictions Enjoy all the features of the indicator with no limitations. The Pro version provides a full, unrestricted experience, allowing you to maximize every market opportunity. Pro Versi
Reversal Vol Propagation
Thalles Nascimento De Carvalho
Are you tired of missing out on trading opportunities by not being able to identify price reversals in time? Do you want to maximize your profits and make informed trading decisions? Introducing the Reversal Vol Propagation Indicator, the revolutionary tool that uses neural networks and volume data to predict potential price reversals. Based on a powerful combination of advanced algorithms and cutting-edge technology, the Reversal Vol Propagation meticulously analyzes volume patterns and past pr
Didi Index Volume
Thalles Nascimento De Carvalho
Introducing the Didi Index Volume, a technical analysis indicator developed by Brazilian trader Odir Aguiar, which stands out for its advanced and powerful approach in identifying opportunities in the financial market. Available on various platforms, the Didi Index Volume has become an essential tool for traders seeking precise insights and valuable information for their trading strategies. The indicator combines the renowned Didi Index, created by Odir Aguiar, with intelligent use of trading v
Smart Binary Volume
Thalles Nascimento De Carvalho
The Smart Binary Volume indicator is a versatile tool that combines trading volume analysis with machine learning. It can be applied to various markets and strategies, including scalping and other short-term trading approaches. Using advanced machine learning algorithms, the indicator identifies complex patterns, generating more precise buy and sell signals. Usage tips: 1. Attention when the lines are opposite: Pay attention to situations where the lines of the Smart Binary Volume indicato
TimeChannel
Thalles Nascimento De Carvalho
The "Timechannel" is a powerful technical analysis tool designed specifically for traders who want to gain deeper and more accurate insights into price movements across multiple timeframes (multi-timeframe). This indicator is an essential addition to the toolbox of any serious trader seeking to make informed and data-driven trading decisions. Key Features: Advanced Multi-Timeframe Analysis : Timechannel allows traders to analyze price movements on different timeframes simultaneously. This is cr
DeltaBook
Thalles Nascimento De Carvalho
The Delta Book indicator is a powerful market analysis tool that combines the use of volume delta with information from the order book to detect price flow in financial markets such as stocks, futures, and cryptocurrencies. It is important to note that the Delta Book requires access to real-time volume data and order book information to realize its full potential. The main feature of the Delta Book is its advanced market analysis strategy, which allows traders and investors to identify trends an
Big Player Range
Thalles Nascimento De Carvalho
5 (2)
Discover the Power of "BigPlayerRange": Your Ally in Market Technical Analysis Introducing BigPlayerRange , an advanced technical analysis tool designed to reveal institutional interest areas in the market. With it, you'll precisely identify where major players are actively engaged and how this can impact your trading strategies. Key Features: Mapping Institutional Interest Areas : BigPlayerRange highlights zones of high institutional activity, providing valuable insights into potential m
Master OBV
Thalles Nascimento De Carvalho
MasterOBV: Master Market Trends with Precision! The MasterOBV is a technical analysis indicator that combines volume , positive correlation , and a Moving Average (MA) to refine trend identification in financial markets. Key Features: Smart Volume: Analyzes trading volume to identify significant changes in trend strength. Positive Correlation: Incorporates correlated assets for a broader and more accurate view, reinforcing the potential for price displacement based on pair volume.
Smart Delta Volume
Thalles Nascimento De Carvalho
Smart Delta Volume: Precise and Adaptable to Dynamic Market Conditions The Smart Delta Volume is an advanced technical indicator designed to offer precise and adaptable analysis in the face of constant market changes. By utilizing dynamic levels that automatically adjust to volatility, this indicator provides a more comprehensive and reliable view of the interplay between volume flow and price action. This adaptability is crucial for traders seeking quick and accurate insights, especially in
VolaMetrics VSA
Thalles Nascimento De Carvalho
VolaMetrics VSA | A Powerful Ally in Technical Analysis The VolaMetrics VSA is a technical analysis indicator that combines the Volume Spread Analysis (VSA) methodology with detailed analysis of trading volume . Designed to identify and track significant price movements , VolaMetrics VSA uses the interaction between volume and price spread to provide valuable insights that can aid in trading decisions. Fundamentals of Volume Spread Analysis (VSA) Volume Spread Analysis (VSA) is a respected
SwingVolumePro
Thalles Nascimento De Carvalho
Overview The SwingVolumePro is an advanced and versatile indicator, designed to be applied to a wide range of financial assets and support different trading styles. Developed based on rigorous volume and price analysis, it offers clear and precise signals that allow traders of all levels to make informed decisions based on high-quality data. Key Features Versatility: SwingVolumePro can be applied to various assets, including stocks, forex, cryptocurrencies, and more. It is suitable for
Filter:
No reviews
Reply to review