• Overview
  • Reviews
  • Comments
  • What's new

Sense

SENSE is an automated fusion of selected GANN methods combined with fractal calculations.

The system tells us where to open and close our trades.

No more wasting time on complex calculations—SENSE does it all for you. Just insert the indicator.

Key Principles:

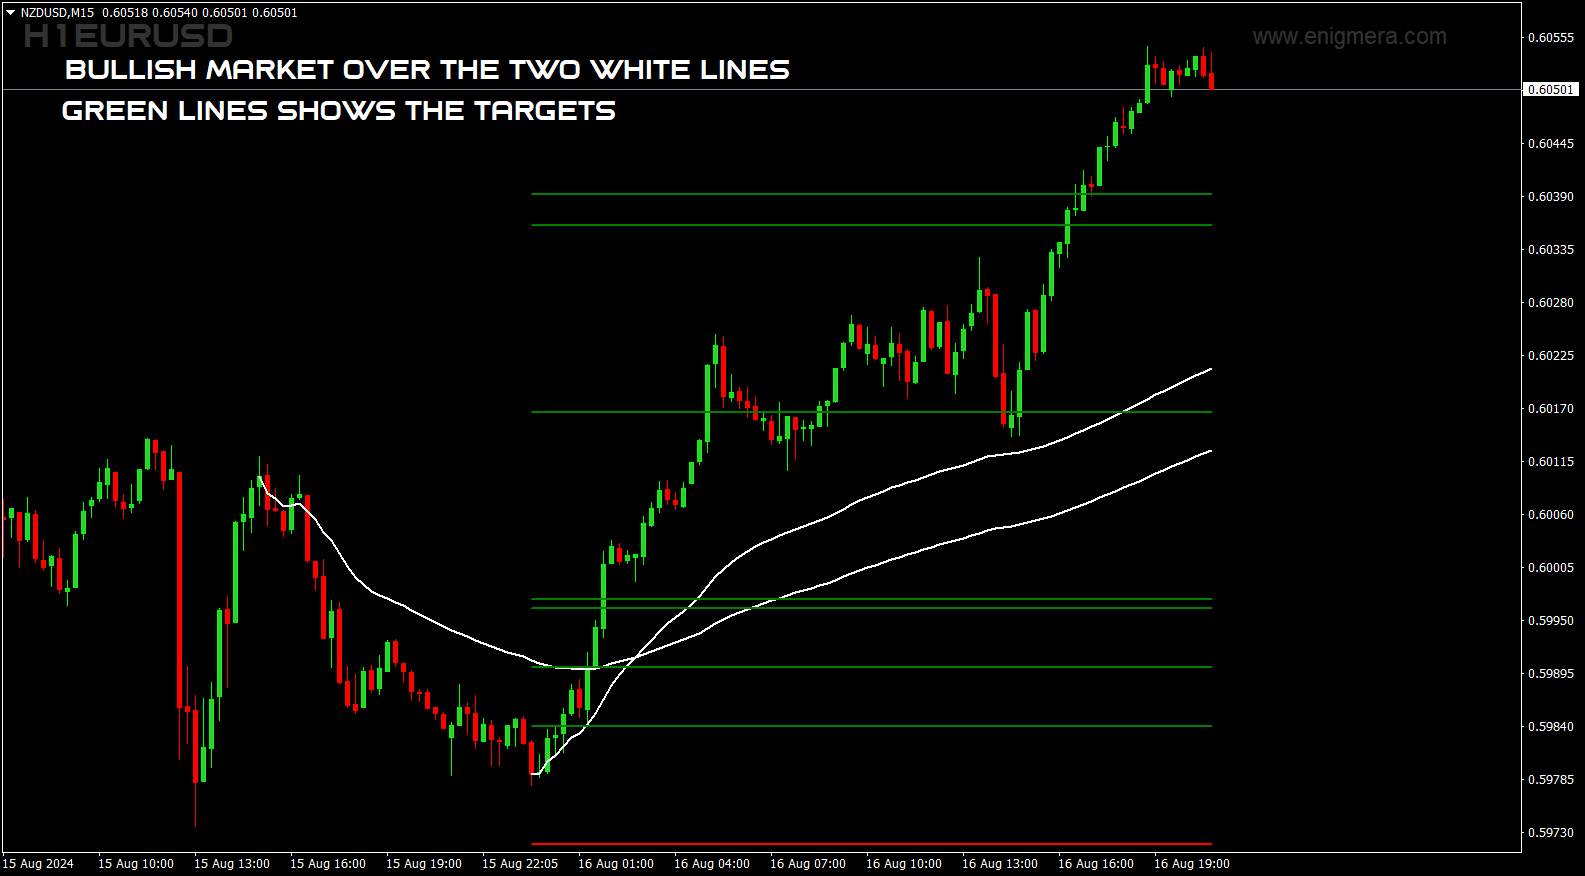
Market is bullish when price is above the white lines
- Buy above the white lines, stop below
- Green lines are bullish targets

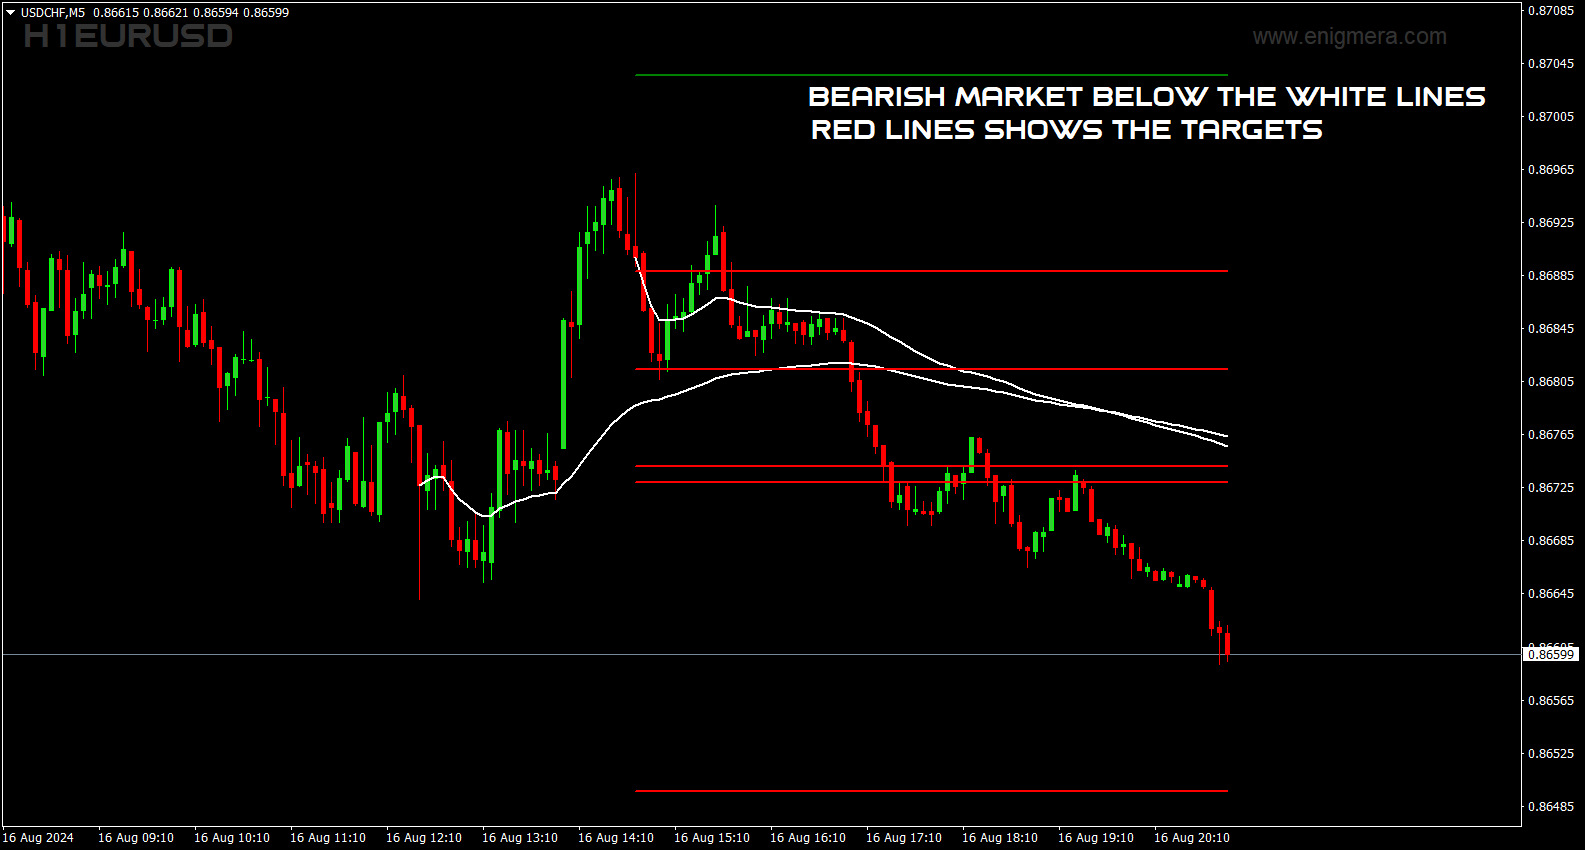
Market is bearish when price is below the white lines
- Sell below the white lines, stop above
- Red lines are bearish targets

Double green or red lines indicate a stronger area.


Why SENSE:

Profit targets: SENSE automatically gives you targets for taking profit, helping you maximize your trading success.

Automatic adaptation: The indicator automatically recalculates for any timeframe, providing accurate and reliable signals without the need for manual adjustments.

Great for scalping too.

Check the demo!


Recommended products
Deal Trading SPT
Sukunthakan Ngernbamrung
Deal Trading SPT (Super Trend) is an indicator, shows the market trend direction, entry position, take profit level, stop loss level and trend strength. Utility Help to further filter and develop strategy to trade Market overview on the chart Stop loss and take profit calculation with market volatility Resistance and support for trialing stop No repaint after the finished bar Works in any timeframe and financial instrument, including forex, CFD and crypto etc. Message pop-up, notification wi
This indicator is a perfect wave automatic analysis indicator for practical trading! 黄金实战 案例... The standardized definition of the band is no longer a wave of different people, and the art of man-made interference is eliminated, which plays a key role in strict analysis of the approach. Increase the choice of international style mode, (red fall green rise style) The  purchase discount is currently in progress! Using this indicator is equivalent to enhancing the aesthetics of the trading in
Introduction This indicator detects volume spread patterns for buy and sell opportunity. The patterns include demand and supply patterns. You might use each pattern for trading. However, these patterns are best used to detect the demand zone (=accumulation area) and supply zone (=distribution area). Demand pattern indicates generally potential buying opportunity. Supply pattern indicates generally potential selling opportunity. These are the underlying patterns rather than direct price action. T
Trend Line Chart Pattern Signals  Is a traders Tool for Signals based on Strong  Patterns Formed By a pair of robust trend lines. They FOR WITH DIFFERENT POPULAR PATTERNS ON CHARTS LIKE – TRIANGLES, FLAGS,RANGE , ASCENDING TRIANGLES, DESCENDING PATTERNS, PENNANTS ETC. The TREND LINES  form  dynamically  on running bars. The  sensitivity  of the trend lines can be changed by custom settings. The  Buy and Sell Signals Generate upon Break Of the Trend Line + "Close" of the same bar above the previo
If you are using volume spread analysis, whether your are a beginner or an expert, this system will give you a lot of features and help in your analysis. Please watch the video to see all the features. Features With one click you will find all the VSA patterns on your chart . Bars without opening price. Easy to read volume indicator. Bar reader (Bar type - Close type - Volume type - Spread type). Daily and weekly levels (Pivot - Camarilla - Fibo). Very light on the trading platform and moving
Accurate Buy sell Levels are the fully automated and purely work's on the basis of the Daily Opening  weekly Opening and the Monthly Opening Prices. we don't want to do any analysis and other planning for Intraday or Swing we need to focus only when price approaches near the levels we can add other price action confluence's (Inside Bar's , Bullish / Bearish Engulfing pattern's , SND , Order Blocks ... and so on ) for strong Buy or Sell Confirmation's.  Very simple and Easy to Follow system. We c
Elliott Wave Counter is a panel for rapid and user-friendly manual markup of Elliott waves. One can select a color and a level of marks. There are also functions for removing the last markup and the entire markup made by the tool. Markup is made in one click. Click five times - have five waves! Elliott Wave Counter will be a great instrument both for beginners and professional analysts of Elliott waves. Elliott Wave Counter Installation & Inputs Guide if you want to get   notifications  about th
Gold Phoenix
Yaroslav Varankin
The perfect tool for Scalng in the Forex markets You can trade both from signal to signal and using take profit  The algorithm does not use Zigzag!  No redrawing!  This is a channel instrument that uses a moving average as a filter. Moving Average  There are 2 parameters for the settings Ma Period = 5 period Moving Average  Channel 1.0 distance of channel lines from the chart Price Signal Filter - calculation of signal opening and filter There is a complete set of Alert There is a multi-timefram
The reason why many traders new to using the Fibonacci retracement tool find it hard to effectively use it is because they are having trouble identifying swing points that are significant enough to be considered. Main Features Show Fibonacci number with LL to HH in multitimeframe Show 23.6,38.2,50,61.8,78.6,88.6,100,112.8,127.2,141.4,161.8,200,224,261.8,314,361.8 and 423 of Fibonacci number Easy to use with simple interface. Real time information for the Fibonacci number . Settings Global
This dashboard shows the latest available harmonic patterns for the selected symbols, so you will save time and be more efficient / MT5 version . Free Indicator:   Basic Harmonic Pattern Comparison of "Basic Harmonic Pattern" vs. "Basic Harmonic Patterns Dashboard" Indicators Feature Basic Harmonic Pattern Basic Harmonic Patterns Dashboard Functionality Detects and displays harmonic patterns on a single chart Searches multiple symbols and timeframes for harmonic patterns, displays result
Anubis Skunk
Sayan Vandenhout
Anubis Skunk USES THE TREND WAVE INDICATOR AND IT CAN IDENTIFY THE BEGINNING AND THE END OF A NEW WAVE TREND MOVEMENT. AS AN OSCILLATOR, THE INDICATOR IDENTIFIES THE OVERBOUGHT AND OVERSOLD ZONES. IT WORKS GREAT TO CATCH THE SHORT TERM PRICE REVERSALS AND USES A MARTINGALE STRATEGY TO CLOSE ALL TRADES IN PROFIT. USE DEFAULT SETTINGS ON H1 OR HIGHER TIME FRAME ON ANY PAIR FOR MORE ACCURATE TRADES WHY THIS EA : Smart entries calculated by 5 great strategies The EA can be run on even a $
Vanglutio
Sayan Vandenhout
VANGLUTIO USES THE TREND WAVE INDICATOR AND IT CAN IDENTIFY THE BEGINNING AND THE END OF A NEW WAVE TREND MOVEMENT. AS AN OSCILLATOR, THE INDICATOR IDENTIFIES THE OVERBOUGHT AND OVERSOLD ZONES. IT WORKS GREAT TO CATCH THE SHORT TERM PRICE REVERSALS AND USES A MARTINGALE STRATEGY TO CLOSE ALL TRADES IN PROFIT. USE DEFAULT SETTINGS ON H1 OR HIGHER TIME FRAME ON ANY PAIR FOR MORE ACCURATE TRADES WHY THIS EA : Smart entries calculated by 5 great strategies The EA can be run on even a $200
This indicator has a lot of numerology analyzing methods that can support your analyzes or can work as custom strategy by it self ..we will start to explain them one by one :   1- Range   channel that draws the limits of daily movements to detect places of buy and places of sell . 2-   Angler   will detect Dynamic numeral levels that result of time and price squaring with custom numeral method that works like support and resistant and will support your analyzes 3-   Shepherd Levels   it is l
Reversal Monster Mini
Abdulfattah Yahya Mohammed Alhazmi
The Most advanced and comprehensive EA to trade Trend Reversals/Pullbacks It is a very profitable EA, to trade trends breakout, and manage trades, takeprofit, stoploss, move to breakeven, and trailing stop. The   “Reversal Monster EA”   trades Reversal/Pullbacks when the current price of the pair pullback to a predefined horizontal level or trendline on the currency chart. The opening of the position can be immediate after pullback to the drawn trendline or after closing the candle below/abov
FREE
This indicator Super Channel Pro indicator.Indicator displays trend movement. Indicator calculates automatically line. Features FiltPer - displays indicator channel period. deviation - displays indicator channel deviation. deviation2 - displays indicator channel deviation. How to understand the status: If the arrow is green, trend is up. If the arrow is red, trend is down. //////////////////////////////////////////////////////////////////////////////////////////////////////////////////////////
Introduction to Chart Pattern MT Chart Pattern MT is a chart pattern scanner to detect the triangle pattern, falling wedge pattern, rising wedge pattern, channel pattern and so on. Chart Pattern MT uses highly sophisticated chart pattern detection algorithm. However, we have designed it in the easy to use with intuitive user interface. Chart Pattern MT will show all the patterns in your chart in the most efficient format for your trading. You do not have to do tedious manual pattern detection an
How to use Pair Trading Station Pair Trading Station is recommended for H1 time frame and you can use it for any currency pairs. To generate buy and sell signal, follow few steps below to apply Pair Trading Station to your MetaTrader terminal. When you load Pair Trading Station on your chart, Pair Trading station will assess available historical data in your MetaTrader platforms for each currency pair. On your chart, the amount of historical data available will be displayed for each currency pai
PZ 123 Pattern
PZ TRADING SLU
3.75 (4)
Unlock powerful breakout opportunities The 123 Pattern is one of the most popular, powerful and flexible chart patterns. The pattern is made up of three price points: a bottom, a peak or valley, and a Fibonacci retracement between 38.2% and 71.8%. A pattern is considered valid when the price breaks beyond the last peak or valley, moment at which the indicator plots an arrow, rises an alert, and the trade can be placed. [ Installation Guide | Update Guide | Troubleshooting | FAQ | All Products ]
Hot Zones
Innovicient Limited
5 (1)
This indicator simplifies your entry zones by displaying the areas where you can plan your entry that potentially could give you high risk/reward ratios. Other than picking the most optimal entry points, the Hot Zone indicator can act as your typical support/resistance indicator for pullbacks for all timeframes. You can use this indicator as the only trading indicator or use it with another indicator for reentry purposes.  Besides, when using Hot Zones, the risk/reward ratio should be well abov
Ticks Size
Viktor Kolmakov
This indicator displays in a separate window the difference between the number of points which increased the price, and the number of points that decreased the price during the time interval specified in the settings. The time interval for calculation is expressed as the number of bars of the chart the indicator is attached to. This approach allows you to evaluate the movement direction (growth or fall) of the instrument's price, the strength of the movement and the size of the movement in point
Based on commonly used ZigZag indicators, in-depth mining was conducted on the indicators, with two main improvements: 1、 Annotate each ZZ price point; Annotate the distance points between adjacent ZZ points for a more convenient and intuitive view of price fluctuations. 2、 Draw a Fibonacci line for the current price direction of ZZ. The Fibonacci line includes two types: the Fibonacci retracement level and the Fibonacci expansion level. When the last four ZZ points comply with Dow's 123 rule,
The Squat is a function of the range of a given price bar and the volume, or TIC volume, that occurs while that range is being created. The basic idea is that high volume and little price movement indicate substantial support or resistance. The idea behind the approach to this indicator is to first look for likely Fibonacci support and resistance and then see if Squat manifests when that point is reached. The indicator determines one of the high probability patterns of DiNapoli. It does not re
This is an arrow indicator without a future function,developed based on the most advanced profit trading algorithms.It has the most innovative and advanced dual trend analysis module, as well as the latest and highly effective market trend prediction algorithm.Trends are your friends, and following larger trends can earn the maximum profit in foreign exchange. This indicator helps traders identify current trends and track them. Someone once made a profit of 10 times in a week by relying on it.No
Shark Deal Book
Philip Pankaj Suthagar
4 (3)
Term  "shark"  in the business world denotes a high volume investor who just made a good investment in a highly Potential business deal.So, sharks are the ones who make the market move. In our case, if an American shark bought a Japanese company, he/she has to convert American dollars into Japanese yen to make the deal. So, the demand for the Japanese yen will increase sharply. Thus USD/JPY will go short rapidly if the deal was from the shark. Another example, In the case of forex, if fed increa
Elliott Wave Trend was designed for the scientific wave counting. This tool focuses to get rid of the vagueness of the classic Elliott Wave Counting using the guideline from the template and pattern approach. In doing so, firstly Elliott Wave Trend offers the template for your wave counting. Secondly, it offers Wave Structural Score to assist to identify accurate wave formation. It offers both impulse wave Structural Score and corrective wave Structure Score. Structural Score is the rating to sh
Blahtech Market Profile
Blahtech Limited
4.61 (18)
Was: $249  Now: $99   Market Profile defines a number of day types that can help the trader to determine market behaviour. A key feature is the Value Area, representing the range of price action where 70% of trading took place. Understanding the Value Area can give traders valuable insight into market direction and establish the higher odds trade. It is an excellent addition to any system you may be using. Blahtech Limited presents their Market Profile indicator for the MetaTrader community. Ins
PZ Divergence Trading
PZ TRADING SLU
5 (3)
Unlock hidden profits: accurate divergence trading for all markets Special Offer: Purchase now to receive free bonuses worth $159! (Read more for details) Tricky to find and scarce in frequency, divergences are one of the most reliable trading scenarios. This indicator finds and scans for regular and hidden divergences automatically using your favourite oscillator. [ Installation Guide | Update Guide | Troubleshooting | FAQ | All Products ] Easy to trade Finds regular and hidden divergence
Cloud Eyes is an advanced moving average alert that   will easily monitor the price action based on set moving averages to multiple open charts.  Objective: To monitor multiple open charts and notify traders conveniently in a single display panel when using the moving averages to enter/exit a trades. Features: Monitor price action in two timeframes at the same time Supports simple, exponential, smoothed, linear weighted moving averages Trigger an alert based on candle size (full/body length) Ca
Blahtech Supply Demand
Blahtech Limited
4.63 (35)
Was: $299  Now: $99   Supply Demand uses previous price action to identify potential imbalances between buyers and sellers. The key is to identify the better odds zones, not just the untouched ones. Blahtech Supply Demand indicator delivers functionality previously unavailable on any trading platform. This 4-in-1 indicator not only highlights the higher probability zones using a multi-criteria strength engine, but also combines it with multi-timeframe trend analysis, previously confirmed swings
Buyers of this product also purchase
Gold Stuff
Vasiliy Strukov
4.9 (270)
Gold Stuff is a trend indicator designed specifically for gold and can also be used on any financial instrument. The indicator does not redraw and does not lag. Recommended time frame H1. At it indicator work full auto  Expert Advisor EA Gold Stuff. You can find it at my profile. Contact me immediately after the purchase to get   personal bonus!  You can get a free copy of our Strong Support and Trend Scanner indicator, please pm. me! Settings  and manual here   SETTINGS Draw Arrow - on off. dra
PLEASE READ THE INFO DOWN BELOW BEFORE PURCHASING THE PRODUCT! Apollo Pips PLUS SP is a unique product!  IT IS FOR THOSE WHO WANT TO GET MY NEW "APOLLO PIPS" INDICATOR PLUS "SUPER PACK" BONUS WITH ACCESS TO ALL MY TRADING INDICATORS! By purchasing the Apollo Pips PLUS SP product you're actually purchasing an absolutely new version of my Apollo Pips indicator. This version of the indicator has got an improved algorithm and an easy to use parameter which gives you the opportunity to use the indica
Scalper Inside PRO
Alexey Minkov
4.75 (60)
An exclusive indicator that utilizes an innovative algorithm to swiftly and accurately determine the market trend. The indicator automatically calculates opening, closing, and profit levels, providing detailed trading statistics. With these features, you can choose the most appropriate trading instrument for the current market conditions. Additionally, you can easily integrate your own arrow indicators into Scalper Inside Pro to quickly evaluate their statistics and profitability. Scalper Inside
Trend Pulse
Mohamed Hassan
5 (5)
Please contact me after purchase to immediately get your PDF strategy + documentation for Trend Pulse !  Official release price of $89  (2 /50 copies left). Next price is $199 . Introducing Trend Pulse , a unique and robust indicator capable of detecting bullish, bearish, and even ranging trends! Trend Pulse uses a special algorithm to filter out market noise with real precision. If the current symbol is moving sideways, Trend Pulse will send you a ranging signal, letting you know that it'
FX Power MT4 NG
Daniel Stein
5 (12)
Trading GOLD, and currencies, with the dog walk strategy  - super smart Trading GOLD, and currencies, with the breakout strategy  - super easy Visit our all-new   Stein Investments Welcome Page   to get the latest information, updates and trading strategies. FX Power MT4 NG  is the next generation of our long-time very popular currency strength meter, FX Power.  And what does this next-generation strength meter offer? Everything you have loved about the original FX Power  PLUS GOLD/XAU stre
TPSproTREND PrO
Roman Podpora
4.79 (19)
TPSpro TRENDPRO  - is a trend indicator that automatically analyzes the market and provides information about the trend and each of its changes, as well as giving signals for entering trades without redrawing! The indicator uses each candle, analyzing them separately. referring to different impulses - up or down impulse. Exact entry points into transactions for currencies, crypto, metals, stocks, indices!  Version MT5             DETAILED DESCRIPTION              R ecommended to use with an indi
Atomic Analyst
Issam Kassas
5 (3)
First of all Its worth emphasizing here that this Trading Indicator is   Non-Repainting , Non Redrawing and Non Lagging Indicator   Indicator, Which makes it ideal from both manual and robot trading.  User manual: settings, inputs and strategy . The Atomic Analyst  is a PA Price Action Indicator that uses Strength and Momentum of the price to find a better edge in the market. Equipped with Advanced filters which help remove noises and false signals, and Increase Trading Potential. Using Multipl
Gold Channel is a volatility-based indicator, developed with a specific timing algorithm for the XAUUSD pair, which consists of finding possible corrections in the market. This indicator shows two outer lines, an inner line (retracement line) and an arrow sign, where the theory of the channel is to help identify overbought and oversold conditions in the market. The market price will generally fall between the boundaries of the channel. If prices touch or move outside the channel it is a tra
Currently 20% OFF ! Best Solution for any Newbie or Expert Trader! This dashboard software is working on 28 currency pairs plus one. It is based on 2 of our main indicators (Advanced Currency Strength 28 and Advanced Currency Impulse). It gives a great overview of the entire Forex market plus Gold or 1 indices. It shows Advanced Currency Strength values, currency speed of movement and signals for 28 Forex pairs in all (9) timeframes. Imagine how your trading will improve when you can watch the e
PZ Day Trading
PZ TRADING SLU
3.67 (3)
Effortless trading: non-repainting indicator for accurate price reversals Special Offer: Purchase now to receive free bonuses worth $189! (Read more for details) This indicator detects price reversals in a zig-zag fashion, using only price action analysis and a donchian channel. It has been specifically designed for short-term trading, without repainting or backpainting at all. It is a fantastic tool for shrewd traders aiming to increase the timing of their operations. [ Installation Guide | Up
Clear Breakout
Martin Alejandro Bamonte
5 (1)
The "Breakout Buy-Sell" indicator is designed to identify and highlight potential buy and sell opportunities based on price breakouts during different market sessions (Tokyo, London, and New York). This indicator helps traders clearly visualize buy and sell zones, as well as take-profit (TP) and stop-loss (SL) levels. Usage Strategy The indicator can be used as follows: Initial Setup : Select the market session and adjust the GMT offset. Market Visualization : Observe the breakout boxes drawn at
CURRENTLY 26% OFF Best Solution for any Newbie or Expert Trader! This Indicator is a unique, high quality and affordable trading tool because we have incorporated a number of proprietary features and a new formula. With only ONE chart you can read Currency Strength for 28 Forex pairs! Imagine how your trading will improve because you are able to pinpoint the exact trigger point of a new trend or scalping opportunity? User manual: click here That's the first one, the original! Don't buy a worthle
PRO Renko System
Oleg Rodin
5 (26)
PRO Renko System is a highly accurate trading system specially designed for trading RENKO charts. The ARROWS and Trend Indicators DO NOT REPAINT! The system effectively neutralizes so called market noise giving you access to accurate reversal signals. The indicator is very easy to use and has only one parameter responsible for signal generation. You can easily adapt the tool to any trading instrument of your choice and the size of the renko bar. I am always ready to provide extra support to help
Advanced Currency IMPULSE with ALERT
Bernhard Schweigert
4.91 (495)
CURRENTLY 31% OFF !! Best Solution for any Newbie or Expert Trader! This indicator is a unique, high quality and affordable trading tool because we have incorporated a number of proprietary features and a secret formula. With only ONE chart it gives Alerts for all 28 currency pairs. Imagine how your trading will improve because you are able to pinpoint the exact trigger point of a new trend or scalping opportunity! Built on new underlying algorithms it makes it even easier to identify and confir
Advanced Supply Demand
Bernhard Schweigert
4.9 (314)
CURRENTLY 26% OFF !! Best Solution for any Newbie or Expert Trader! This indicator is a unique, high quality and affordable trading tool because we have incorporated a number of proprietary features and a new formula. With this update, you will be able to show double timeframe zones. You will not only be able to show a higher TF but to show both, the chart TF, PLUS the higher TF: SHOWING NESTED ZONES. All Supply Demand traders will love it. :) Important Information Revealed Maximize the potenti
NAM Order Blocks
NAM TECH GROUP, CORP.
5 (1)
MT4 Multi-timeframe Order Blocks detection indicator. Features - Fully customizable on chart control panel, provides complete interaction. - Hide and show control panel wherever you want. - Detect OBs on multiple timeframes. - Select OBs quantity to display. - Different OBs user interface. - Different filters on OBs. - OB proximity alert. - ADR High and Low lines. - Notification service (Screen alerts | Push notifications). Summary Order block is a market behavior that indicates order collection
Enigmera
Ivan Stefanov
5 (4)
ENIGMERA: The core of the market (If the demo of mql5.com doesn't working and you want to try Enigmera please message me.) Introduction This indicator and trading system is a remarkable approach to the financial markets . ENIGMERA uses the fractal cycles to accurately calculate support and resistance levels. It shows the authentic accumulation phase and gives direction and targets.  A system that works whether we are in a trend or a correction.   How does it operate? ENIGMERA comprises of fol
PZ Trend Trading
PZ TRADING SLU
4.8 (5)
Capture every opportunity: your go-to indicator for profitable trend trading Special Offer: Purchase now to receive free bonuses worth $159! (Read more for details) Trend Trading is an indicator designed to profit as much as possible from trends taking place in the market, by timing pullbacks and breakouts. It finds trading opportunities by analyzing what the price is doing during established trends. [ Installation Guide | Update Guide | Troubleshooting | FAQ | All Products ] Trade financial
TPSpro RFI Levels
Roman Podpora
4.83 (24)
Reversal First Impulse levels (RFI)    INSTRUCTIONS        RUS       -       ENG              R ecommended to use with an indicator   -   TPSpro  TREND PRO -  Version MT5 A key element in trading is zones or levels from which decisions to buy or sell a trading instrument are made. Despite attempts by major players to conceal their presence in the market, they inevitably leave traces. Our task was to learn how to identify these traces and interpret them correctly. Main functions: Displaying activ
Order Block Hunter
Noha Mohamed Fathy Younes Badr
5 (2)
Order block hunter indicator is the best indicator for  hunt the order blocks that area where there has been a large concentration of limit orders waiting to be executed Order blocks are identified on a chart by observing previous price action and looking for areas where the price experienced significant movement or sudden changes in direction .This indicator does that for you by using very complicated codes and helps you to take the best areas To buy and sell because it make marks at the best a
Backtest and Read Overview before purchase. Chart patterns have been a topic of debate among traders; some believe they are reliable signalers, while others do not. Our Chart Patterns All-in-One indicator displays various chart patterns to help you test these theories for yourself. The profitability of these patterns is not a reflection of the indicator's effectiveness but rather an evaluation of the patterns themselves. The Chart Patterns All-in-One indicator is an excellent tool for visualizin
After purchase please leave a comment or leave a review and I will send you the BONUS trade assistant EA. Multicurrency and multitimeframe trade alerts . NON REPAINTING! Auto trailing stop and risk reward takeprofit. The indicator scans and analizing the market so You have nothing to do. trade all your currency pairs in 1 chart! When adding it to a chart change the timeframes and find the best timeframe for that currency pair chart with the signals! Every pair is different! Telegram : https://
Connect Indicator
Sukunthakan Ngernbamrung
Connect Indicator is a tool used for connecting indicators between the MQL market and MT4. The connected indicators are made by our group and can be used for other applications, such as sending messages to the Line application or Telegram application. If you have any questions, please don't hesitate to ask us to receive support. Function and indicator buffer Buffer one is the high price of the previous candle. Buffer two is the high price of the previous candle. Usage To connect indicators to fu
This indicator I use with RENKO and RangeBar candle Discover the Secret to Successful Forex Trading with Our Custom MT4 Indicator! Have you ever wondered how to achieve success in the Forex market, consistently earning profits while minimizing risk? Here is the answer you've been searching for! Allow us to introduce our proprietary MT4 indicator that will revolutionize your approach to trading. Unique Versatility Our indicator is specially designed for users who prefer Renko and Rangebar candle
Entry Points Pro
Yury Orlov
4.7 (226)
Top indicator for MT4 providing accurate signals to enter a trade without repainting! Watch  the video  (6:22) with an example of processing only one signal that paid off the indicator! It can be applied to any financial assets:  forex, cryptocurrencies, metals, stocks, indices.  MT5 version is here   It will provide pretty accurate trading signals and tell you when it's best to open a trade and close it. Most traders improve their trading results during the first trading week with the help of t
Volatility Trend System - a trading system that gives signals for entries. The volatility system gives linear and point signals in the direction of the trend, as well as signals to exit it, without redrawing and delays. The trend indicator monitors the direction of the medium-term trend, shows the direction and its change. The signal indicator is based on changes in volatility and shows market entries. The indicator is equipped with several types of alerts. Can be applied to various trading
TPA True Price Action indicator reveals the true price action of the market makers through 100% non-repainting signals (except early signals mode) strictly at the close of a candle! TPA shows entries and re-entries, every time the bulls are definitely stronger than the bears and vice versa. Not to confuse with red/green candles. The shift of power gets confirmed at the earliest stage and is ONE exit strategy of several. There are available now two free parts of the TPA User Guide for our custo
Currency Strength Exotics
Bernhard Schweigert
4.88 (33)
CURRENTLY 20% OFF ! Best Solution for any Newbie or Expert Trader! This Indicator is specialized to show currency strength for any symbols like Exotic Pairs Commodities, Indexes or Futures. Is first of its kind, any symbol can be added to the 9th line to show true currency strength of Gold, Silver, Oil, DAX, US30, MXN, TRY, CNH etc. This is a unique, high quality and affordable trading tool because we have incorporated a number of proprietary features and a new formula. Imagine how your trading
Trend Sensor MT4
Yuriy Lyachshenko
The indicator shows the most appropriate entry and exit points. It also displays statistical data on all signals for better analysis of trading. With the help of this indicator you will be able to better understand the market. As soon as the power of the trend begins to weaken (this will be shown on the panel), the trend line will gravitate to the horizontal position - this is the signal to exit the trade. Or you can exit when the average/median profit level is reached. The indicator was
RelicusRoad Pro
Relicus LLC
4.73 (141)
How many times have you bought a trading indicator with great back-tests, live account performance proof with fantastic numbers and stats all over the place but after using it, you end up blowing your account? You shouldn't trust a signal by itself, you need to know why it appeared in the first place, and that's what RelicusRoad Pro does best! NOW $147 (increasing to $499 after a few updates) - UNLIMITED ACCOUNTS (PCs or MACs) **  User Manual + Strategies + Training Videos + Private Group with
More from author
Enigmera
Ivan Stefanov
5 (4)
ENIGMERA: The core of the market (If the demo of mql5.com doesn't working and you want to try Enigmera please message me.) Introduction This indicator and trading system is a remarkable approach to the financial markets . ENIGMERA uses the fractal cycles to accurately calculate support and resistance levels. It shows the authentic accumulation phase and gives direction and targets.  A system that works whether we are in a trend or a correction.   How does it operate? ENIGMERA comprises of fol
This is the indicator for the biggest money.  It's performance is exceptional. Whatever interest there is in the market you will see it.  In almost all cases it will only give you a long term view of the market, but don't be fooled into thinking this is event bound. Nothing like that. It finds where the biggest interest is in the market and shows it to you. Do not forget that the biggest money (interests)  not shown on the market everyday . That's something you haven't encountered.The price is
This indicator effectively separates the tick volume in the forex market into bullish and bearish categories. Additionally, it provides the functionality to calculate and display the sum of bullish and bearish tick volumes for any selected period of your choice. You can easily adjust the period by moving the two blue lines on the chart, allowing for customizable and precise volume analysis tailored to your trading needs. If you find it usefull your reviews will be appreciated! Happy trading!
FREE
Levelss
Ivan Stefanov
The LEVELSS indicator shows: - Daily bullish and bearish zone. It is visible everyday from 00:00 to 23:59.  - The weekly bullish and bearish zone. It is visible from Monday 0:00 to Friday 23:59 every week. - Specially calculated channel from a specific timeframe that is displayed on all other timeframe. By default, this is the 4-hour timeframe that you can change to whichever other timeframe you wish to trade. It is calculated non-stop. At the top left of the screen there is an indication of
This indicator is based on practical experience.  Insert the date/time of your top/bottom. It calculates the most visited level from top/bottom up to the current moment. It updates automatically with each new candle. You can simultaneously use multiple indicators for different trends and timeframes. The length is always plotted from the beginning of your period to the present. Recommendations: Currency pair: All pairs, all markets Timeframe: All timeframes Minimum deposit : No minimum dep
Two Snakes
Ivan Stefanov
5 (1)
2 SNAKES  is a first class scalping system. As the entries are quite precise, you are likely to become addicted to this system very quickly.  You have 2 snakes. When you see a candle above or below them that does not touch them - that is your scalping signal. Then buy or sell at the green line or close. If you use a larger time frame, scalping can become trend following. The snakes are calculated precisely in relation to the current state of the market. They ARE NOT moving averages.  You dec
In the trading world, a trend that follows a 45-degree angle is considered sustainable.  However, accurately measuring this critical angle remains a challenge as there is no clear method described. Traders can only guess how it is calculated, how many candle counts there should be, and what the appropriate chart zoom is. We have solved this problem and defined all the conditions logically, and now presenting you Trend Angle 45. It is a tool that visualizes the 45-degree trend line based on a
Fair Value
Ivan Stefanov
The indicator shows the FAIR VALUE price and gives target levels to trade. You can trade both - trend and range. The different time frames show very similar results hence the indicator can be considered non-timeframe dependant. The indicator calculates automatically: Fair value level Correction channel Distance in pips from the fair value to the correction channel boundaries Sine wave that starts from the first fair value level candle and expands over time showing the expected maximum levels of
Filter:
No reviews
Reply to review
Version 1.1 2024.08.23
New levels added.