Support Resistance Channels
- Indicators
- Huynh Thanh Tung Kieu
- Version: 1.0
- Activations: 7
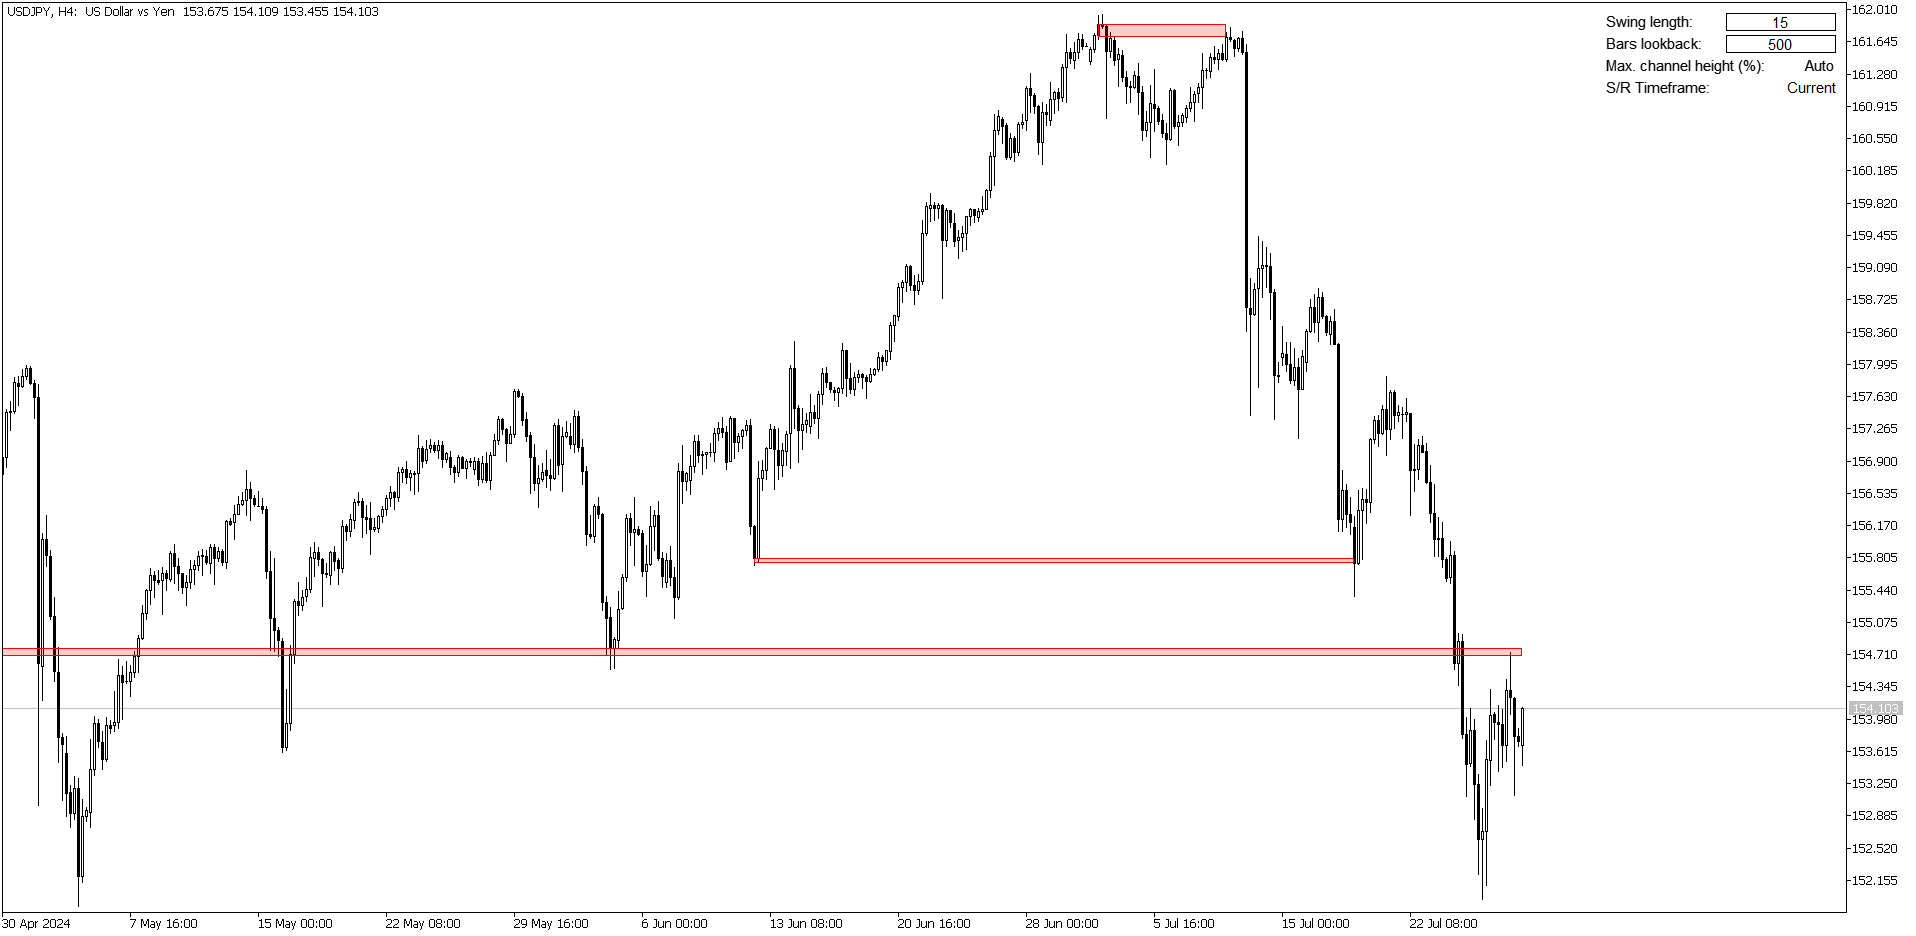
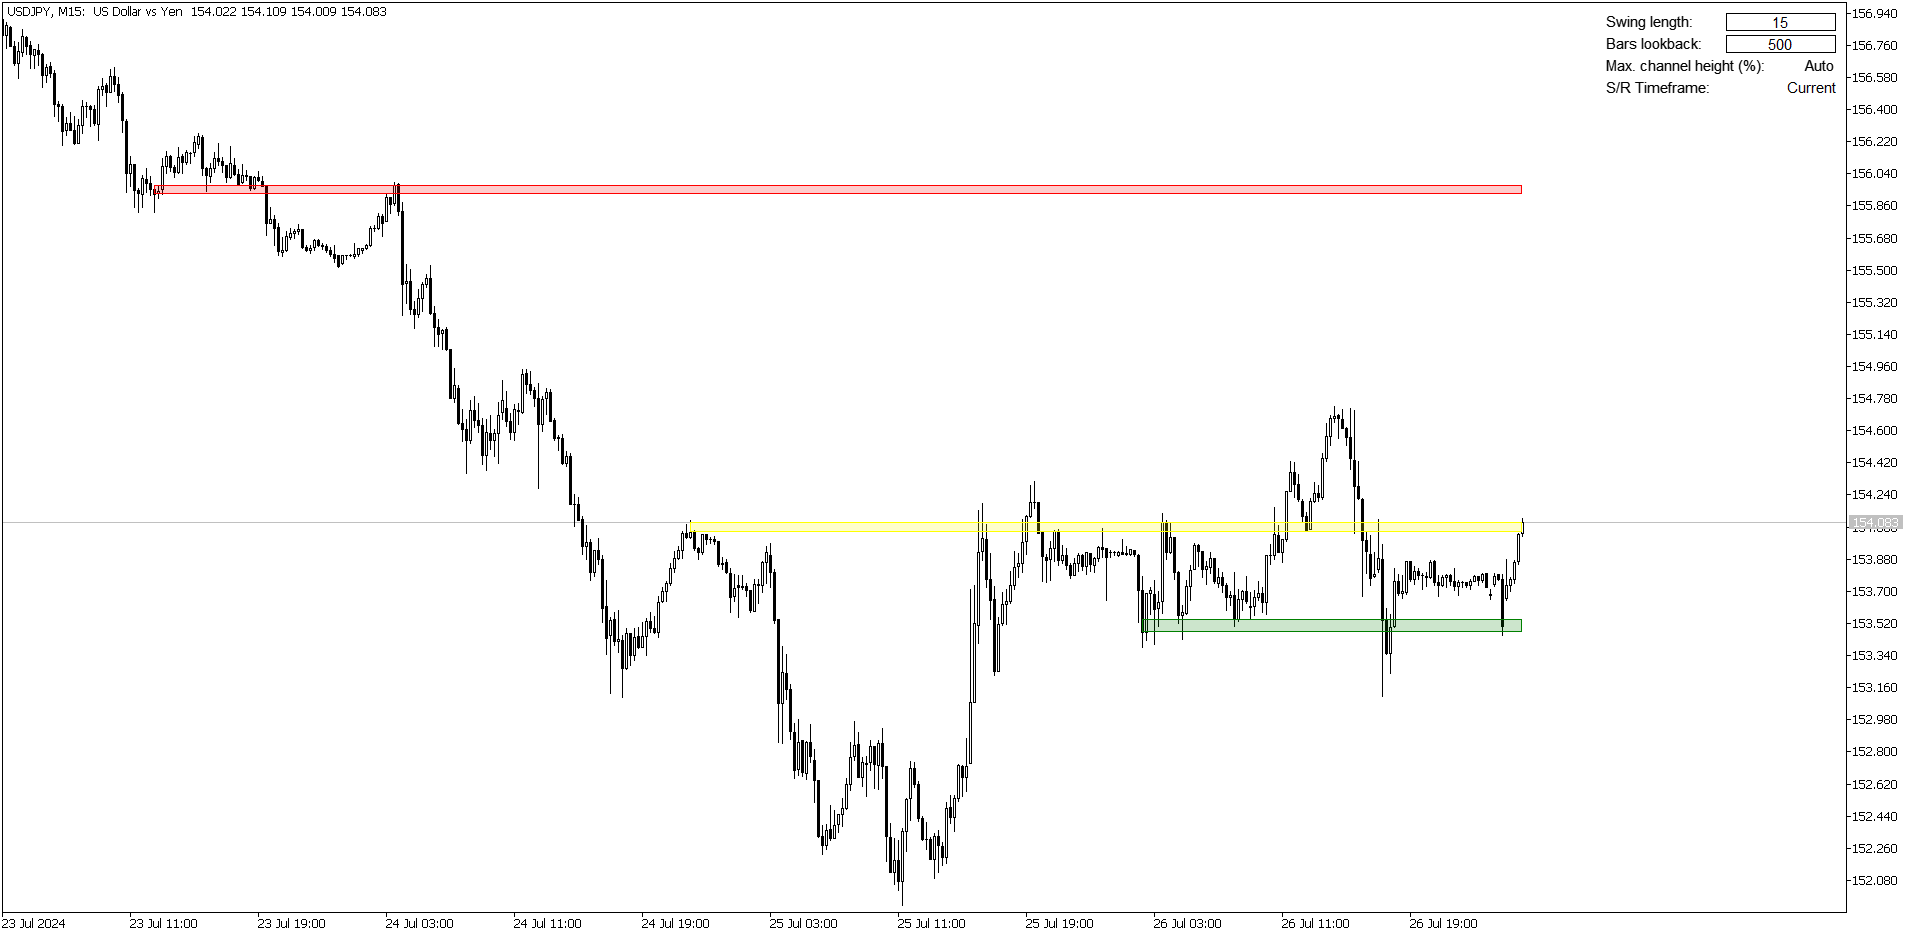
Automatically find and plot S/R channels on your chart, making it easy to identify key levels. The indicator supports multiple timeframes, allowing you to display channels from different timeframes on your current chart. Additionally, it offers transparent colors for enhanced visual clarity and lets you customize the channel colors to suit your preferences.
How does this indicator work?
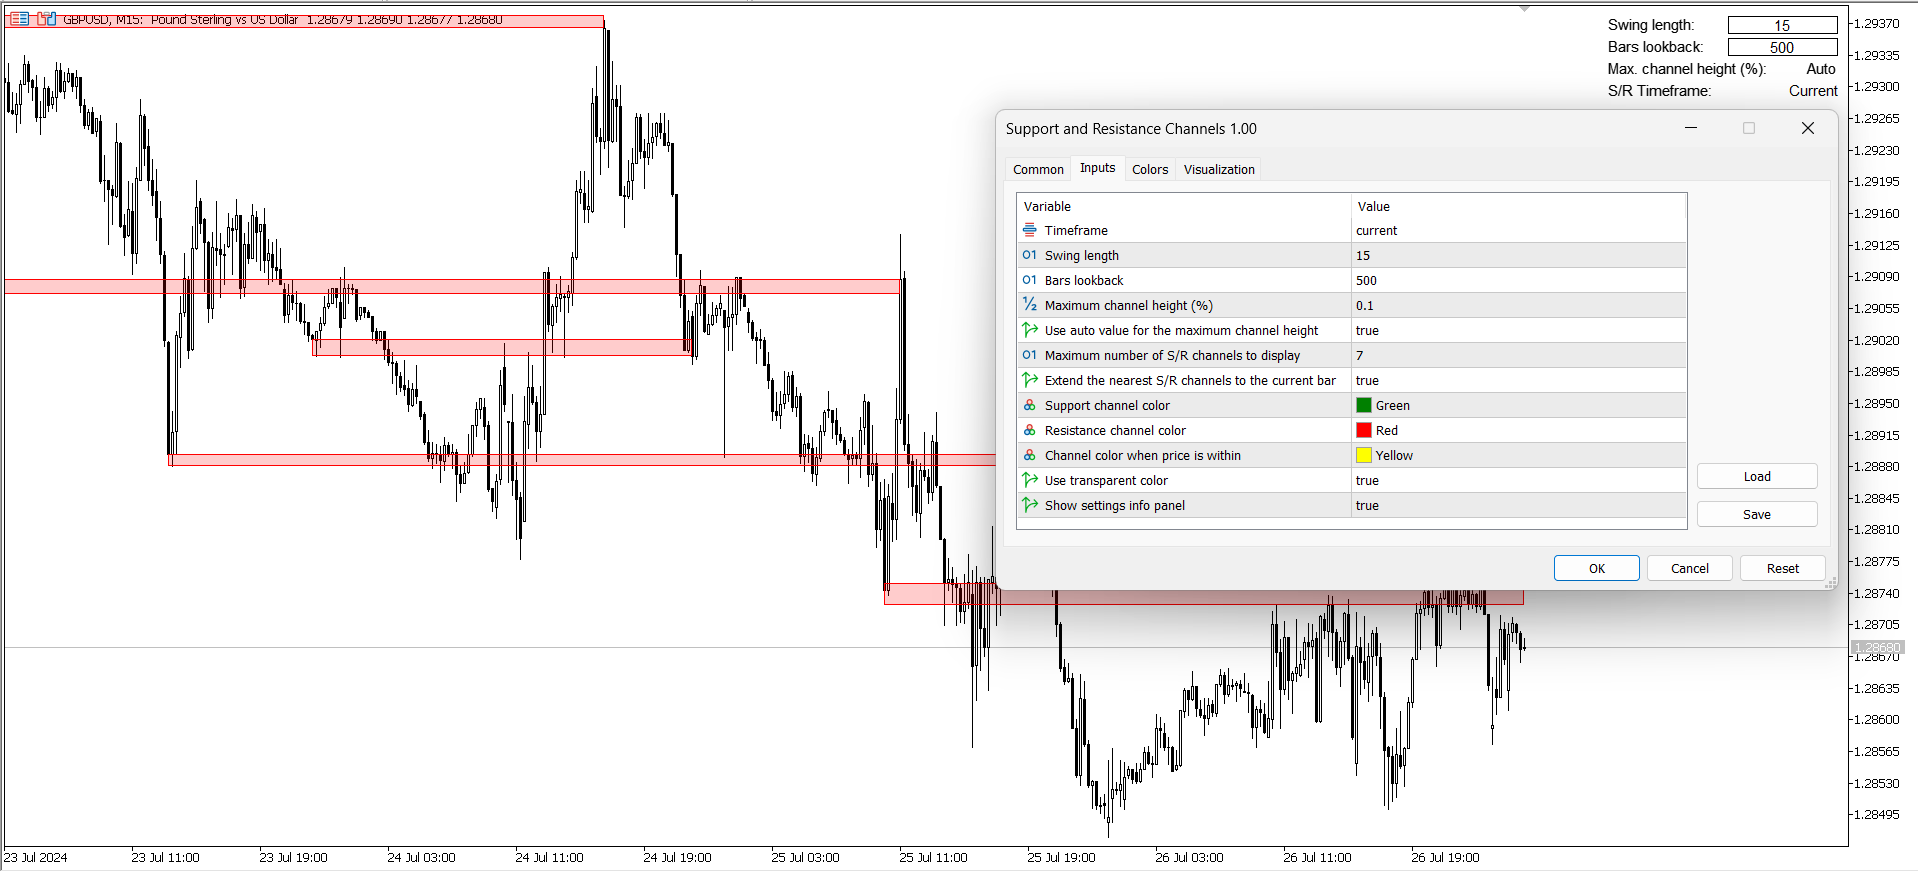
The indicator finds swing points (highs and lows) within a range defined by the "Bars lookback" parameter. Swing points are the peaks (highs) and troughs (lows) on a price chart where the price changes direction. It uses the "Swing length" parameter to determine how many bars to look back and ahead to identify these points. From these swing points, it forms S/R channels, ensuring that the channel height is less than the "Maximum channel height" parameter. Finally, the indicator applies various complex filters to select the best S/R channels and plots them on the chart.
The indicator has a setting called "Use auto value for the maximum channel height", simply set this option to true (highly recommended), and you don't need to worry about adjusting the maximum channel height yourself, the indicator will handle it for you.
Explanation of parameters:
- Timeframe: Allows plotting S/R channels from a different timeframe on the current timeframe.
- Swing length: The number of bars to look back and ahead to determine if a point is a swing point. A higher value results in fewer swing points being identified, while a lower value results in more swing points being identified. Fewer swing points lead to fewer but stronger S/R channels, while more swing points lead to more but weaker S/R channels.
- Bars lookback: The range of bars within which to find swing points.
- Use auto value for the maximum channel height: If set to true, the indicator will ignore the value of the "Maximum channel height (%)" parameter.
- Maximum number of S/R channels to display: Helps keep your chart clean by limiting the number of S/R channels shown, prioritizing nearer ones and hiding farther ones.
- Extend the nearest S/R channels to the current bar: Helps you focus on the nearest support and resistance channels.
- Show settings info panel: This panel allows you to quickly adjust important parameters (swing length, bars lookback, and maximum channel height if auto value is not used) directly on the chart.
Recommended parameters:
- Timeframe: current or higher
- Swing length: 10, 15, 20
- Bars lookback: 500
- Use auto value for the maximum channel height: true
- Extend the nearest S/R channels to the current bar: true
- Use transparent color: optional (transparent color works fine, but the channels will flicker when you change the price scale, such as zooming in or out, or dragging the price scale; solid color is less visually appealing but stable and does not flicker when changing the price scale)
- Show settings info panel: true
Usage advice and warnings:
- Support and resistance channels are meant to be tested and can break. Always be cautious and do not assume that these channels will hold indefinitely.
- Avoid entering trades solely based on these channels. Combine this indicator with other technical analysis tools and indicators to increase your confidence and accuracy in trading decisions.
Note: Transparent color and the info panel only work in live mode and do not function in strategy tester mode.
The indicator has been extensively tested, but there may still be errors that I haven't discovered. Please feel free to DM me if you encounter any issues with the indicator.