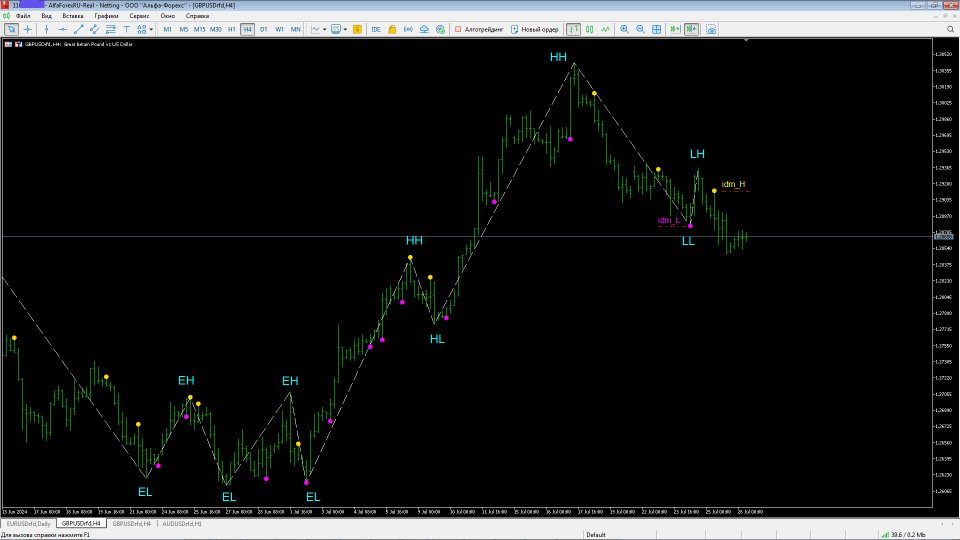
SMC Structure indicator with IDM
- Indicators
- Viktor Vazhenin
- Version: 1.0
- Activations: 5
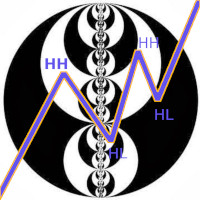
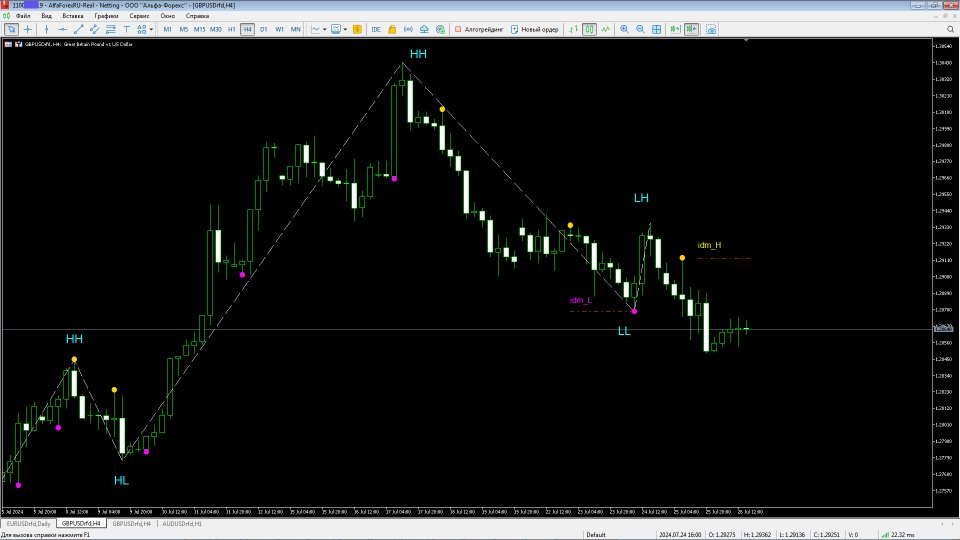
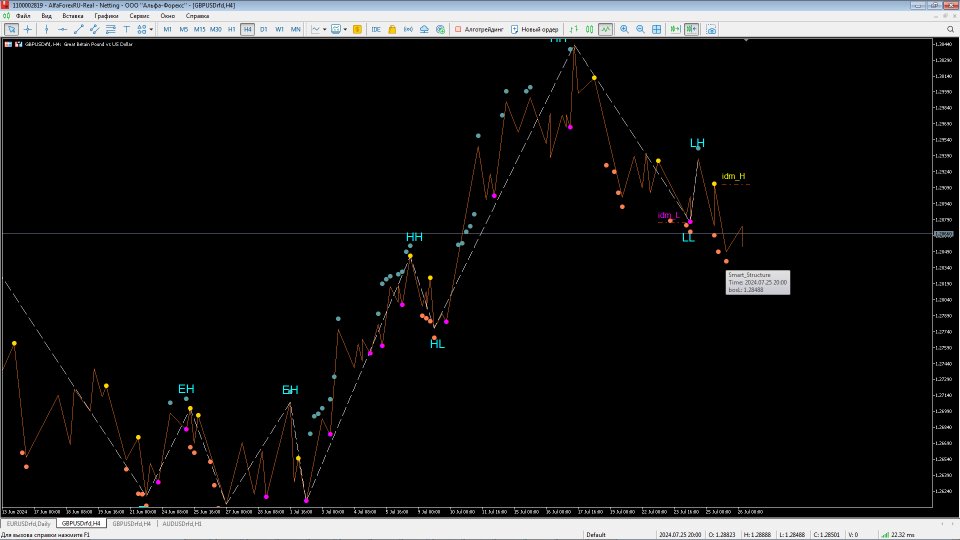
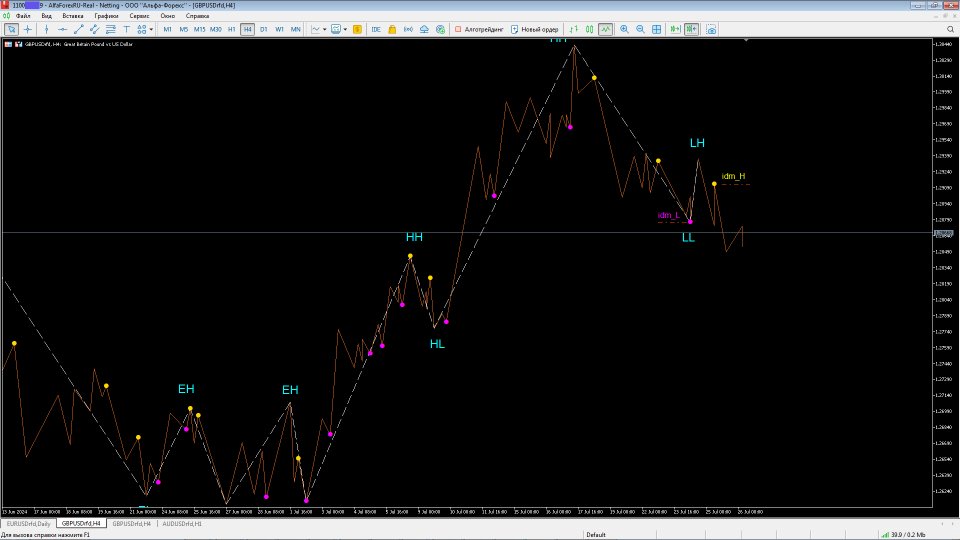
The market structure indicator on the current timeframe finds:
1. The trend (ascending and descending waves). A change in the direction of the wave occurs after the interruption of the extremum (withdrawal of liquidity from the opposite side). The trend is drawn taking into account the external bars (there can be 2 extremes on one external bar). The trend can be drawn taking into account the minimum number of bars in the wave (2 or more). It is configured by the QTY_bars_for_wave parameter
2. BoS – breakdown of the structure, updating of structural minima and maxima in the direction of the trend, ascending – updating of maxima, descending - updating of minima
3. Induction (IDM) is the extreme point of the last correction in the structure when the price makes a BoS
4. Structural points (appear after the price reaches the IDM).
