Evz Histogram
- Indicators
- Nelson Daniel Dinis Freitas Mendes
- Version: 1.0
- Activations: 5
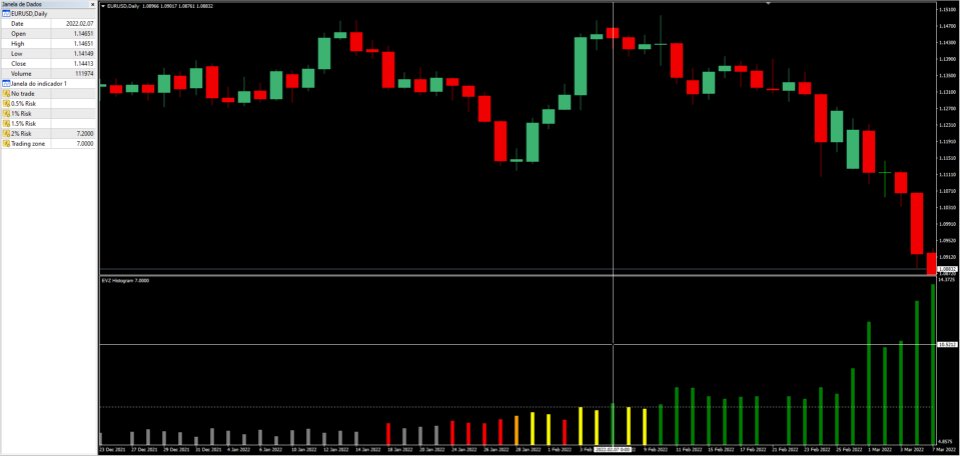
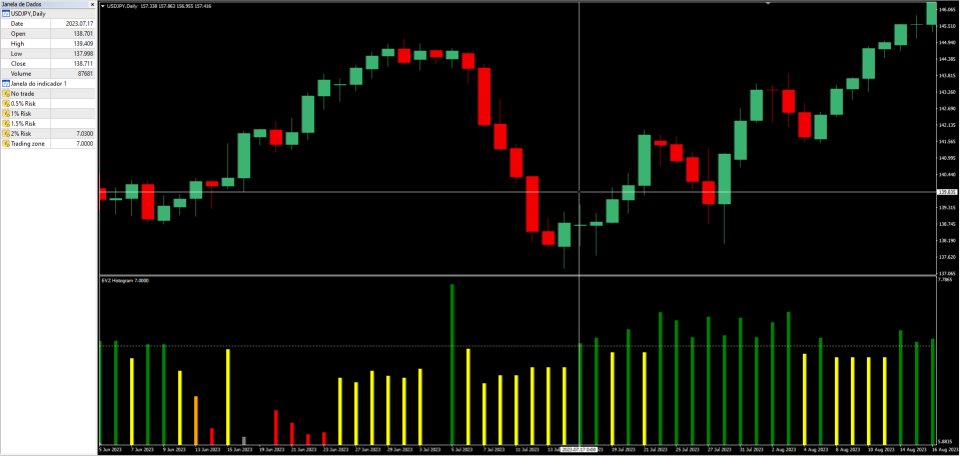
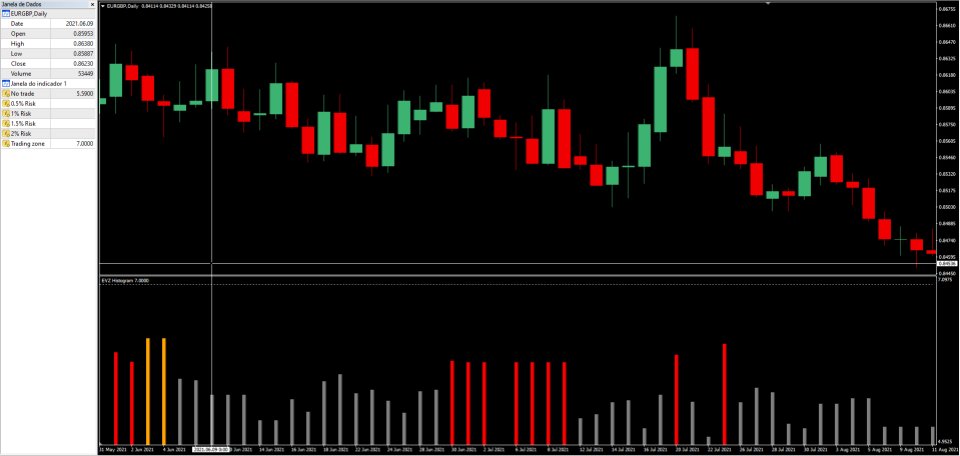
This indicator is based on the Cboe EuroCurrency Volatility Index, also known as Euro VIX and has a ticker symbol of EVZ. It basically measures volatility in the Eur/USD exchange rate but it can be used to track overall volitility in the Forex market. It's best usage is to add it to your system as a mandatory tool, when the value is above 7, you can expect some movement in the market, so you can trade at full risk, when the value is below 7, you trade with less risk or don't trade at all. I downloaded the data from barchart.com from 2017 to july 2024 and converted it to metatrader 4, the data is solely focused on the close of the EVZ value of each day. I recommend adding a horizontal line (level) on the indicator, with the value '7', I made the indicator into a histogram, with colors representing the max amount of risk you should take, with the respective names, for example the color green is "2% risk"; the color orange is "1% risk" etc, if you want, you can ignore that and use the indicator as you wish. Can be used as a volume inditator,/volatility indicator. This indicator is good for you to backtest with your system, so then you can use the real time one.
