Stats Dashboard
- Utilities
- Apex Software Ltd
- Version: 1.3
- Updated: 1 October 2024
- Activations: 10
Overview
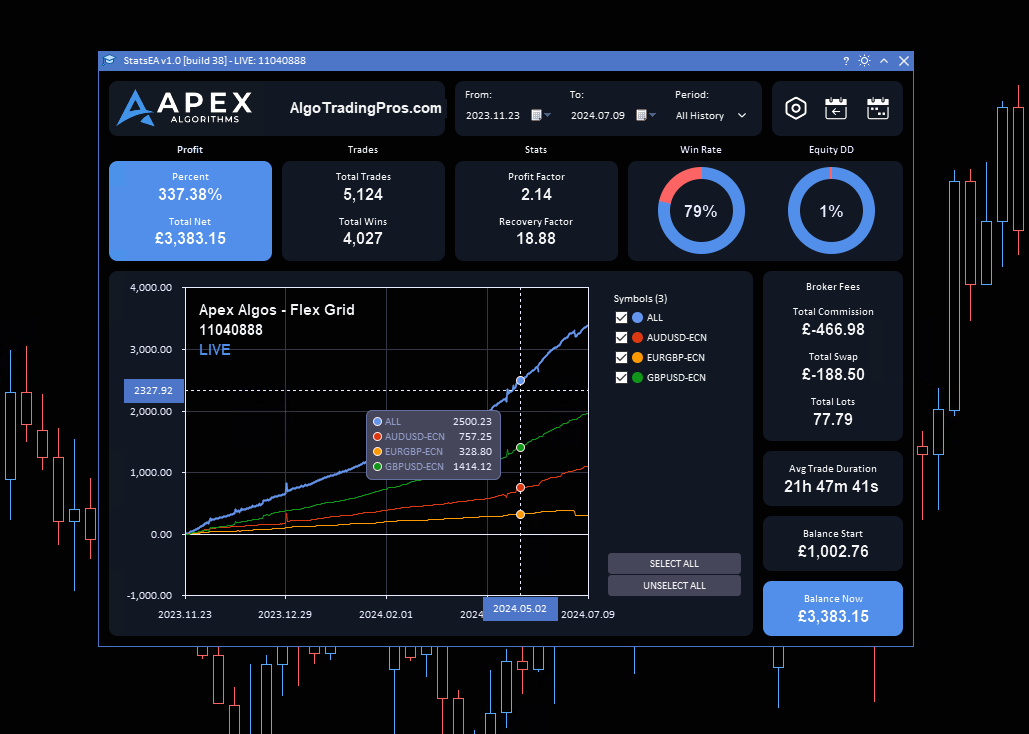
Use the Stats Dashboard to track, analyse, and enhance your trading performance. View a selection of key stats over various periods including daily, weekly, monthly and custom. Easily identify your best and worst performing instruments using the interactive line chart.
EA does not run in the strategy tester. Message us for a free trial.
Stats Displayed:
- Profit - Profit % & Total Net $
- Trades - Total Trades & Wins
- Stats - Profit Factor & Recovery Factor
- Win Rate %
- Drawdown - Equity DD % & Balance DD %
- Broker Fees - Total Commission & Total Swap Fees
- Total Lots Traded & Average Trade Duration
- Balance Start & Balance Now
Main Features
- Detailed Profit and Performance Metrics
- Real-Time Data Analysis
- Daily Summary Reports
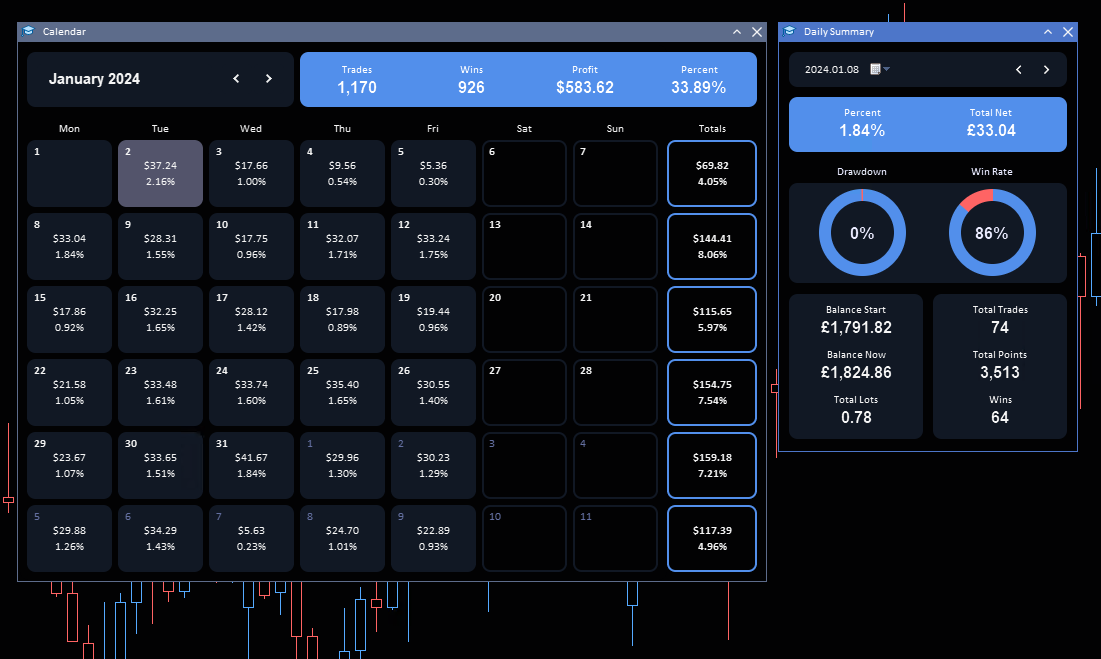
- Monthly Calendar View
- Filter by Specific Algorithms (Magic Numbers)
Real-Time Data Analysis
- Access Real-Time Trading Data: Stay updated with the latest market movements and your trading performance.
- Make Informed Decisions Based on Live Market Analysis: Utilize up-to-date data for quick and accurate trading decisions.
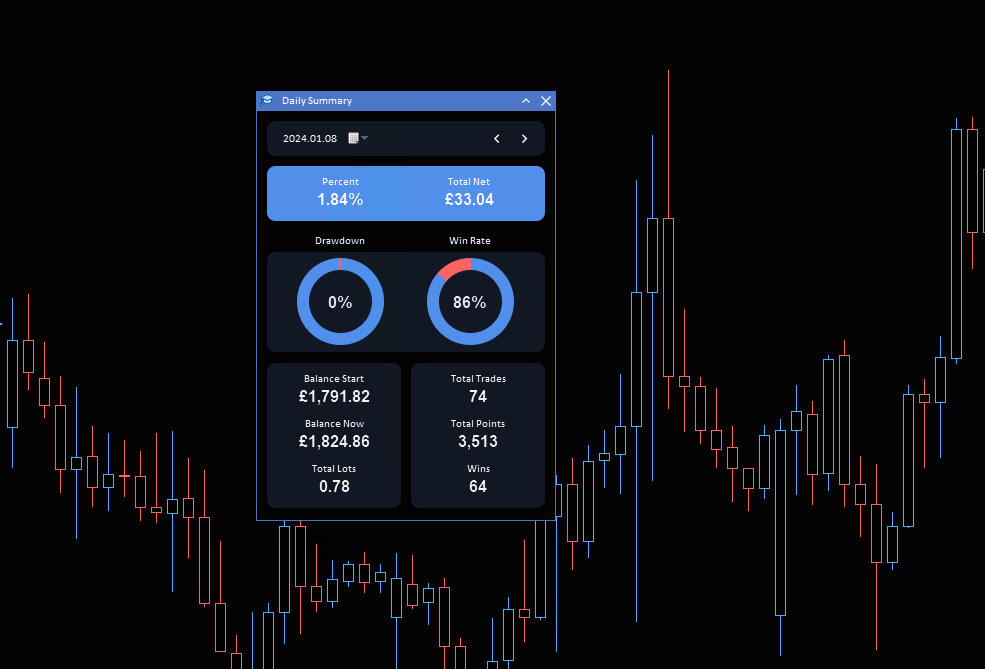
Daily Summary Reports
- Stay Updated with Daily Performance Summaries: Keep a daily check on your activities with detailed end-of-day reports to ensure alignment with your goals.
- Comprehensive Metrics: Track key performance indicators such as total trades, win rate, profit factor, and more to better understand your trading behaviour and outcomes.
Filter by Specific Algorithms
- Filter Trades Using Magic Numbers: Isolate and assess how different trading algorithms or strategies are performing.
- Customizable Graph Filters: On the graph, you can filter data by all trading symbols, select multiple symbols, or focus on specific trading pairs, across any date range.
This tool is designed to simplify your trading experience and help you achieve better results.


A really great tool for providing insights into your trading performance, so that you can understand better what's working, when it's working and potentially how any adjustments may lead to better results. Highly recommended!