High Low Strength
- Indicators
- Smarterbot Software
- Version: 240.715
- Updated: 15 July 2024
- Activations: 5
High Low Strength Indicator
Overview
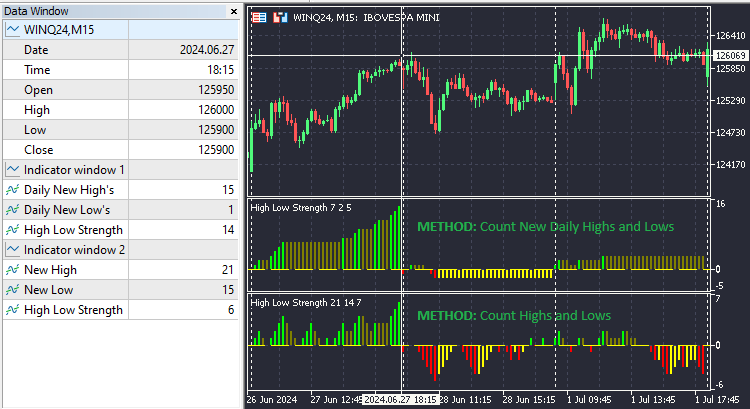
The High Low Strength Indicator is a powerful tool designed to monitor and show how often new daily highs and lows occur within the day, also known as peaks and troughs, or to track the frequency of highs and lows. This indicator highlights market trends and potential reversals, making it essential for investors, day traders, and quantitative traders seeking to enhance their market analysis and trading strategies.
Key Features
The indicator operates in two distinct methods: "Count New Daily Highs and Lows" and "Count Highs and Lows". In "Count New Daily Highs and Lows" mode, it tracks new daily highs and lows, providing insights into daily market peaks and troughs. In "Count Highs and Lows" mode, it counts highs and lows within the current period for immediate price action analysis. Each mode generates three derived indicators: Cumulative Highs, Cumulative Lows, and High Low Strength. The indicator also provides nine useful buffers for comprehensive analysis.
Inputs
Method: Select the mode of operation "Count New Daily Highs and Lows" or "Count Highs and Lows".Main Chart: Select the primary chart to plot as "DayCount Highs" and "DayCount Lows", or "High Low Strength".
How to Use
- Attach the High Low Strength Indicator to your chart.
- Configure the desired values for Method and Main Chart.
- Analyze the generated buffers for detailed market insights and strategy development.
- Buffers include:
- Cumulative New Daily High's (Buffer 0), Cumulative New Daily Low's (Buffer 1), and High Low Strength (Buffer 2) in "Count New Daily Highs and Lows" mode.
- New High (Buffer 0), New Low (Buffer 1), and High Low Strength (Buffer 2) in "Count Highs and Lows" mode.
Benefits
The High Low Strength Indicator enhances market analysis by identifying market trends and reversals with precision. Its flexible configuration adapts to various trading strategies and timeframes, providing comprehensive data for in-depth quantitative analysis and feature engineering. This indicator improves decision-making by offering insights into market strength and direction, enabling strategic entry and exit points. It is developer-friendly, allowing for easy integration into trading algorithms and feature engineering workflows, making it a valuable tool for both traders and developers.