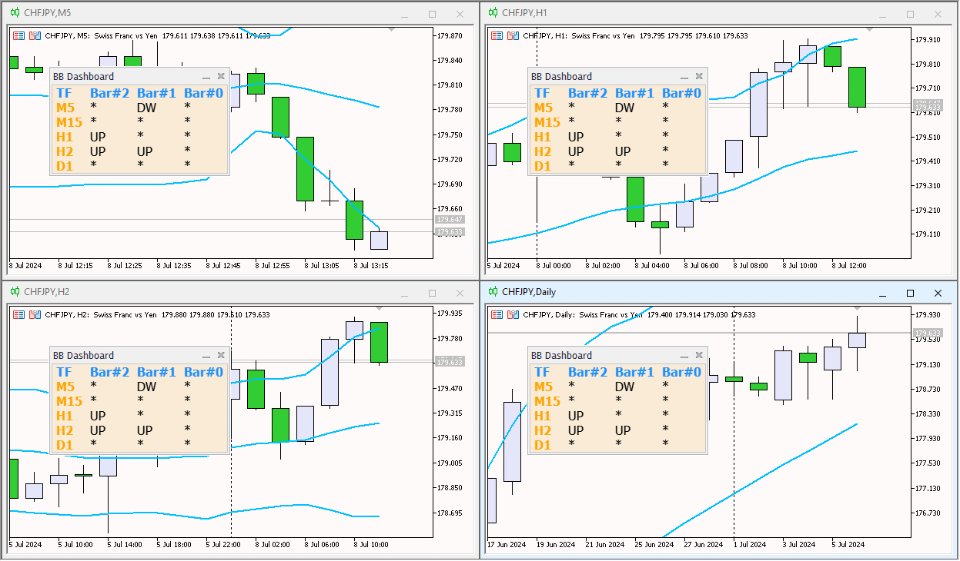
The Bollinger Bands Dashboard indicator offers a convenient and informative way to track Bollinger Bands indicator signals on different timeframes using one panel (Dashboard). This tool allows traders to quickly and easily obtain the information they need, enabling efficient decision-making in the market.
Main characteristics:
1. **Signals Panel**: The Dashboard displays Bollinger Bands signals for selected timeframes, providing users with clear and structured information.
2. **Flexibility in timeframe settings**: Ability to enable or disable any timeframe according to the user's needs. This allows you to focus on the most important time intervals of a specific trading strategy. If all time frames are turned off, the indicator will display three hard-coded time frames, which is done to ensure continuous signal transmission.
3. **Color Settings**: The tool offers advanced color settings for different panel elements:
- Dashboard background
- table header background
- background of the first column in which timeframes are placed
4. **Signal generation**:
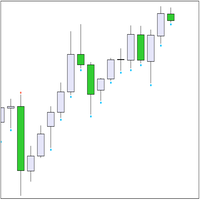
- The "UP" signal is formed when the candle crosses the "Upper" line of the Bollinger Bands indicator from bottom to top.
- The DW signal is formed when the candle crosses the Lower line of the Bollinger Bands indicator from top to bottom.
This indicator will become an indispensable assistant for traders who want to receive instant and accurate Bollinger Bands signals from different timeframes, ensuring comfortable work thanks to flexible settings and a clear interface.

