Volume and MarketProfile Pro
- Indicators
- Raphael Lorenz Baumgartner
- Version: 1.0
- Activations: 5
Volume and MarketProfile Pro
Description:
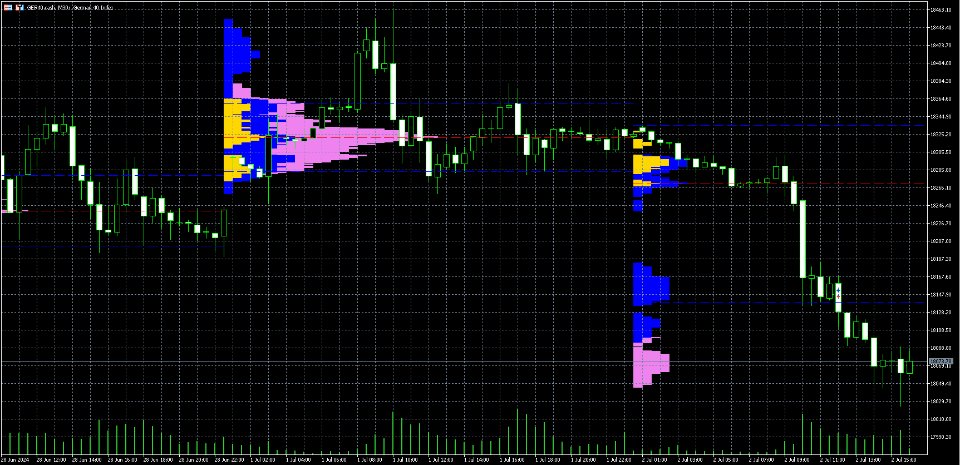
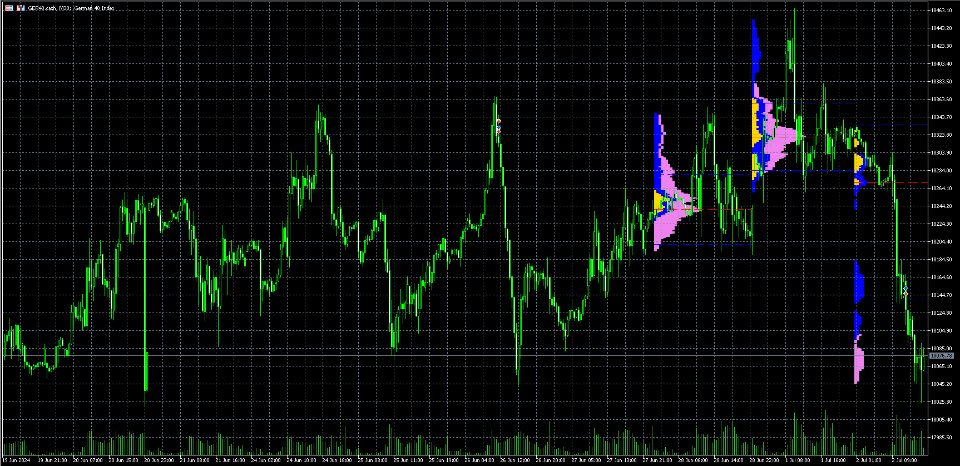
The MarketProfile Indicator provides precise and detailed analysis of trading volume across different price levels. It calculates and displays the volume profile for each trading day, helping you understand market structure and volume distribution to make informed trading decisions.
Key Features:
-
Daily Volume Analysis: The indicator calculates and displays the volume profile for each trading day, allowing you to easily identify volume distribution across different price levels.
-
Point of Control (POC): The POC is displayed as a horizontal line indicating the price level with the highest trading volume of the day, helping you identify important support and resistance levels.
-
Value Area High (VAH) and Value Area Low (VAL): These lines mark the upper and lower boundaries of the value area where 70% of the trading volume occurs. This information is crucial for understanding market activity and potential price reversal points.
-
Session-specific Colors: The indicator provides color-coded bars for different trading sessions (Asia, Europe, and America) so you can easily see in which session most activity took place.
-
Customizable Parameters: You can adjust the number of displayed days, colors, and other parameters to suit your specific needs and trading strategies.
Input Parameters:
- InpStartDate : Start date for the calculation.
- InpShowDays : Number of days to display.
- InpMultiplier : Multiplier for the histogram length.
- InpAsiaSession : Color for the Asian session.
- InpEuropeSession : Color for the European session.
- InpAmericaSession : Color for the American session.
- InpPOCColor : Color for the Point of Control (POC).
- InpValueAreaColor : Color for the Value Area (VAH and VAL).
- InpAsiaStartHour : Start time of the Asian session.
- InpEuropeStartHour : Start time of the European session.
- InpAmericaStartHour : Start time of the American session.
- InpEuropeEndHour : End time of the European session.
Graphs:
- POC: Type: Line, Color: Red
- VAH: Type: Line, Color: Blue
- VAL: Type: Line, Color: Blue
Recommended Instruments and Timeframes:
- Instruments: The MarketProfile Indicator is especially suitable for futures, forex, stocks, and indices.
- Timeframes: The indicator works best on intraday timeframes such as 30 minutes, 1 hour, and 4 hours, but can also be used on daily timeframes.
Step-by-Step Installation and Usage Guide:
-
Installation:
- Download the indicator file and save it in your MetaTrader 5 terminal under MQL5/Indicators .
-
Adding the Indicator to the Chart:
- Open MetaTrader 5.
- Open the desired chart window.
- Go to the Navigator window and find "MarketProfile" under "Indicators".
- Drag and drop the "MarketProfile" indicator into the chart window.
-
Adjusting the Input Parameters:
- An input settings window will appear.
- Adjust the input parameters according to your trading requirements, including the start date, number of displayed days, session colors, and time ranges.
-
Setting Up Graphs:
- In the input settings window, click on the "Drawing Properties" tab.
- Add the following graphs:
- POC: Type: Line, Color: Red
- VAH: Type: Line, Color: Blue
- VAL: Type: Line, Color: Blue
-
Analysis:
- Use the displayed volume profiles to identify key price levels, support and resistance zones, and potential price reversal points.
Advantages:
- Precise Market Insights: Gain a detailed understanding of volume distribution and market structure.
- Better Trading Decisions: Utilize the insights from the indicator to enhance your trading strategies and make informed decisions.
- Time-Saving: The indicator automates complex volume analysis, allowing you to spend more time on actual trading decisions.
Conclusion:
The MarketProfile Indicator is a powerful tool for any serious trader looking to analyze market structure and volume distribution in-depth. It provides precise and valuable insights into market activity and helps you optimize your trading strategies for greater success.
The indicator evaluates the data correctly and very accurately but does not display the AsiaSession in yellow in the histogram. This is due to the automatic validation of MQL5, which does not allow uploading the code with AsiaSession in yellow. If you also want to see the AsiaSession, please send me an email, and I will send you the code. Both codes evaluate the same data, only the visual difference is present.
Contact:
If you have any questions or need assistance, feel free to contact me before purchasing. I am always available to answer your questions and help you get the most out of the MarketProfile Indicator. r.aumbaumgartner@gmail.com


