• Overview
  • Reviews
  • Comments

MultiSymbol and TF Chart Integrated

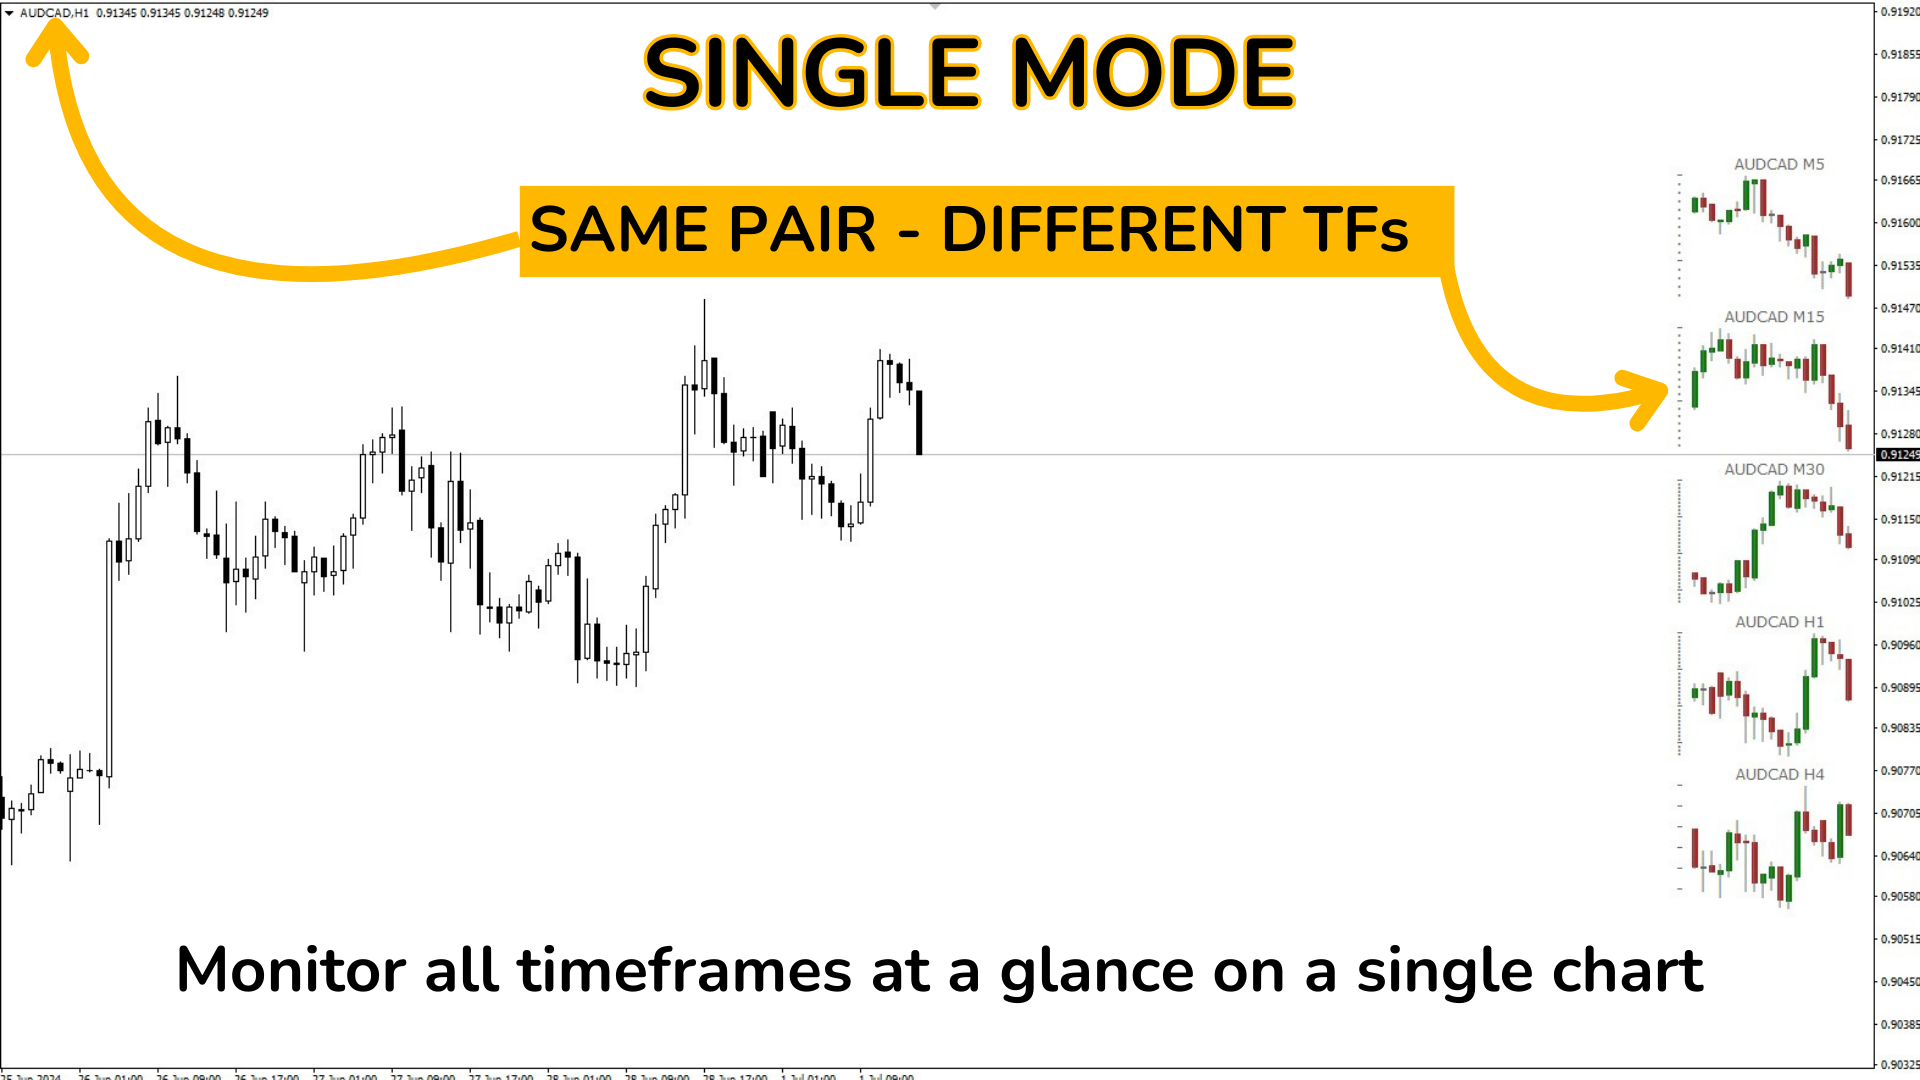
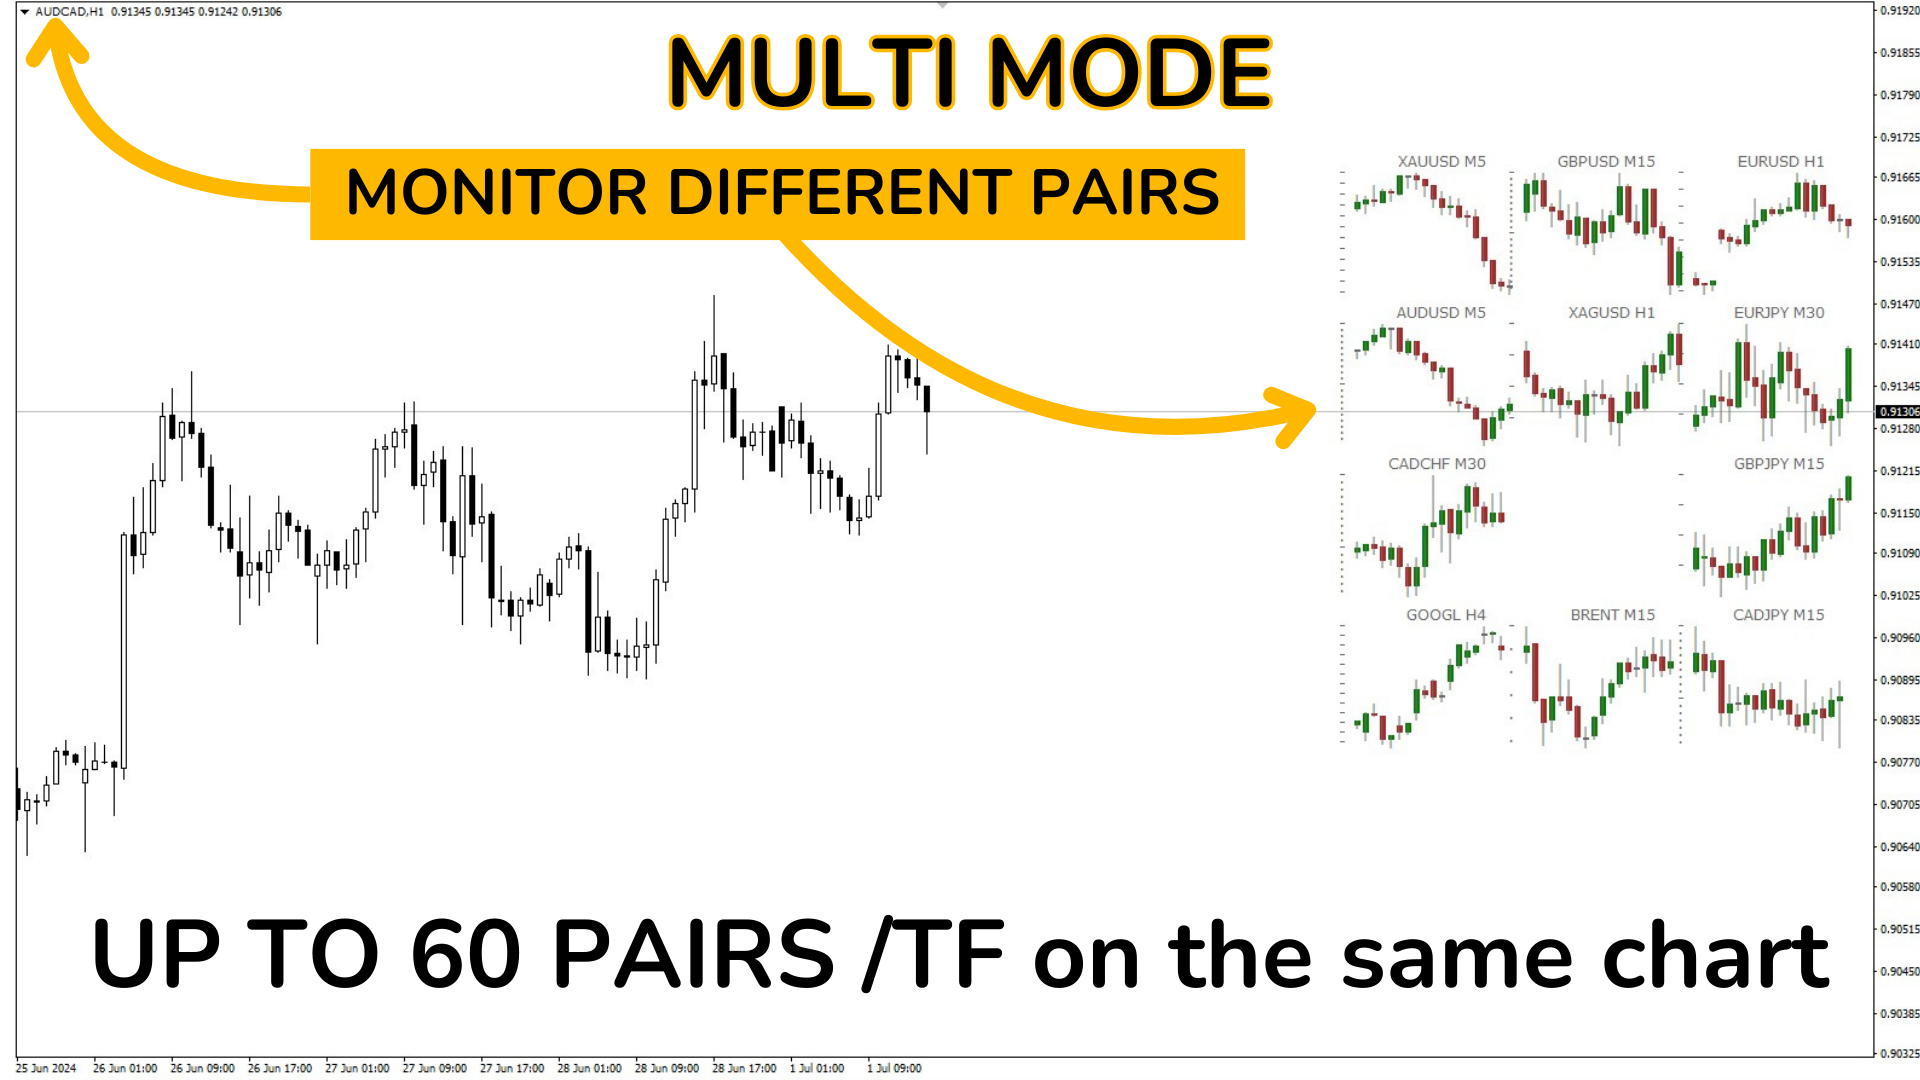
The "MultiSymbol & TF Chart Integrated" indicator is designed to provide a comprehensive market view quickly, allowing you to monitor up to 60 currency pairs in your preferred time frames on a single chart (multiple mode) or view the pair you are trading on all TFs (simple mode).

Main Advantages:

Complete Monitoring: Allows real-time monitoring of all desired pairs on a single chart at a glance.
Time-Saving: Avoids the need to switch between charts, seeing the behavior of each pair in real time.
Trend Analysis: Perfect for trend-following traders, allowing you to see higher time frames to confirm trends before making decisions.
Extreme Customization: Adjust every aspect of the indicator to your specific needs.

Extreme Customization:

Highly Configurable Indicator Parameters:
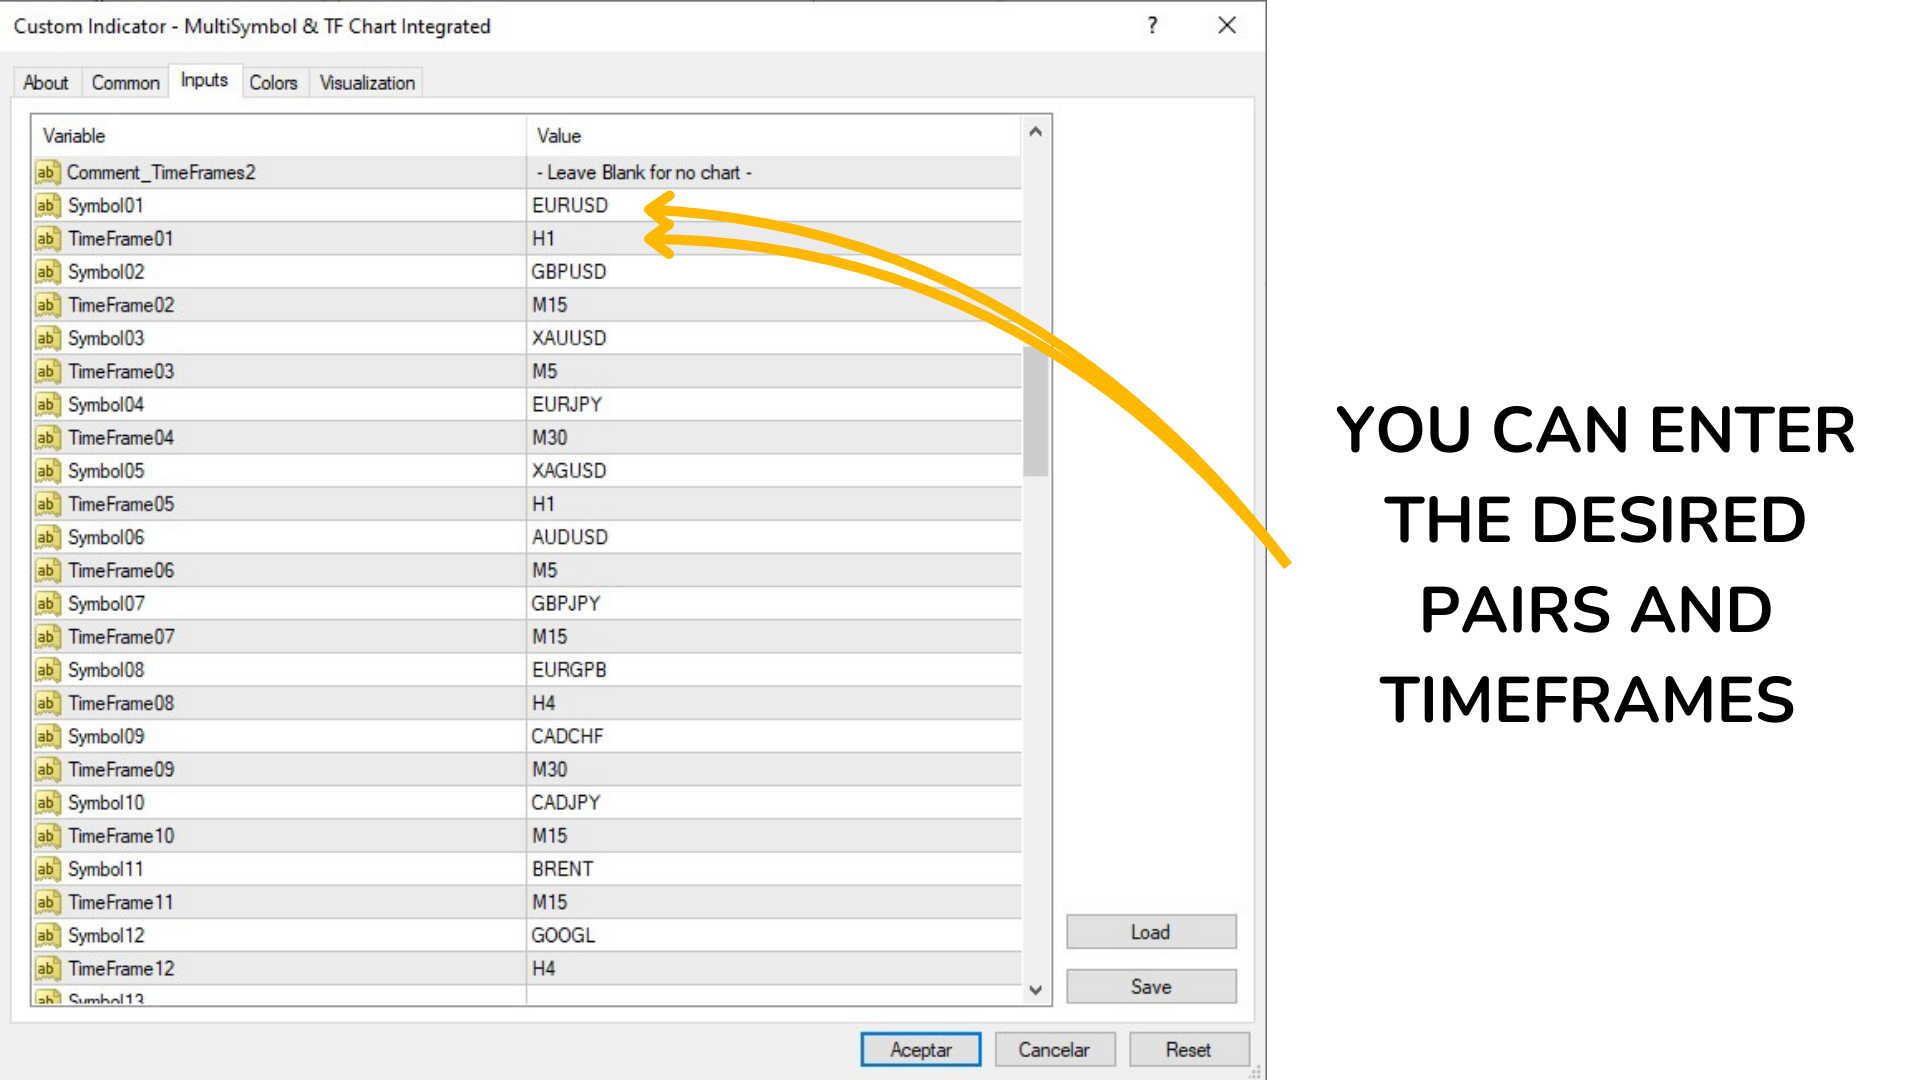
Symbols and Time Frames:

  • Allows configuring up to 60 different symbols.
  • Each symbol can have its own time frame (e.g., M1, M5, M15, M30, H1, H4, D1, W1, MN1).

Display Mode:

  • Simple Mode: Configure a single chart with a specific time frame.
  • Multiple Mode: Configure multiple charts with different symbols and time frames.

Color Configuration:

  • Customizable colors for bullish and bearish candles.
  • Colors of the candle wicks.
  • Color of the price scale.

Scaling and Positioning:

  • Auto-scaling of charts based on the price range and ATR.
  • Positioning of charts using pixel parameters.
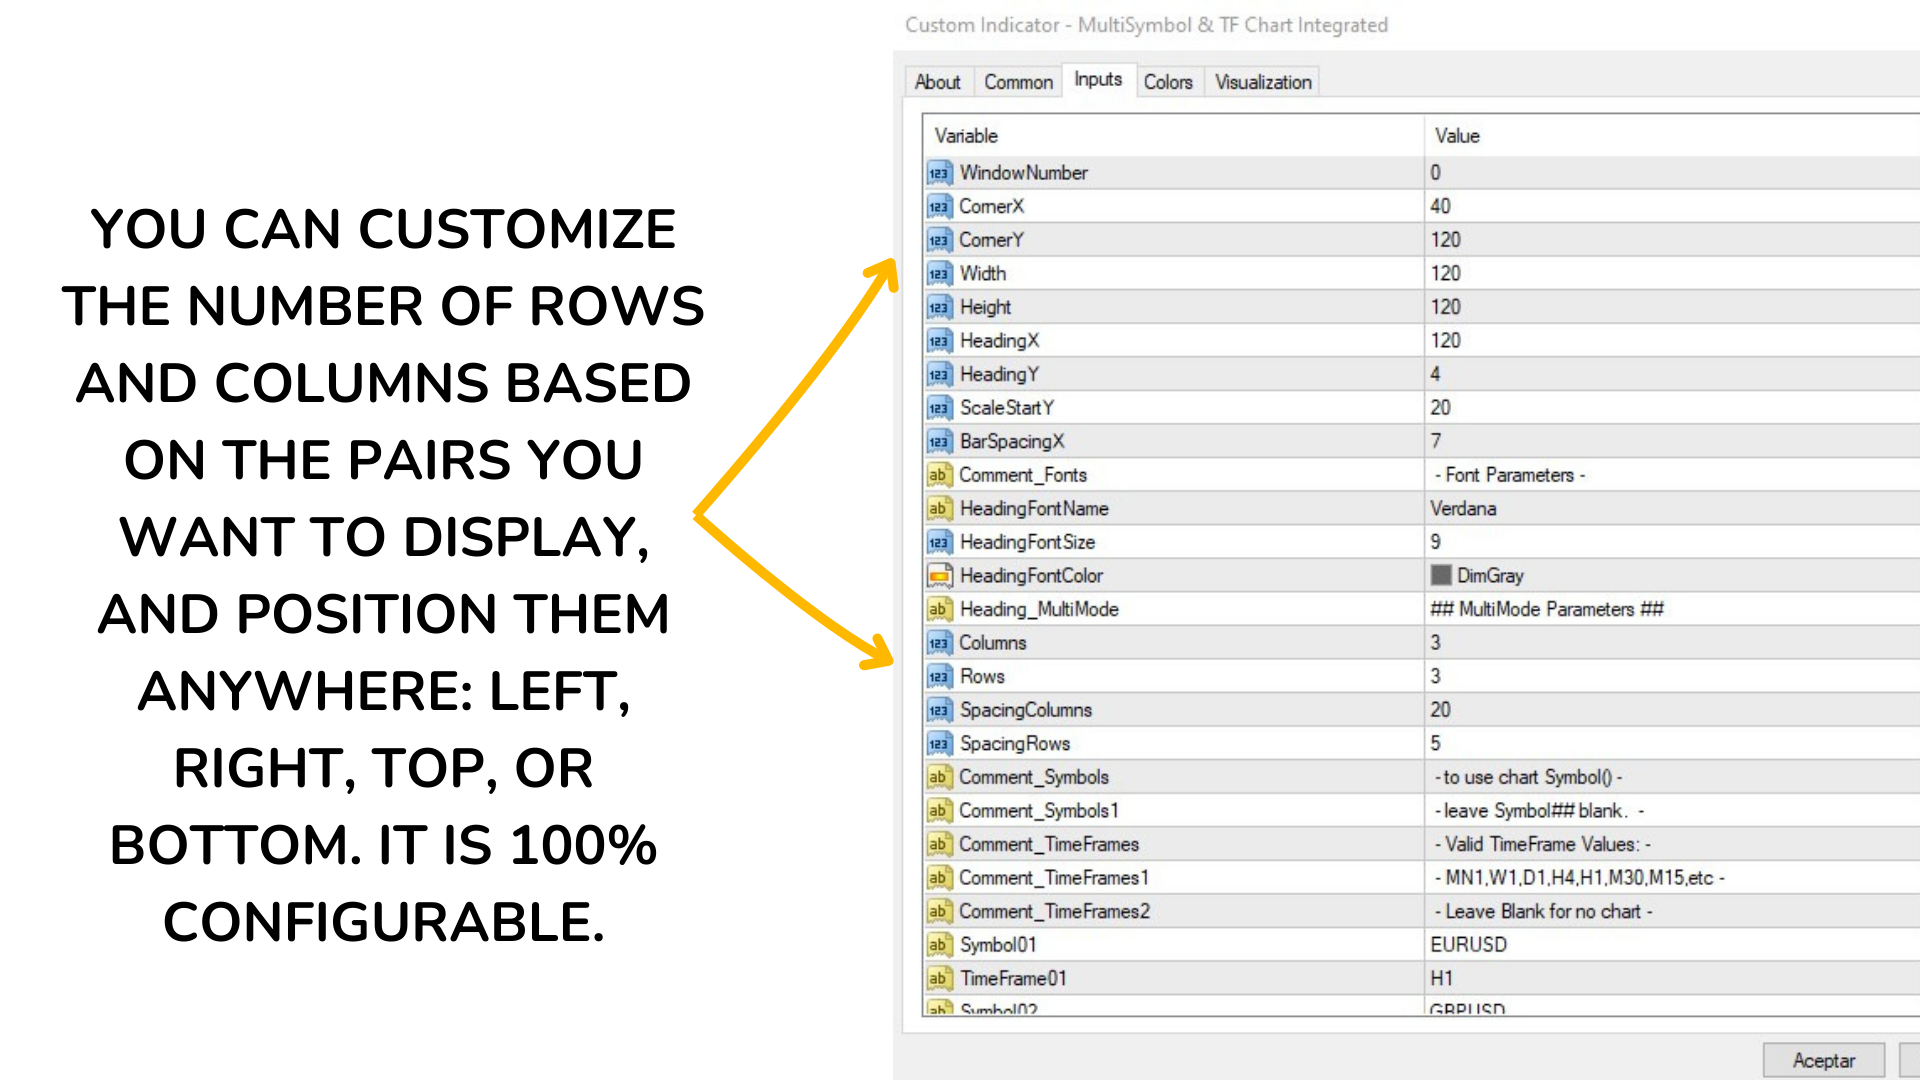
  • Number of rows and columns for chart layout.
  • Spacing between columns and rows.
  • Initial position (X, Y) in the chart window.
  • Chart size in pixels (width and height).

Font Configuration:

  • Font name and size for headings and labels.
  • Font color for headings.

Bar Configuration:

  • Number of bars to display on each chart.
  • Pixel distance between bars.

The "MultiSymbol & TF Chart Integrated" indicator is an essential tool for any trader looking to maximize their time, quickly glancing at all desired pairs and trading on the one that best suits their strategy. Its high customization and ease of use make it an ideal choice for traders of all levels.

Use the guide to adjust the parameters according to your specific needs:

Detailed Description of the Indicator's External Parameters:

Simple Mode
Heading_SingleMode: ## Single Mode Parameters ##

  • Description: Title for the simple mode parameters (single chart).

Comment_TimeFrame: - MN1,W1,D1,H4,H1,M30,M15,etc -

  • Description: Comment indicating valid time frames.

TimeFrame: H4

  • Description: Defines the time frame for the chart in simple mode. You can use values like MN1 (monthly), W1 (weekly), D1 (daily), H4 (4 hours), etc.

Comment_Corner: - TopLeft=0,TR=1,BL=2,BR=3 -

  • Description: Comment explaining the values for the chart position in the window.

Corner: 1

  • Description: Defines the corner of the window where the chart will be located. Possible values: 0 (Top left corner), 1 (Top right corner), 2 (Bottom left corner), 3 (Bottom right corner).

Multiple Mode
Heading_ChartParam: ## Chart Parameters ##

  • Description: Title for the multiple mode parameters (several charts).

MultiMode: true

  • Description: Enables (true) or disables (false) multiple mode.

CandleMode: false

  • Description: Defines whether candles (true) or bars (false) are shown.

BarsToDisplay: 18

  • Description: Number of bars or candles to display on each chart.

AutoScale: true

  • Description: Enables (true) or disables (false) auto-scaling of the charts based on the price range and ATR (Average True Range).

ATRBars: 20

  • Description: Number of bars to consider for ATR calculation.

ATRPixelsY: 30

  • Description: Number of vertical pixels assigned to the ATR for scaling.

Color Configuration
WickColor: DimGray

  • Description: Color of the candle wicks.

BullBarColor: Green

  • Description: Color of the bullish candles or bars.

BearBarColor: FireBrick

  • Description: Color of the bearish candles or bars.

ScaleColor: DimGray

  • Description: Color of the price scale.

Positioning
Comment_Positioning: - Positioning (in Pixels) -

  • Description: Comment indicating that the following parameters are for pixel positioning.

WindowNumber: 0

  • Description: Number of the window where the chart will be displayed. Usually, 0 is the main window.

CornerX: 40

  • Description: Initial X position of the chart in pixels.

CornerY: 120

  • Description: Initial Y position of the chart in pixels.

Width: 120

  • Description: Width of the chart in pixels.

Height: 120

  • Description: Height of the chart in pixels.

Font Configuration
HeadingFontName: Verdana

  • Description: Font name used for headings and labels.

HeadingFontSize: 9

  • Description: Font size for headings and labels.

HeadingFontColor: DimGray

  • Description: Font color for headings.

Multiple Mode Configuration

Heading_MultiMode: ## MultiMode Parameters ##

  • Description: Title for the specific parameters of multiple mode.

Columns: 3

  • Description: Number of columns for the charts.

Rows: 3

  • Description: Number of rows for the charts.

SpacingColumns: 20

  • Description: Pixel spacing between chart columns.

SpacingRows: 5

  • Description: Pixel spacing between chart rows.

Symbols and Time Frames (60 in total)
Symbol01: EURUSD

  • Description: Symbol for the first chart. You can configure up to 60 different symbols.

TimeFrame01: H1

  • Description: Time frame for the first chart. Each symbol can have its own time frame.

These parameters are repeated up to Symbol60 and TimeFrame60, which by default will be empty, and each trader can configure them according to their needs.

The "MultiSymbol & TF Chart Integrated" indicator is highly configurable and allows traders to fully customize the display of multiple symbols and time frames on a single chart, facilitating technical analysis and improving decision-making efficiency.


Recommended products
Gold Venamax - this is a best stock technical indicator. The indicator algorithm analyzes the price movement of an asset and reflects volatility and potential entry zones.   Indicator features: This is a super indicator with Magic and two Blocks of trend arrows for comfortable and profitable trading. Red Button for switching blocks is displayed on the chart. Magic is set in the indicator settings, so that you can install the indicator on two charts displaying different Blocks. Gold Venamax can b
The indicator builds a three-period semaphore and reversal pattern 123 from the extremum. The signal comes at the opening of the second candle. This pattern can be traded in different ways (test point 3, breakout and others). Exit from the channel or breakout of the trendline is the main trigger for finding an entry point. Icons are colored according to Fibonacci levels. Yellow icons indicate a test of a level at which the signal is amplified. Using the multi-currency dashboard, you can track w
Very Accurate Market Trend Indicator! Advantages easy, nice visual and effective trend detection given Always opportunities works on all pairs Forex, Crypto, Commodities, Stocks, Indicies works on all timeframes, but higher TF 1-4Hr is more effective !!!! WARNING !!!! This is trend indicator, it searching for trends in the market! You need patience and you may see loosing trades in a row but that is normal! Do not panick! Once you detect the trends and its confirmed there will be plenty of pi
The Netsrac Correlation Trade Indicator (NCTI) was created to trade correlations between different assets. NCTI offers five different strategies to do this. Five different correlation trading strategies with two or three assets Fast access your assets with one click via asset buttons Your profit/loss at a glance Configurable alerts via screen or mobile You can use the indicator with every timeframe. Higher timeframes give fewer but better signals. If you have some questions or suggestions - ple
RSI Currency Strength Meter uses RSI (Relative Strength Index) to monitor how strong a currency is, or in other words, if it's being bought or sold by the majority compared to the other currencies. It displays the strength-lines of the currencies of the pair (base and counter currency of the chart) with changeable solid lines. Also, you can add up to five additional currencies to the "comparison pool". If you want to look and compare, for example, EUR, USD and JPY, it will only look at the EURUS
Currently 20% OFF ! Best Solution for any Newbie or Expert Trader! This dashboard software is working on 28 currency pairs plus one. It is based on 2 of our main indicators (Advanced Currency Strength 28 and Advanced Currency Impulse). It gives a great overview of the entire Forex market plus Gold or 1 indices. It shows Advanced Currency Strength values, currency speed of movement and signals for 28 Forex pairs in all (9) timeframes. Imagine how your trading will improve when you can watch the e
MA Alignment Scanner
Benedict Jamora
5 (1)
This indicator scans and displays currency pairs that have recently aligned moving averages on a given timeframe. You can configure which pairs the indicator will scan. It also includes all types of alert options. Bullish MA Alignment =  MA1>MA2>MA3>MA4>MA5 Bearish MA Alignment =  MA1<MA2<MA3<MA4<MA5 Features Attach to one chart and scans all the currency pairs configured and visible in the Market Watch Window It can monitor all the available timeframes from M1 to MN1 and sends alerts on ever
Market Meeter
Hapu Arachchilage Tharindu Lakmal
Market Meter is designed for explore various trends in current trading symbol.  with Market Meter  you can get a clear idea about the trends running on different time frames of current symbol. This indicator uses separate window to display its data. Every time when a new trend occurred, Indicator shows it with displaying an arrow on related text area. It's very important to identify the trends of higher time frames when you trading lower time frames. Let the Market Meter  to do the work for you.
BinaryPRO
Ilgiz Kamaev
BinaryPRO- is a multi-currency and multi-timeframe signal indicator, created according to the author's algorithm. It produces high-quality and timely trading signals in the form of arrows on any financial assets traded on Meta Trader 4. It is a good alternative to paid signal services. The indicator can be used with any broker (with 4/5-digit quotes). The received trading signals can and should be used when trading binary options and cryptocurrency. Advantages of BinaryPRO: accurately shows th
Master Scalping M1 is an innovative indicator that uses an algorithm to quickly and accurately determine the trend.The indicator calculates the time of opening and closing positions, the indicator's algorithms allow you to find the ideal moments to enter a deal (buy or sell an asset), which increase the success of transactions for most traders. Benefits of the indicator: Easy to assemble, does not overload the chart with unnecessary information. Can be used as a filter for any strategy. Works on
Forex Gump
Andrey Kozak
2.83 (6)
Forex Gump is a fully finished semi-automatic trading system. In the form of arrows, signals are displayed on the screen for opening and closing deals. All you need is to follow the instructions of the indicator. When the indicator shows a blue arrow, you need to open a buy order. When the indicator shows a red arrow, you need to open a sell order. Close orders when the indicator draws a yellow cross. In order to get the most effective result, we recommend using the timeframes H1, H4, D1. There
Multiple Indicators for Major Currencies The purpose of this indicator is to save time to detect more good trading opportunities by scanning all 28 cross currency pairs of AUD, CAD, CHF, EUR, GBP, JPY, NZD and USD in the same time. There are 5 indicators included in this indicator which are CCI, RSI, Stochastic, MACD and the different between plusDI and minusDI of ADX (PlusDI-MinusDI). The indicator can help in determining the following properties of each currency depending on which indicator
PZ Trend Trading
PZ TRADING SLU
4.8 (5)
Trend Trading is an indicator designed to profit as much as possible from trends taking place in the market, by timing pullbacks and breakouts. It finds trading opportunities by analyzing what the price is doing during established trends. [ Installation Guide | Update Guide | Troubleshooting | FAQ | All Products ] Trade financial markets with confidence and efficiency Profit from established trends without getting whipsawed Recognize profitable pullbacks, breakouts and early reversals The ind
Indicator MTF Qristalium Arrows is a semi - automatic trading system. It works on all currency pairs.  The indicator uses three rules: 1) we trade only on the trend, 2)"buy when everyone sells and sell when everyone buys", 3) the Price always goes against the crowd.  Indicator MTF Arrows Qristalium filter rules across multiple time frames using the built-in indicators. If the trend matches on the selected time intervals, the indicator will give an arrow to enter the market. Then you mak
Blahtech Market Profile
Blahtech Limited
4.61 (18)
Was: $249  Now: $99   Market Profile defines a number of day types that can help the trader to determine market behaviour. A key feature is the Value Area, representing the range of price action where 70% of trading took place. Understanding the Value Area can give traders valuable insight into market direction and establish the higher odds trade. It is an excellent addition to any system you may be using. Blahtech Limited presents their Market Profile indicator for the MetaTrader community. Ins
Think of the rarest pair you can think of. And I assure you that this indicator can compute it's strength. This Currency Meter will literally calculate any currency pairs, either it is the Major Pairs, Metals, CFD's, Commodities, Crypto Currency like Bitcoin/BTC or Ethereum/ETH and even stocks. Just name it and you will get it! There is no currency pair this Currency Meter can solve. No matter how rare or exotic is that currency, it will always be solved by this Currency meter which on a real-ti
Currency Power Meter
Vu Trung Kien
4.74 (19)
Currency Power Meter shows the power of major currencies against each other. The indicator shows the relative strength of currency/pair at the current moment in a period of time (H4, daily, weekly, monthly). It is useful for day traders, swing traders and position traders with suitable period options. Currency power is the true reason of market trend: The strongest currency against the weakest currency will combine into a most trending pair. As we know, trend makes money and all traders love tre
VR Cub
Vladimir Pastushak
VR Cub is an indicator for getting high-quality entry points. The indicator was developed to facilitate mathematical calculations and simplify the search for entry points into a position. The trading strategy for which the indicator was written has been proving its effectiveness for many years. The simplicity of the trading strategy is its great advantage, which allows even novice traders to successfully trade with it. VR Cub calculates position opening points and Take Profit and Stop Loss targe
Gann Square of 144
Taras Slobodyanik
4.33 (6)
The Gann Box (or Gann Square) is a market analysis method based on the "Mathematical formula for market predictions" article by W.D. Gann. This indicator can plot three models of Squares: 90, 52(104), 144. There are six variants of grids and two variants of arcs. You can plot multiple squares on one chart simultaneously. Parameters Square — selection of a square model: 90 — square of 90 (or square of nine); 52 (104) — square of 52 (or 104); 144 — universal square of 144; 144 (full) — "full"
Cloud Eyes is an advanced moving average alert that   will easily monitor the price action based on set moving averages to multiple open charts.  Objective: To monitor multiple open charts and notify traders conveniently in a single display panel when using the moving averages to enter/exit a trades. Features: Monitor price action in two timeframes at the same time Supports simple, exponential, smoothed, linear weighted moving averages Trigger an alert based on candle size (full/body length) Ca
CCI Currency Strength Meter uses CCI (Commodity Channel Index) to monitor how strong a currency is, or in other words, if it's being bought or sold by the majority compared to the other currencies. If you load this indicator on a chart, it will first display the strength-lines of the currencies (base and counter currency of the chart) with changeable solid lines. Also, you can add up to five additional currencies to the "comparison pool," that already has the base and the profit (counter) curren
Marketfx Profile
Mahmoud Helmy Sedik Mohamed Mansour
A   Market Profile   is an intra-day charting technique (price vertical, time/activity horizontal) devised by J. Peter Steidlmayer, a trader at the   Chicago Board of Trade   (CBOT), ca 1959-1985. Steidlmayer was seeking a way to determine and to evaluate   market value   as it developed in the day time frame. The concept was to display price on a vertical axis against time on the horizontal, and the ensuing graphic generally is a bell shape--fatter at the middle prices, with activity trailing o
The indicator builds current quotes, which can be compared with historical ones and on this basis make a price movement forecast. The indicator has a text field for quick navigation to the desired date. Options: Symbol - selection of the symbol that the indicator will display; SymbolPeriod - selection of the period from which the indicator will take data; IndicatorColor - indicator color; Inverse - true reverses quotes, false - original view; Next are the settings of the te
Daily Average Retracement Dashboard is an indicator that allows you to monitor multiple currency pairs at one time. This indicator is mainly for strategies that trade price retracement based on Resistance 3/4 or Support 3/4. After applying this indicator to the chart window, it will hide the chart and display the currency pairs in a table form. There are several data shown on the table that will help trader know when to analyze the currency and do trade using retracement. The indicator will show
This multicurrency indicator is the Lite version of the Cosmic Diviner Reversal Zone Pro indicator. The indicator is based on original formulas for analyzing the volatility and price movement strength. This allows determining the overbought and oversold states of instruments with great flexibility, as well as setting custom levels for opening buy or sell orders when the overbought or oversold values of the instruments reach a user-defined percentage. A huge advantage of Reversal Zone Lite is the
Currency Strength Meter is the easiest way to identify strong and weak currencies. This indicator shows the relative strength of 8 major currencies + Gold: AUD, CAD, CHF, EUR, GBP, JPY, NZD, USD, XAU. Gold symbol can be changed to other symbols like XAG, XAU etc. By default the strength value is normalised to the range from 0 to 100 for RSI algorithm: The value above 60 means strong currency; The value below 40 means weak currency; This indicator needs the data of all 28 major currency pair
Trendiness Index
Libertas LLC
5 (3)
"The trend is your friend" is one of the best known sayings in investing, because capturing large trendy price movements can be extremely profitable. However, trading with the trend is often easier said than done, because many indicators are based on price reversals not trends. These aren't very effective at identifying trendy periods, or predicting whether trends will continue. We developed the Trendiness Index to help address this problem by indicating the strength and direction of price trend
Signal Strength Meter
Naim El Hajj
4.17 (6)
The Signal Strength Meter is a Multi-Currency, Dual Timeframe Interactive Indicator, which calculates the strength of buy and sell signals, and displays a score for each symbol on a display board. Get a 7-Day Free Trial Version:  Click  Here  (Full Access to The Indicator for 7 Days) Check Video Below For Complete Demonstration, and User Manual here . Key Features: Allows you to see multiple currency signals from one chart Analyses the signals from more than a dozen classic indicators Identi
Fisher Yur4ik Indicator - Unlock Precise Trading Insights Explore a world of precision in trading with the "Fisher Yur4ik Indicator." This advanced tool is designed to provide traders with accurate insights into price trends, allowing for well-informed decisions and enhanced profitability. Basic Details : Indicator Type : Fisher Yur4ik Indicator Key Metrics : Real-time analysis of price trends and potential turning points. Customization : Fully customizable settings to align with your unique tra
The indicator displays the data of the Stochastic oscillator from a higher timeframe on the chart. The main and signal lines are displayed in a separate window. The stepped response is not smoothed. The indicator is useful for practicing "manual" forex trading strategies, which use the data from several screens with different timeframes of a single symbol. The indicator uses the settings that are identical to the standard ones, and a drop-down list for selecting the timeframe. Indicator Parame
Buyers of this product also purchase
TPSpro RFI Levels
Roman Podpora
4.86 (21)
Reversal First Impulse levels (RFI)    INSTRUCTIONS        RUS       -       ENG              R ecommended to use with an indicator   -   TPSpro  TREND PRO -  Version MT5 A key element in trading is zones or levels from which decisions to buy or sell a trading instrument are made. Despite attempts by major players to conceal their presence in the market, they inevitably leave traces. Our task was to learn how to identify these traces and interpret them correctly. Main functions: Displaying activ
AT Forex Indicator MT4
Marzena Maria Szmit
5 (2)
The AT Forex Indicator MT4 is a sophisticated trading tool designed to provide traders with a comprehensive analysis of multiple currency pairs. This   powerful indicator   simplifies the complex nature of the forex market, making it accessible for both novice and experienced traders. AT Forex Indicator uses   advanced algorithms   to detect trends, patterns and is an essential tool for traders aiming to enhance their forex trading performance. With its robust features, ease of use, and reliabl
Indicator : RealValueIndicator Description : RealValueIndicator is a powerful tool designed specifically for trading on the EURUSD pair. This indicator analyzes all EUR and USD pairs, calculates their real currency strength values, and displays them as a single realistic value to give you a head start on price. This indicator will tell you moves before they happen if you use it right. RealValueIndicator allows you to get a quick and accurate overview of the EURUSD currency pair tops and bottoms,
Atomic Analyst
Issam Kassas
5 (3)
First of all Its worth emphasizing here that this Trading Indicator is   Non-Repainting , Non Redrawing and Non Lagging Indicator   Indicator, Which makes it ideal from both manual and robot trading.  User manual: settings, inputs and strategy . The Atomic Analyst  is a PA Price Action Indicator that uses Strength and Momentum of the price to find a better edge in the market. Equipped with Advanced filters which help remove noises and false signals, and Increase Trading Potential. Using Multipl
TrendMaestro
Stefano Frisetti
5 (3)
note: this indicator is for METATRADER4, if you want the version for METATRADER5 this is the link:  https://www.mql5.com/it/market/product/108106 TRENDMAESTRO ver 2.4 TRENDMAESTRO recognizes a new TREND in the bud, he never makes mistakes. The certainty of identifying a new TREND is priceless. DESCRIPTION TRENDMAESTRO identifies a new TREND in the bud, this indicator examines the volatility, volumes and momentum to identify the moment in which there is an explosion of one or more of these data a
JULY OFFER 80% OFF next price for unlimited version will be 17000$. This is the only time you can get this institutional and professional indicator at this price for unlimited version. Don't dare to miss this. The tool I am about to introduce to you you can't compare it with other tools due to its strategy and accuracy level in predicting the next price directional movement . This tool is designed for serious traders who have decided to make a difference through trading. Be the next person to wi
Enigmera
Ivan Stefanov
5 (4)
ENIGMERA: The core of the market (If the demo of mql5.com doesn't working and you want to try Enigmera please message me.) Introduction This indicator and trading system is a remarkable approach to the financial markets . ENIGMERA uses the fractal cycles to accurately calculate support and resistance levels. It shows the authentic accumulation phase and gives direction and targets.  A system that works whether we are in a trend or a correction.   How does it operate? ENIGMERA comprises of fol
Cycle Sniper
Elmira Memish
4.41 (37)
NEW YEAR SALE PRICE FOR LIMITED TIME!!! Please contact us after your purchase and we will send you the complimentary indicators to complete the system Cycle Sniper is not a holy grail but when you use it in a system which is explained in the videos, you will feel the difference. If you are not willing to focus on the charts designed with Cycle Sniper and other free tools we provide, we recommend not buying this indicator. We recommend watching the videos about the indiactor and system before pu
Welcome to the world of SMC (Smart Money Concepts) Trading, where we empower traders with the tools and knowledge to make smarter trading decisions. Our latest addition to our suite of trading tools is the SMC Trading Pro indicator, version 1.0. Key Features: Major Market Structure Identification with BODY break. Order Block must be in Major Swing ( not Small Swing ). Order Block with Fair Value Gap Detection. Order Block in Discount | Premium zone. Filter for only Bullish, Bearish or All Order
ZeusArrow Smart Liquidity Finder  Smart Liquidity Finder is Ai controlled indicator based on the Idea of Your SL is My Entry. It scan and draws the major Liquidity areas on chart partitioning them with Premium and Discount Zone and allows you find the best possible trading setups and help you decide the perfect entry price to avoid getting your Stop Loss hunted . Now no more confusion about when to enter and where to enter. Benefit from this one of it's kind trading tool powered by Ai an trade
A. What is A2SR ?   * It's a leading technical indicator (no repaint, no lagging). -- Guidance : -- at   https://www.mql5.com/en/blogs/post/734748/page4#comment_16532516 -- and  https://www.mql5.com/en/users/yohana/blog A2SR has a special technique in determining the levels of Support ( demand ) and Resistance ( supply ) . Unlike the ordinary way that we seen on the net, A2SR has a original concept in determining actual SR levels. The original technique was not taken from the internet,
Beast Super Signal
Dustin Vlok
4.76 (101)
Limited special now on! Was $249, now only $179!  Looking for a powerful forex trading indicator that can help you identify profitable trading opportunities with ease? Look no further than the Beast Super Signal.  This easy-to-use trend-based indicator continuously monitors the market conditions, searching for new developing trends or jumping in on existing ones. The Beast Super Signal gives a buy or sell signal when all internal strategies align and are in 100% confluence with each other,
FxBears Powers
Rachid Lafhil
3 (2)
️️ Attention:      The price will soon be raised to what it was before ($500).      No more losses with this indicator, test it for years ago and see if there is losses in one day results. but before testing it please see the explaining video down here.    FxBears Powers is working on all forex pairs, metals, commodities, futures, indices, energies, crypto, and everything...and on all timeframes from M1 to MN.   It's based on supply and demand zones, price action, and some internal indicators,
NAM Order Blocks
NAM TECH GROUP, CORP.
5 (1)
MT4 Multi-timeframe Order Blocks detection indicator. Features - Fully customizable on chart control panel, provides complete interaction. - Hide and show control panel wherever you want. - Detect OBs on multiple timeframes. - Select OBs quantity to display. - Different OBs user interface. - Different filters on OBs. - OB proximity alert. - ADR High and Low lines. - Notification service (Screen alerts | Push notifications). Summary Order block is a market behavior that indicates order collection
ON Trade Optuma Astro
Abdullah Alrai
5 (4)
This is an astronomy indicator for the MT4 platform like optuma program that performs a variety of functions. It uses complex algorithms to perform its own calculations, which are so accurate. The indicator has a panel that provides astronomical information such as planets' geo/heliocentric cords, distance of sun/earth, magnitude, elongation, constellation, ecliptic cords, equatorial cords, and horizontal cords depending on  the vertical line that generated by the indicator depend on the time va
Gold Channel is a volatility-based indicator, developed with a specific timing algorithm for the XAUUSD pair, which consists of finding possible corrections in the market. This indicator shows two outer lines, an inner line (retracement line) and an arrow sign, where the theory of the channel is to help identify overbought and oversold conditions in the market. The market price will generally fall between the boundaries of the channel. If prices touch or move outside the channel it is a tra
Please send me Direct message on MQL5 CHAT after purchasing the Indicator for Training and Installation Support There are some additional files that is important to use with the Indicator . So be sure to contact me after purchasing the Indicator So that I can add you for training and support . If you find any difficulty with installation then send me Direct message here So that I can connect with you via Anydesk or Teamview for the product installation. " Smart Order Block Indicator " to find
The indicator " ZigZag on Trend " is an assistant in determining the direction of price movement, as well as a calculator of bars and points. It consists of a trend indicator, which follows the price direction by the trend line presented in the form of a zigzag and a counter calculating the number of bars traversed in the direction of the trend and the number of points on the vertical scale. (calculations are carried out by the opening of the bar) The indicator does not redraw. For convenience,
ECM Channel MT4
Paulo Rocha
5 (1)
ECM Elite Channel is a volatility-based indicator, developed with a specific time algorithm, which consists of finding possible corrections in the market. This indicator shows two outer lines, an inner line (retracement line) and an arrow sign, where the channel theory is to help identify overbought and oversold conditions in the market. The market price will generally fall between the boundaries of the channel. If prices touch or move outside the channel, it's a trading opportunity. The
Introduction to Fractal Pattern Scanner Fractal Indicator refers to the technical indicator that makes use of the fractal geometry found in the financial market. Fractal Pattern Scanner is the advanced Fractal Indicator that brings the latest trading technology after the extensive research and development work in the fractal geometry in the financial market. The most important feature in Fractal Pattern Scanner is the ability to measure the turning point probability as well as the trend probabi
How to use Pair Trading Station Pair Trading Station is recommended for H1 time frame and you can use it for any currency pairs. To generate buy and sell signal, follow few steps below to apply Pair Trading Station to your MetaTrader terminal. When you load Pair Trading Station on your chart, Pair Trading station will assess available historical data in your MetaTrader platforms for each currency pair. On your chart, the amount of historical data available will be displayed for each currency pai
XQ Indicator MetaTrader 4
Marzena Maria Szmit
3.67 (3)
Step into the realm of Forex trading with confidence and precision using XQ, a cutting-edge Forex indicator designed to elevate your trading game to unprecedented heights. Whether you're a seasoned trader or just stepping into the world of currency exchange,   XQ Forex Indicator   empowers you with the insights and signals needed to make informed trading decisions. The signal conditions are a combination of three indicators, and XQ Forex Indicator only display  medium and long-term trends . The
Gann Signal
Kirill Borovskii
Gann Signal is a very simple indicator at first glance, but hidden inside is many years of experience in studying W.D.Ganna methods. The indicator gives accurate BUY/SELL signals, without redrawing. The indicator is very easy to use. All you need to do is attach it to your chart and follow its recommendations. The indicator constantly analyzes the market for entry opportunities. When such an opportunity appears, the indicator gives a signal in the form of an arrow. I repeat, all signals are NOT
Introducing the Miraculous Forex Indicator: Unleash the Power of Precision Trading Are you tired of searching for the perfect forex indicator that truly delivers exceptional results across all time frames? Look no further! The Miraculous Forex Indicator has arrived to revolutionize your trading experience and propel your profits to new heights. Built upon a foundation of cutting-edge technology and years of meticulous development, the Miraculous Forex Indicator stands as the pinnacle of str
Shepherd Gann Squares
Abdullah Alrai
4.9 (10)
Download user manual from : https://ontrd.com/our-books/ MT5 Version : https://www.mql5.com/en/market/product/30284 This indicator is a market analysis method based on the "Mathematical formula for market predictions" article written by W.D. Gann depending on square of 144 90 and 52 . And square of 9 With method by Dr.hamada salam about square of 9 and its relations with channel and star of that square User Manual: Add Your review And contact us to get the user manual You Can Buy Full M
Dragon Multi Indicator MT4
Mansour Babasafary
5 (4)
3 Indicators in 1 indicator Strategy based on price action Made specifically for the best forex currency pairs Can be used in the best time frame of the market at a very reasonable price This indicator is basically 3 different indicatos . But we have combined these 3 indicators in 1 indicator so that you can use 3 indicators at the lowest price. All three strategies are based on price action. But based on different trends. Long term, medium term and short term Attributes : No repaintin
Supply and Demand Dashboard PRO
Bernhard Schweigert
4.82 (22)
Currently 20% OFF ! This dashboard is a very powerful piece of software working on multiple symbols and up to 9 timeframes. It is based on our main indicator (Best reviews:   Advanced Supply Demand ). The dashboard gives a great overview. It shows: Filtered Supply and Demand values including zone strength rating, Pips distances to/and within zones, It highlights nested zones, It gives 4 kind of alerts for the chosen symbols in all (9) time-frames. It is highly configurable for your personal
Introduction to X3 Chart Pattern Scanner X3 Cherart Pattern Scanner is the non-repainting and non-lagging indicator detecting X3 chart patterns including Harmonic pattern, Elliott Wave pattern, X3 patterns, and Japanese Candlestick patterns. Historical patterns match with signal patterns. Hence, you can readily develop the solid trading strategy in your chart. More importantly, this superb pattern scanner can detect the optimal pattern of its kind. In addition, you can switch on and off individu
System Trend Pro
Aleksandr Makarov
System Trend Pro - This is the best trend trading indicator!!! The indicator no repaint!!!   The indicator has   MTF   mode, which adds confidence to trading on the trend (   no repaint   ). How to trade? Everything is very simple, we wait for the first signal (big arrow), then wait for the second signal (small arrow) and enter the market in the direction of the arrow. (See screens 1 and 2.) Exit on the opposite signal or take 20-30 pips, close half of it, and keep the rest until the oppo
Max Paynex
Abdulkarim Karazon
Max Payne is a reversal/trend signal indicator that gives signals in a form of an arrow, this indicator gives its signal on same bar close, this indicator can dropped multiple times on the chart with different periods to get double/triple confirmation of signals the indicator is highly adjustable to fit any trading style while it never repaints or back paint, you will get the full system shown in screenshots after purchase along side used templates. ----------------- How to trade : wait until y
More from author
Aurum Apex Mt4 EA
Martin Alejandro Bamonte
Aurum Apex EA Description Aurum Apex EA is a robust 100% automated trading tool designed for the MT4 Platform. It performs real-time market analysis, detecting various trading opportunities. Suitable for traders of all levels, Aurum Apex EA offers three risk modes, adjustable via the Risk parameter: Risk = 0.1 (Low Risk): Ideal for new traders who are unfamiliar with gold movements. This setting minimizes surprises while building confidence. Risk = 0.2 (Medium Risk): Recommended for experienced
NextCandlePredictor Indicator NextCandlePredictor, a signal indicator with alert that does not repaint, does not change its color, does not move, does not disappear, and has no lag. It will help you identify the direction of the next or upcoming candles in any timeframe. Highly recommended for high volatility markets like New York, London, or even the overlap of both. Main Features: Versatility in Timeframes: Provides quick and accurate signals in any timeframe, from M1 to H1 and beyond. Clear B
The MTFMA (Multi-Timeframe Moving Averages) indicator uses multiple moving averages (MAs) across different timeframes to provide buy and sell signals (which do not repaint) in a separate window from the main chart. It is versatile and easy to interpret, suitable for both scalping on smaller timeframes and long-term trading on larger timeframes. Why is it Multiframe? The term multiframe refers to the indicator's ability to use and combine data from multiple timeframes. The MTFMA calculates and di
BullsEye Signal NoRepaint
Martin Alejandro Bamonte
BullseyeSignal – NoRepaint is a signal that, as the name suggests, never repaints under any circumstances. The signal is issued on the same candle observed in the image. It is ideal for highly volatile markets such as forex, cryptocurrencies, stocks, indices, and futures. You will only see a green arrow for buying and a red arrow for selling, but there are many indicators working together behind them to provide a more simplified trading experience. It is specifically designed to provide precise
Scalping Signal NO Repaint NO Lag
Martin Alejandro Bamonte
5 (1)
The "Scalping Signal No Repaint No Lag" is the only indicator on the market that automatically loads all necessary indicators when dragged onto any chart, without needing any templates or additional indicators. It configures the chart to look exactly like the provided image. This indicator guarantees no repainting and no lag, making it ideal for scalping strategies across all pairs and timeframes (TF). Features Automatic Indicator Loading: Automatically loads all necessary additional indicators
Clear Breakout
Martin Alejandro Bamonte
The "Breakout Buy-Sell" indicator is designed to identify and highlight potential buy and sell opportunities based on price breakouts during different market sessions (Tokyo, London, and New York). This indicator helps traders clearly visualize buy and sell zones, as well as take-profit (TP) and stop-loss (SL) levels. Usage Strategy The indicator can be used as follows: Initial Setup : Select the market session and adjust the GMT offset. Market Visualization : Observe the breakout boxes drawn at
GbpUsd Pip Hunter EA
Martin Alejandro Bamonte
GBPUSD Pip Hunter EA Key Features: Optimized for GBPUSD on M15 Timeframe : Specifically designed and tested for the GBPUSD pair on a 15-minute chart. Minimum Recommended Account Size : Requires a minimum account balance of $1000 to ensure low drawdowns. Spread Compatibility : Best used with low spread or ECN accounts to maximize profitability. Risk Management : Includes an option to disable the Exponential Lot feature by setting it to 1.0, based on your trading needs. Customizable Parameters : O
Pairs and TF Changer
Martin Alejandro Bamonte
Are you tired of switching between multiple charts to monitor different currency pairs and timeframes? The Pairs and TF Changer indicator is here to revolutionize your trading experience! Once you have loaded all the indicators for your strategy, add the Pairs and TF Changer to the chart. If necessary, you can then adjust its position, colors, or the number of columns it displays! Key Features: Seamless Integration : Integrate this indicator into your trading strategy effortlessly. With jus
GO Trend MultiTimeFrame
Martin Alejandro Bamonte
The "GoTrend Multi-Timeframe" indicator is an essential tool for traders looking for a quick and efficient way to assess the overall and specific trends of a currency pair across different timeframes. This indicator allows traders to gain a clear and comprehensive view of market direction at a glance, optimizing decision-making and enhancing the effectiveness of their trading strategies. Main Features: Multi-Timeframe Analysis: This indicator provides an exhaustive analysis of six different
Filter:
No reviews
Reply to review