Power of 3 ICT Series
- Indicators
- Juan Pablo Castro Forero
- Version: 1.2
- Updated: 6 August 2024
- Activations: 20
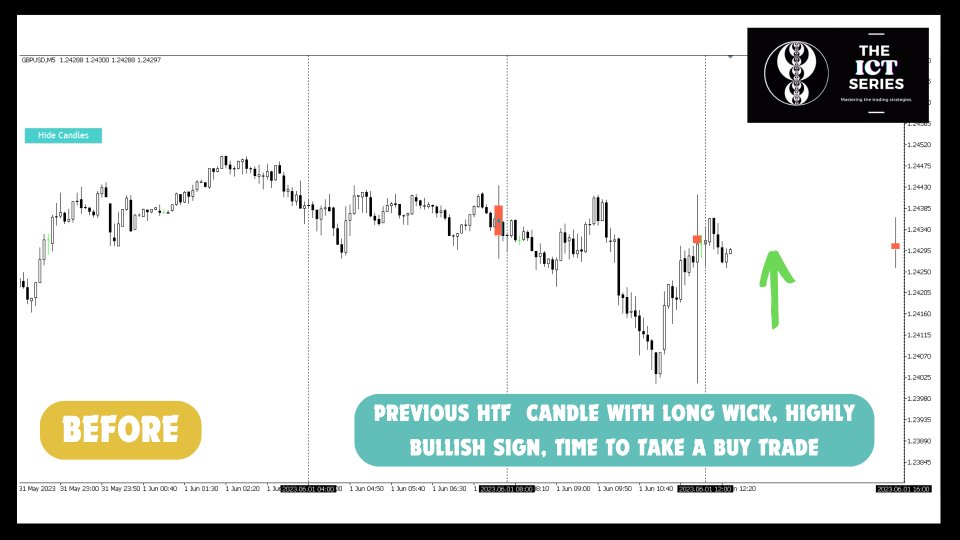
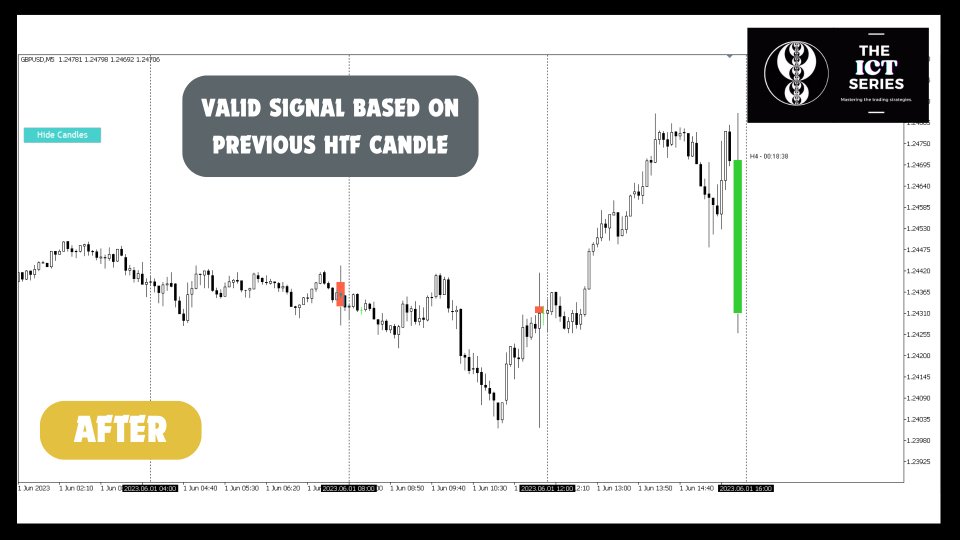
The Power of 3 ICT is the best tool to help you keep an eyer on HTF while trading on lower timeframes. This indicator will allow you to see up to 2 different HTF candles on your LTF chart, that way you always know how the current price action is looking in the higher timeframes and if you are taking your trade following the higher timeframe trend.
What can you do with The Power of 3?
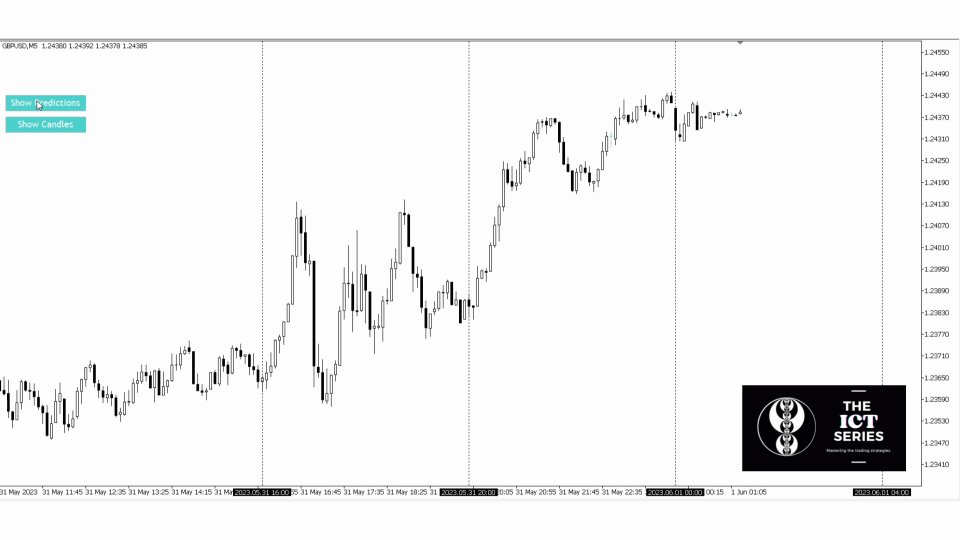
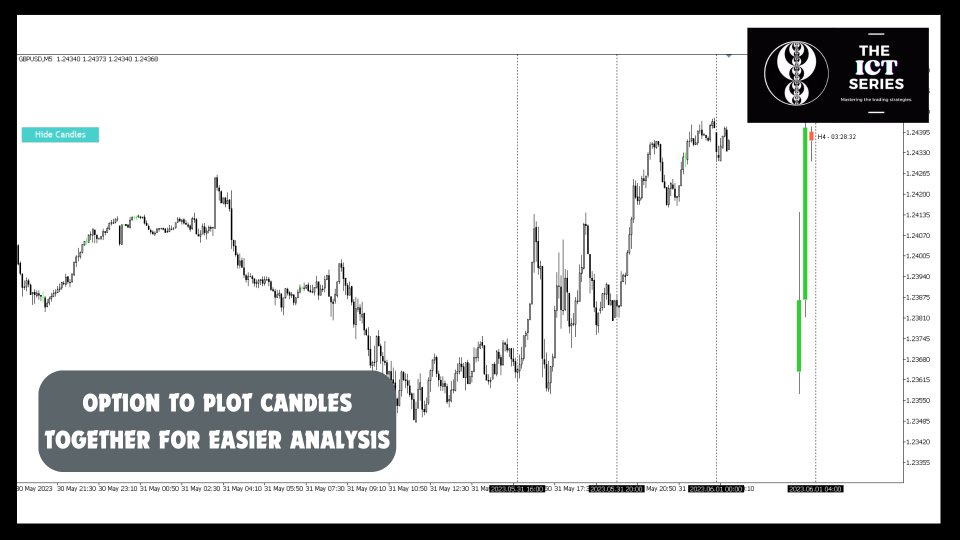
See the current candles of higher timeframes and have a easy look at the main trends. Also show as many previous candles as you want, helping you to identify the HTF trends easier and align your trade ideas with that trend. Additionally, you have the option to plot them on their respective ranges of time, and plot vertical lines to determine the start and end of each candle, which lets you see how each candle was formed and what is the most likely way for the current candle to be formed and in which direction will go.
Why to use The Power of 3?
Align this indicator with other indicators like the liquidity indicator and you will have a simple and effective strategy which can take your trading to the next level. With the help of the liquidity indicator, you will be able to find the liquidity areas from which you expect reaction and trades to happen. This aligned with the HTF Bias and the power of 3 on the current candle gives you all the information to take a high probability trade.
As it this was not enough, the indicator has a prediction model which will allow you to see a polyline displaying the possible price formation of the current candle as well the possible times where the high and low of the candle will take place.
Other features
- Vertical lines in candles start and end times.
- Alerts for candle start.
- Possibility to plot all past HTF candles together for a clean approach.
Additionally, to make the use of the indicator easier it has full customization, allowing you to set your favorite colors, line styles, labels names and times. This way you can really use the indicators and enjoy trading your way.
This indicator is part of the ICT SERIES collection which can be found here. Use simultaneously with the other products to guarantee better results, as well if you have any ideas, concepts, or strategies which you would like to see in the ICT SERIES, please send it to us on direct message or comment, we would be happy to develop it and test it with you or join our community of traders who share insights, strategies, and support.
The series main focus are the Inner Circle Trader concepts (ICT ), Smart money concepts, institutional trading, Liquidity concepts, Turtle soups, IPDA, Wyckoff. Join our community.



A very well designed indicator. It has many user configurable options. The Show/Hide feature is great. Juan is very prompt in responding and shows great commitment to adding new features that enhance the product. With this indicator ,it is very easy to visualize the Higher Time Frame activity .It brings more clarity to the analysis .The options to draw OHLC bars is excellent and is very rare.A very professionally designed Indicator.