• Overview
  • Reviews
  • Comments

Show engulfing form

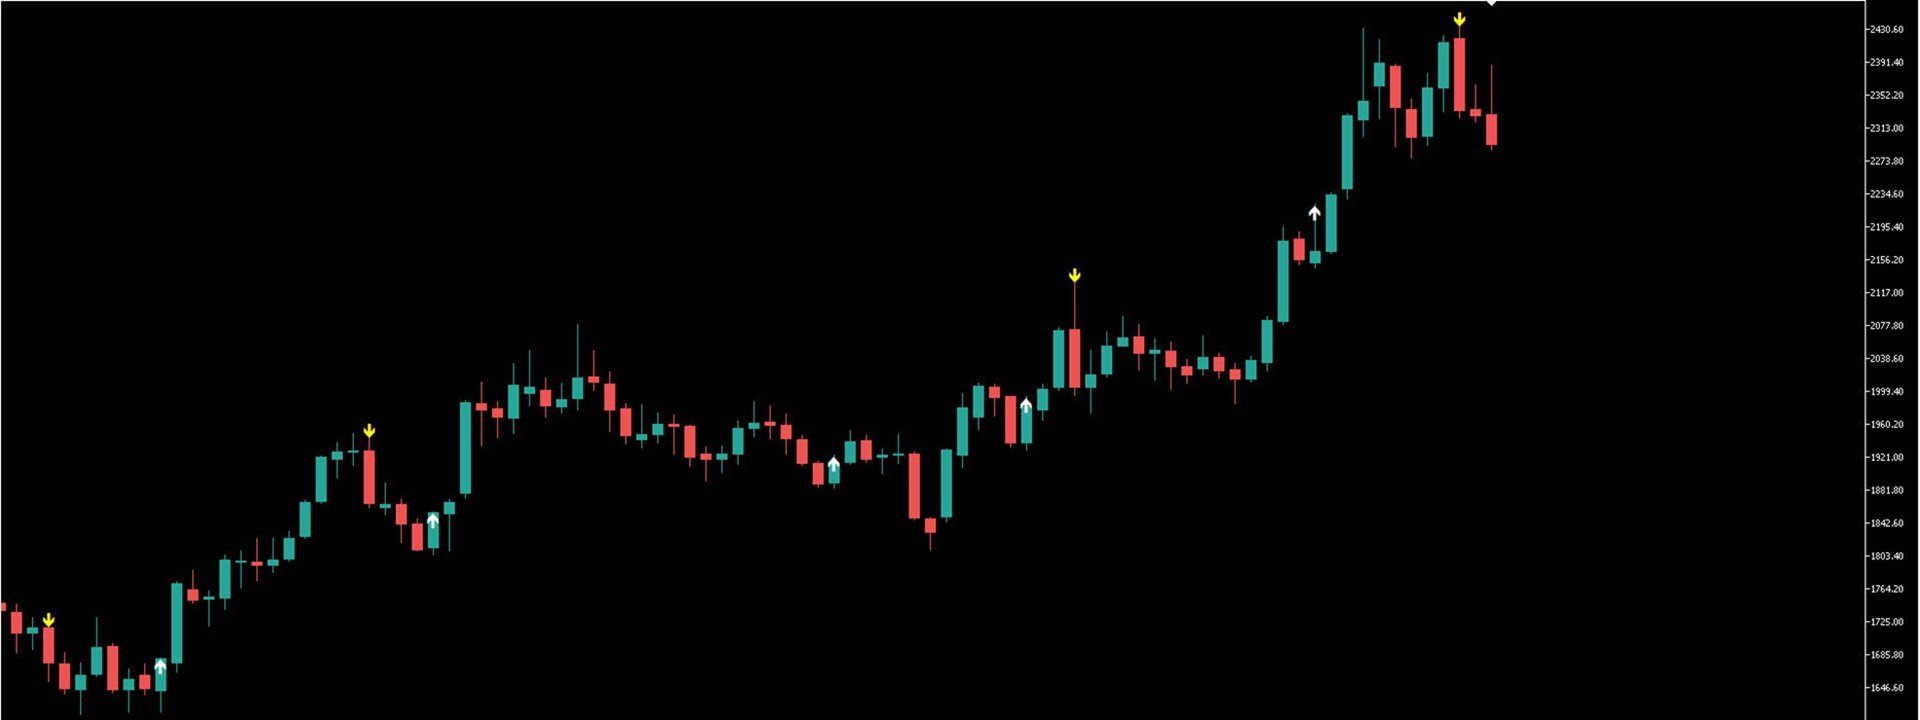
This indicator shows the engulfing pattern, which is the most direct manifestation of capital flow.

Engulfing Pattern is a common price reversal pattern in technical analysis, which usually appears at the end of a price trend or at key support and resistance levels. It can be divided into two types: Bullish Engulfing Pattern and Bearish Engulfing Pattern.

Bullish Engulfing Pattern
feature:

Previous K-line: This is the negative line of a small entity (the opening price is higher than the closing price).
The next K-line: This is the positive line of a large entity (the opening price is lower than the closing price), and the entity of the positive line completely covers the entity of the previous negative line.
meaning:

Appearance position: Usually appears at the end of a downward trend, indicating that the power of sellers gradually fails and the power of buyers begins to dominate.
It indicates that the price may reverse upward and is a bullish signal.

Bearish Engulfing Pattern
feature:

Previous K-line: This is a small-body positive line (the opening price is lower than the closing price).
The next K line: This is the negative line of a large entity (the opening price is higher than the closing price), and the entity of the negative line completely surrounds the entity of the previous positive line.
meaning:

Appearance position: Usually appears at the end of an upward trend, indicating that the power of buyers gradually fails and the power of sellers begins to dominate.
It indicates that the price may reverse downward and is a bearish signal.


Recommended products
This is a multi-symbol and multi-timeframe table-based indicator designed for a candlestick patterns detection with 46 patterns for META TRADER 5. Each formation has own image for easier recognition. Here you find most popular formations such as "Engulfing", "Hammer", "Three Line Strike", "Piercing" or Doji - like candles. Check my full list of patterns on my screenshots below. Also you can not only switch all bearish or bullish patterns from input, but also select formation for a specified symb
An indicator of pattern #31 ("Long Island") from Encyclopedia of Chart Patterns by Thomas N. Bulkowski. The second gap is in the opposite direction. Parameters: Alerts - show alert when an arrow appears   Push - send a push notification when an arrow appears (requires configuration in the terminal) GapSize - minimum gap size in points ArrowType - a symbol from 1 to 17 ArrowVShift - vertical shift of arrows in points   ShowLevels - show levels ColUp - color of an upward line ColDn - color of a
Trading Utility for Forex Currency Pairs Only not for Gold  Functions Auto Lot Calculation based on Risk Auto stoploss  Auto TakeProfit Breakeven Auto Close Half % Close in percentage with respect to the PIPs Pending Orders BuyLimit Sell Limit with distances BuyStop Sell Stop    with distances Trading Informations Risk in percentage For Multiple trades Combine Takeprofit and Combine Stoplosses
The Penta-O is a 6-point retracement harmonacci pattern which usually precedes big market movements. Penta-O patterns can expand and repaint quite a bit. To make things easier this indicator implements a twist: it waits for a donchian breakout in the right direction before signaling the trade. The end result is an otherwise repainting indicator with a very reliable trading signal. The donchian breakout period is entered as an input. [ Installation Guide | Update Guide | Troubleshooting | FAQ | A
Laguerre SuperTrend Clouds   adds an Adaptive Laguerre averaging algorithm and alerts to the widely popular SuperTrend indicator. As the name suggests,   Laguerre SuperTrend Clouds (LSC)   is a trending indicator which works best in trendy (not choppy) markets. The SuperTrend is an extremely popular indicator for intraday and daily trading, and can be used on any timeframe. Incorporating Laguerre's equation to this can facilitate more robust trend detection and smoother filters. The LSC uses the
Owl Smart Levels MT5
Sergey Ermolov
4.31 (39)
MT4 version  |   FAQ The Owl Smart Levels Indicator is a complete trading system within the one indicator that includes such popular market analysis tools as Bill Williams' advanced fractals , Valable ZigZag which builds the correct wave structure of the market, and Fibonacci levels which mark the exact levels of entry into the market and places to take profits. Detailed description of the strategy Instructions for working with the indicator Advisor-assistant in trading Owl Helper Private User
Unlock key market insights with automated support and resistance lines Special Offer: Purchase now to receive free bonuses worth $89! (Read more for details) Tired of plotting support and resistance lines? This is a multi-timeframe indicator that detects and plots supports and resistance lines in the chart with the same precision as a human eye would. As price levels are tested over time and its importance increases, the lines become thicker and darker, making price leves easy to glance and ev
Was: $249  Now: $99   Market Profile defines a number of day types that can help the trader to determine market behaviour. A key feature is the Value Area, representing the range of price action where 70% of trading took place. Understanding the Value Area can give traders valuable insight into market direction and establish the higher odds trade. It is an excellent addition to any system you may be using. Inspired by Jim Dalton’s book “Mind Over Markets”, this indicator is designed to suit the
The Trend Catcher: The Trend Catcher Strategy with Alert Indicator is a versatile technical analysis tool that aids traders in identifying market trends and potential entry and exit points. It features a dynamic Trend Catcher Strategy , adapting to market conditions for a clear visual representation of trend direction. Traders can customize parameters to align with their preferences and risk tolerance. The indicator assists in trend identification, signals potential reversals, serves as a trail
FREE
First of all Its worth emphasizing here that this Trading Tool is Non Repainting , Non Redrawing and Non Lagging Indicator , Which makes it ideal for professional trading . Online course, user manual and demo. The Smart Price Action Concepts Indicator is a very powerful tool for both new and experienced traders . It packs more than 20 useful indicators into one , combining advanced trading ideas like Inner Circle Trader Analysis and Smart Money Concepts Trading Strategies . This indicator focus
50% off. Original price: $60 Candlestick Pattern Scanner is a multi-timeframe and multi-symbol dashboard and alert system that checks all timeframes and currency pairs for different candlestick patterns that are formed in them. Scanner is integrated   with support and resistance zones so you can check the candlestick patterns in most important areas of the chart to find breakout and reversal patterns in the price chart. Download demo version   (works on M4,M5,M6,M12,H3,H8 timeframes) Read the f
Renko Gold
Ignacio Agustin Mene Franco
Renko Gold! clearly indicates the floors and ceilings where it goes from 4 lines, the line below that marks the floor in green confirming with the thinnest line clarifies the purchase entry, the same is for sale, the top line marks the ceiling and the thinnest red line marks the sale, This indicator works for all temporalities! For Forex and Synthetic Indices markets! It also works for crypto markets! Good profit! World Investor.
The indicator includes two parts. Part I: Color Candles Show the Major Trend Color candles is to identify the market state by color candlesticks. As shown in the screenshots, if the color is Aqua, the market is in a state when you should place long orders or exit short orders. If the color is Tomato, it is the time to place short orders or exit long orders. If the color is changing, it is better to wait for its completion (until the current bar is closed). Part II: Draw bands The inner bands is
This MT5 indicator has been designed to be used on any currency pair and any time frame . It has the scalper and swing trader in mind.  The indicator looks for short-term high-probability reversals in price and will indicate to you to go long (buy) or short (sell) if you see a green or red arrow next to the current candlestick respectively. The indicator provides the best trading opportunities to you during the active trading hours of London and New York, but it will continue to give signals al
This indicator is used to find support and resistance lines The support and pressure of different time periods can be found in the same icon cycle, and two time periods are provided here Parameter Description: ---------------------- Main --------------------- Timeframe                        //Used to select the main time period (recommended as the default PERIOD_D1); Retracement interval        //This value is the root number of backtracking k-lines (recommended to be 20 by default);
POC level MT5
Mikhail Nazarenko
The indicator automatically calculates       and displays the level of the maximum       real   volume Point Of Control (POC) of the Market Profile for the   array of candles   highlighted by a rectangular area. This will significantly increase the accuracy of your position entries when trading POC bounces and reversals. Attention when testing the demo version!   In the MT5 strategy tester , there is no possibility of dragging a rectangle and this is a problem of limitations of the MT5 strategy
First of all Its worth emphasizing here that this Trading System is Non-Repainting, Non-Redrawing and Non-Lagging Indicator, Which makes it ideal for professional trading. Online course, user manual and demo. The "Smart Support and Resistance Trading System" is an advanced indicator tailored for  new  and  experienced  traders. It empowers traders with precision and confidence in the forex market. This comprehensive system combines 7+ strategies, 10 indicators, and various trading approaches,
MT5 Inside Bar Indicator
Muhammad Shamsuddeen Muhammad
This indicator paints any Inside Bar found on the attached chart in a Dark Gray Colour with Black Borders and Wicks. If there are multiple consecutive Inside Bars, then they would also be successively painted Dark Grey with Black Borders and Wicks as well. You may opt to change the colours set by default in order to better contrast with your chosen background and chart colours. I made this Indicator out of necessity as my trading required it. But I know there may be others out there who may need
You can change the time period of the chart at the touch of a button. You can also change multiple charts at the touch of a button. You can also change multiple charts at the touch of a button,   saving you the trouble of changing time periods. We are live-streaming the actual operation of the system. Please check for yourself if it is usable. Please check it out for yourself. https://www.youtube.com/@ganesha_forex We do not guarantee your investment results. Investments should be made at y
LT Rainbow Trend
Thiago Duarte
5 (1)
Do you, like me, like to trade with the trend? Then this indicator will help you! Rainbow Trend is a trend indicator, which uses several Moving Averages on the chart. It measures different trend strenght zones for different periods: very long term, long term, mid term, short term and very short term. Each zone has its color, and it is possible to have sound alert when the prices leaves a zone and enters another. Its configuration is very simple. If you find any bug or have any suggestions, co
Candle hunter
Ruslan Khasanov
5 (1)
Indicator for graphical analysis. Marks the main Japanese candlestick patterns on the chart. At the moment, the following set of patterns is available to the trader:  - Bearish/Bullish Abandoned Baby;  - Bearish Advance Block;  - Bearish Deliberation;  - Bearish/Bullish Belt Hold;  - Bearish/Bullish Engulfing;  - Bearish Shooting Star;  - Bearish Evening Star;  - Bearish Evening Doji Star;  - Bearish/Bullish Doji Star;    - Bearish/Bullish Tri-Star;  - Bearish Hanging Man;  - Bearish/Bullish Ha
Your Trend Friend
Luigi Nunes Labigalini
5 (1)
The trend is your friend! Look at the color of the indicator and trade on that direction. It does not  repaint. After each candle is closed, that's the color of the trend. You can focus on shorter faster trends or major trends, just test what's most suitable for the symbol and timeframe you trade. Simply change the "Length" parameter and the indicator will automatically adapt. You can also change the color, thickness and style of the lines. Download and give it a try! There are big movements
Support & Resistance indicator is a modification of the standard Bill Williams' Fractals indicator. The indicator works on any timeframes. It displays support and resistance levels on the chart and allows setting stop loss and take profit levels (you can check the exact value by putting the mouse cursor over the level). Blue dashed lines are support level. Red dashed lines are resistance levels. If you want, you can change the style and color of these lines. If the price approaches a support lev
A visualization system for favorite candlesticks price action patterns. Once attached, indicator will automatically mark next patterns on the chart: Pinocchio bar  - a small-body bar with a long 'nose', very well-known reverse pattern; Inside bar  - a bar whose range lies inside the range of the previous bar. It represents market incertitude; Outside bar  - a bar whose range exceeds the range of the previous bar. It represents market incertitude; Rails pattern  - two consequent opposite bars wit
Premium level is a unique indicator with more than 80% accuracy of correct predictions! This indicator has been tested for more than two months by the best Trading Specialists! The author's indicator you will not find anywhere else! From the screenshots you can see for yourself the accuracy of this tool! 1 is great for trading binary options with an expiration time of 1 candle. 2 works on all currency pairs, stocks, commodities, cryptocurrencies Instructions: As soon as the red ar
Noize Absorption Index - is the manual trading system that measures the difference of pressure between bears forces and bulls forces. Green line - is a noize free index that showing curent situation. Zero value of index shows totally choppy/flat market.Values above zero level shows how powerfull bullish wave is and values below zero measures bearish forces.Up arrow appears on bearish market when it's ready to reverse, dn arrow appears on weak bullish market, as a result of reverse expectation.
Ultimate Supply Demand MT5
Ramon Sobrevals Arce
5 (4)
After working during many months, with the help of Neural Networks, we have perfected the ultimate tool you are going to need for identifying key price levels (Supports and Resistances) and Supply and Demand zones. Perfectly suitable to trigger your trades, set up your future actions, decide your Take Profit and Stop Loss levels, and confirm the market direction. Price will always move between those levels, bouncing or breaking; from one zone to another, all the remaining movements are just mark
Pattern DejaVu
Andriy Konovalov
1 (1)
This indicator predicts the nearest bars of the chart based on the search of up to three best coincided patterns (a sequence of bars of a given length) in the history of the current instrument of the current timeframe. The found patterns are aligned with the current pattern at the   opening price   of the current (last) bar. The predicted bars are bars following immediately for patterns found in history. Pattern search is performed once every time a new bar of the current timeframe opens. The i
SolarTrade Suite Financial Indicator: Jupiter Market Indicator - Your Reliable Guide in the World of Financial Markets! This is a trend indicator that uses special innovative and advanced algorithms to calculate its value, and also has an eye-pleasing design. It is very easy to understand the readings of this indicator: blue color - buy, red - sell. Check out our other products from the SolarTrade Suite series at the bottom of the description. Do you want to confidently navigate the wor
The indicator detects and displays М. Gartley's Butterfly pattern. The pattern is plotted by the extreme values of the ZigZag indicator (included in the resources, no need to install). After detecting the pattern, the indicator notifies of that by the pop-up window, a mobile notification and an email. The pattern and wave parameters are displayed on the screenshots. The default parameters are used for demonstration purposes only in order to increase the amount of detected patterns. Parameters
Buyers of this product also purchase
Atomic Analyst MT5
Issam Kassas
4.79 (19)
First of all Its worth emphasizing here that this Trading Indicator is   Non-Repainting   , Non Redrawing and Non Lagging Indicator   Indicator, Which makes it ideal from both manual and robot trading.  User manual: settings, inputs and strategy . The Atomic Analyst  is a PA Price Action Indicator that uses Strength and Momentum of the price to find a better edge in the market. Equipped with Advanced filters which help remove noises and false signals, and Increase Trading Potential. Using Mult
First of all Its worth emphasizing here that this Trading System is Non-Repainting   , Non Redrawing and Non Lagging Indicator Which makes it ideal from both manual and robot trading .  Online course, manual and download presets. The Smart Trend Trading System MT5 is a comprehensive trading solution tailored for new and experienced traders . It combines over 10 premium indicators and features more than 7 robust trading strategies , making it a versatile choice for diverse market conditions . Tre
Gold Stuff mt5
Vasiliy Strukov
4.9 (182)
Gold Stuff mt5 is a trend indicator designed specifically for gold and can also be used on any financial instrument. The indicator does not redraw and does not lag. Recommended time frame H1. Contact me immediately after the purchase to get   personal bonus!  You can get a free copy of our Strong Support and Trend Scanner indicator, please pm. me! Settings  and manual   here   SETTINGS Draw Arrow - on off. drawing arrows on the chart. Alerts -   on off audible alerts. E-mail notification - on of
Quantum Trend Sniper
Bogdan Ion Puscasu
4.92 (48)
Introducing   Quantum Trend Sniper Indicator , the groundbreaking MQL5 Indicator that's transforming the way you identify and trade trend reversals! Developed by a team of experienced traders with trading experience of over 13 years,   Quantum Trend Sniper Indicator   is designed to propel your trading journey to new heights with its innovative way of identifying trend reversals with extremely high accuracy. ***Buy Quantum Trend Sniper Indicator and you could get Quantum Breakout Indicator fo
TPSproTREND PrO MT5
Roman Podpora
4.89 (9)
TPSpro TREND PRO  - is a trend indicator that automatically analyzes the market and provides information about the trend and each of its changes, as well as giving signals for entering trades without redrawing! The indicator uses each candle, analyzing them separately. referring to different impulses - up or down impulse. Exact entry points into transactions for currencies, crypto, metals, stocks, indices!  Version MT4               DETAILED DESCRIPTION               R ecommended to use with an
TPSpro RFI Levels MT5
Roman Podpora
4.67 (9)
Reversal First Impulse levels (RFI)      INSTRUCTIONS        RUS       -       ENG              R ecommended to use with an indicator   -   TPSpro  TREND PRO -  Version MT4                 A key element in trading is zones or levels from which decisions to buy or sell a trading instrument are made. Despite attempts by major players to conceal their presence in the market, they inevitably leave traces. Our task was to learn how to identify these traces and interpret them correctly. Main functi
Trend Screener Pro MT5
STE S.S.COMPANY
4.88 (67)
Unlock the Power of Trends Trading with the Trend Screener Indicator: Your Ultimate Trend Trading Solution powered by Fuzzy Logic and Multi-Currencies System! Elevate your trading game with the Trend Screener, the revolutionary trend indicator designed to transform your Metatrader into a powerful Trend Analyzer. This comprehensive tool leverages fuzzy logic and integrates over 13 premium features and three trading strategies, offering unmatched precision and versatility. LIMITED TIME OFFER : Tre
FX Power MT5 NG
Daniel Stein
5 (6)
Trading GOLD, and currencies, with the dog walk strategy  - super smart Trading GOLD, and currencies, with the breakout strategy  - super easy Visit our all-new   Stein Investments Welcome Page   to get the latest information, updates and trading strategies. FX Power MT5 NG  is the next generation of our long-time very popular currency strength meter, FX Power.  And what does this next-generation strength meter offer? Everything you have loved about the original FX Power  PLUS GOLD/XAU st
IX Power MT5
Daniel Stein
4.17 (6)
IX Power   finally brings the unbeatable precision of FX Power to all your trading symbols. It accurately determines the intensity of short, medium and long-term trends in your favourite indices, stocks, commodities, ETFs, and even cryptocurrencies. You can   analyse everything   your terminal has to offer. Try it out and experience how   your timing improves significantly   when trading. Read about our latest strategic development -  Easy scalping with IX Power Visit our all-new   Stein Inve
ICT, SMC, SMART MONEY CONCEPTS, SMART MONEY, Smart Money Concept, Support and Resistance, Trend Analysis, Price Action, Market Structure, Order Blocks, BOS/CHoCH,   Breaker Blocks ,  Momentum Shift,   Supply&Demand Zone/Order Blocks , Strong Imbalance, HH/LL/HL/LH,    Fair Value Gap, FVG, Invert FVG, IFVG,  Premium  &   Discount   Zones, Fibonacci Retracement, OTE, Buy Side Liquidity, Sell Side Liquidity, BSL/SSL Taken, Equal Highs & Lows, MTF Dashboard, Multiple Time Frame, BigBar, HTF OB, HTF
Automated Trendlines MT5
Georgios Kalomoiropoulos
Trendlines  are the most essential tool of technical analysis in forex trading.  Unfortunately, most  traders don’t draw them correctly. Automated Trendlines indicator is a professional tool for serious traders that help you visualize the trending movement of the markets . AMAZING OFFER --> Activations from 5 to 20 for "MTF Supply Demand Zones" and "Automated Trendlines" There are two types of Trendlines Bullish Trendlines and Bearish Trendlines. In the uptrend, Forex trend line is drawn th
Gartley Hunter Multi
Siarhei Vashchylka
5 (8)
Gartley Hunter Multi - An indicator for searching for harmonic patterns simultaneously on dozens of trading instruments and on all possible timeframes. Manual (Be sure to read before purchasing) | Version for MT4 Advantages 1. Patterns: Gartley, Butterfly, Shark, Crab. Bat, Alternate Bat, Deep Crab, Cypher 2. Simultaneous search for patterns on dozens of trading instruments and on all possible timeframes 3. Search for patterns of all possible sizes. From the smallest to the largest 4. A
How many times have you bought a trading indicator with great back-tests, live account performance proof with fantastic numbers and stats all over the place but after using it, you end up blowing your account? You shouldn't trust a signal by itself, you need to know why it appeared in the first place, and that's what RelicusRoad Pro does best! NOW $147 (increasing to $499 after a few updates) - UNLIMITED ACCOUNTS (PCs or MACs) **  User Manual + Strategies + Training Videos + Private Group with
Advanced Supply Demand MT5
Bernhard Schweigert
4.53 (15)
Best Solution for any Newbie or Expert Trader! This indicator is a unique, high quality and affordable trading tool because we have incorporated a number of proprietary features and a new formula. With this update, you will be able to show double timeframe zones. You will not only be able to show a higher TF but to show both, the chart TF, PLUS the higher TF: SHOWING NESTED ZONES. All Supply Demand traders will love it. :) Important Information Revealed Maximize the potential of Advanced Suppl
XQ Indicator MetaTrader 5
Marzena Maria Szmit
5 (1)
Step into the realm of Forex trading with confidence and precision using XQ, a cutting-edge Forex indicator designed to elevate your trading game to unprecedented heights. Whether you're a seasoned trader or just stepping into the world of currency exchange, XQ Forex Indicator empowers you with the insights and signals needed to make informed trading decisions. The signal conditions are a combination of three indicators, and XQ Forex Indicator only display  medium and long-term trends . The ind
Blahtech Supply Demand MT5
Blahtech Limited
4.54 (13)
Was: $299  Now: $99   Supply Demand uses previous price action to identify potential imbalances between buyers and sellers. The key is to identify the better odds zones, not just the untouched ones. Blahtech Supply Demand indicator delivers functionality previously unavailable on any trading platform. This 4-in-1 indicator not only highlights the higher probability zones using a multi-criteria strength engine, but also combines it with multi-timeframe trend analysis, previously confirmed swings
Introduction to X3 Chart Pattern Scanner X3 Cherart Pattern Scanner is the non-repainting and non-lagging indicator detecting X3 chart patterns including Harmonic pattern, Elliott Wave pattern, X3 patterns, and Japanese Candlestick patterns. Historical patterns match with signal patterns. Hence, you can readily develop the solid trading strategy in your chart. More importantly, this superb pattern scanner can detect the optimal pattern of its kind. In addition, you can switch on and off individu
This dashboard shows the latest available   harmonic patterns   for the selected symbols, so you will save time and be more efficient /   MT4 version . Free Indicator:   Basic Harmonic Pattern Indicator columns Symbol:  the selected symbols will appear Trend:   bullish or bearish Pattern:  type of pattern (gartley, butterfly, bat, crab, shark, cypher or ABCD) Entry:  entry price SL:  stop loss price TP1:   1st take profit price TP2:  2nd take profit price TP3:  3rd take profit price Current
Order Block Hunter MT5
Noha Mohamed Fathy Younes Badr
5 (1)
Order block hunter indicator is the best indicator for  hunt the order blocks that area where there has been a large concentration of limit orders waiting to be executed Order blocks are identified on a chart by observing previous price action and looking for areas where the price experienced significant movement or sudden changes in direction .This indicator does that for you by using very complicated codes and helps you to take the best areas To buy and sell because it make marks at the best a
AT Forex Indicator MT5
Marzena Maria Szmit
5 (4)
The AT Forex Indicator MT5 is a sophisticated trading tool designed to provide traders with a comprehensive analysis of multiple currency pairs. This powerful indicator simplifies the complex nature of the forex market, making it accessible for both novice and experienced traders. AT Forex Indicator uses advanced algorithms to detect trends, patterns and is an essential tool for traders aiming to enhance their forex trading performance. With its robust features, ease of use, and reliable signal
Easy By Sell is a market indicator for opening and closing positions. It becomes easy to track market entries with alerts. It indicates trend reversal points when a price reaches extreme values ​​and the most favorable time to enter the market. it is as effective as a Fibonacci to find a level but it uses different tools such as an algorithm based on ATR indicators and Stochastic Oscillator. You can modify these two parameters as you wish to adapt the settings to the desired period. My othe
Top indicator for MT5   providing accurate signals to enter a trade without repainting! It can be applied to any financial assets:   forex, cryptocurrencies, metals, stocks, indices .  Watch  the video  (6:22) with an example of processing only one signal that paid off the indicator! MT4 version is here It will provide pretty accurate trading signals and tell you when it's best to open a trade and close it. Most traders improve their trading results during the first trading week with the help of
AW Trend Predictor MT5
AW Trading Software Limited
4.78 (58)
The combination of trend and breakdown levels in one system. An advanced indicator algorithm filters market noise, determines the trend, entry points, as well as possible exit levels. Indicator signals are recorded in a statistical module, which allows you to select the most suitable tools, showing the effectiveness of the signal history. The indicator calculates Take Profit and Stop Loss marks. Manual and instruction ->  HERE  / MT4 version ->  HERE How to trade with the indicator:  Trading wit
FX Volume MT5
Daniel Stein
4.94 (17)
Visit our all-new   Stein Investments Welcome Page   to get the latest information, updates and trading strategies. FX Volume is the FIRST and ONLY volume indicator that provides a REAL insight into the market sentiment from a broker's point of view. It provides awesome insights into how institutional market participants, like brokers, are positioned in the Forex market, much faster than COT reports. Seeing this information directly on your chart is the real game-changer and breakthrough solut
FX Trend MT5
Daniel Stein
4.68 (37)
Visit our all-new   Stein Investments Welcome Page   to get the latest information, updates and trading strategies. Do you want to become a constantly profitable 5-star forex trader? Then  get our Stein Investments trading tools  and send us a screenshot to get your personal invitation to our exclusive trading chat with 500+ members. FX Trend displays the trend direction, duration, intensity and the resulting trend rating for all time frames in real time. You'll see at a glance at which dire
Auto Order Block with break of structure based on ICT and Smart Money Concepts (SMC) Futures Break of Structure ( BoS )             Order block ( OB )            Higher time frame Order block / Point of Interest ( POI )    shown on current chart           Fair value Gap ( FVG ) / Imbalance   -  MTF      ( Multi Time Frame )    HH/LL/HL/LH  -  MTF      ( Multi Time Frame )  Choch  MTF      ( Multi Time Frame )  Volume Imbalance     ,  MTF          vIMB Gap’s Power of 3 Equal High
Introducing   Quantum Breakout PRO , the groundbreaking MQL5 Indicator that's transforming the way you trade Breakout Zones! Developed by a team of experienced traders with trading experience of over 13 years,   Quantum Breakout PRO   is designed to propel your trading journey to new heights with its innovative and dynamic breakout zone strategy. Quantum Breakout Indicator will give you signal arrows on breakout zones with 5 profit target zones and stop loss suggestion based on the breako
Trend Forecaster
Alexey Minkov
5 (6)
The Trend Forecaster indicator utilizes a unique proprietary algorithm to determine entry points for a breakout trading strategy. The indicator identifies price clusters, analyzes price movement near levels, and provides a signal when the price breaks through a level. The Trend Forecaster indicator is suitable for all financial assets, including currencies (Forex), metals, stocks, indices, and cryptocurrencies. You can also adjust the indicator to work on any time frames, although it is recommen
Elliott Wave Trend was designed for the scientific wave counting. This tool focuses to get rid of the vagueness of the classic Elliott Wave Counting using the guideline from the template and pattern approach. In doing so, firstly Elliott Wave Trend offers the template for your wave counting. Secondly, it offers Wave Structural Score to assist to identify accurate wave formation. It offers both impulse wave Structural Score and corrective wave Structure Score. Structural Score is the rating to sh
IVISTscalp5
Vadym Zhukovskyi
5 (5)
What's new about iVISTscalp5 forecast indicator (Version 10)? iVISTscalp5 is a unique nonlinear forecasting for a week ahead system for any financial instrument which executes fast scalping using time levels. iVISTscalp5 is a tool for easy study and understanding of financial market. 1) iVISTscalp5 forecast indicator has been completely rewritten into another programming language (C++), which has accelerated data loading and processing. As a result, a different graphical display of forecast
More from author
Trend reversal identification: The K-line countdown indicator helps traders capture trend reversal signals by identifying excessive buying and selling behavior in the market. This indicator is particularly effective when the market is in extreme states. Risk management: This indicator can help traders identify potential risks in the market before the trend reverses and adjust positions in time to avoid losses. For example, you might consider reducing your long position when a bullish countdown c
Filter:
No reviews
Reply to review