KillZones ICT Series
- Indicators
- Juan Pablo Castro Forero
- Version: 1.0
- Activations: 20
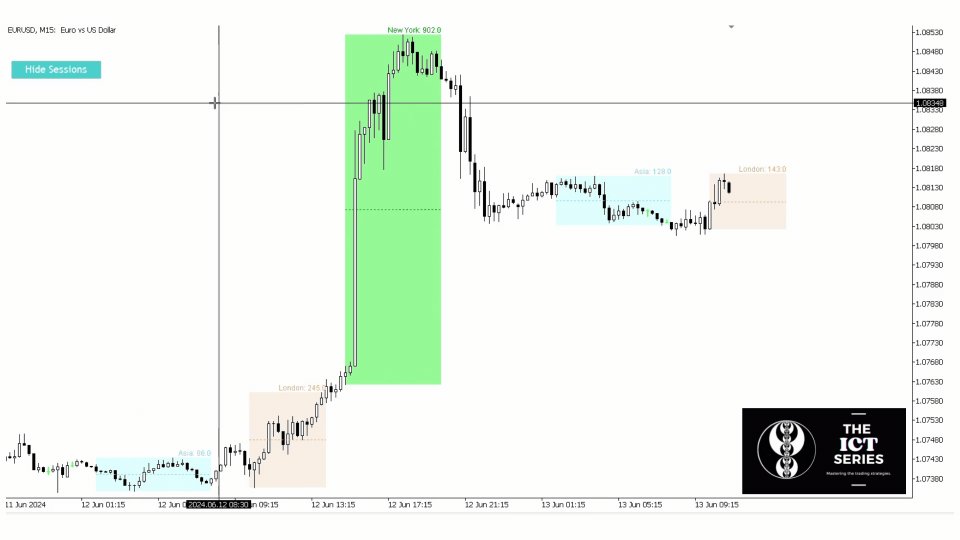
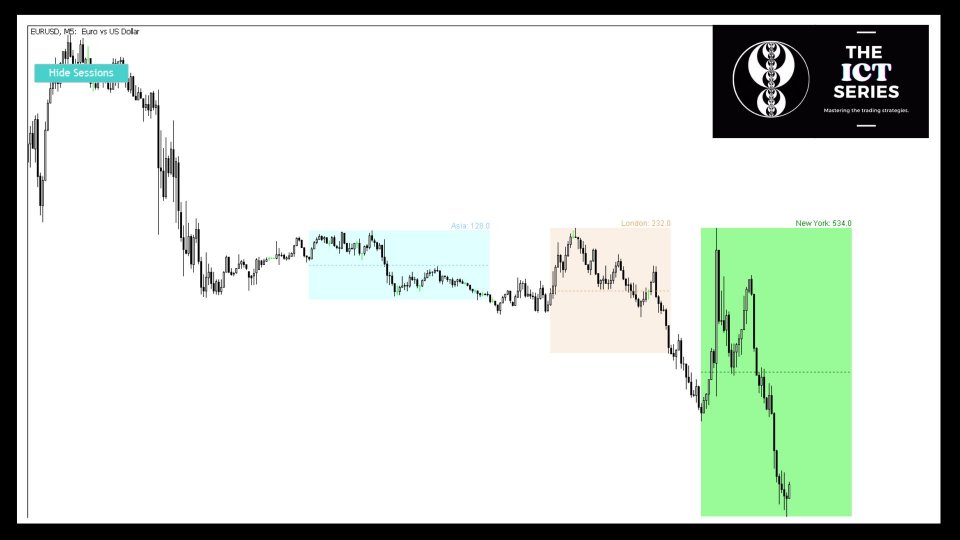
Kill zones ICT is a powerful indicator which will allow you to see the markets from a better perspective. This indicators tool is to display on the chart one of the most important factors of trading which is time. With its easy interface you will be able to easily see what the times with higher volatility and movement the sessions with less active hours are as well.
What can you do with Kill Zones ICT ?
Buy and sell when the main sessions start in the market. With this indicator you will see where are the best times to trade and easily identify what is the direction for the trading day. You will receive alerts so you know that is time to trade and get ready in the charts. This indicator is not only useful to display the session time, additionally you can modify the times and names that the indicator plots, allowing you to plot the famous Killzone’s or Macros times, which are the times where a trade has higher chance to success due to the fast and strong market moves made by the big institutions.
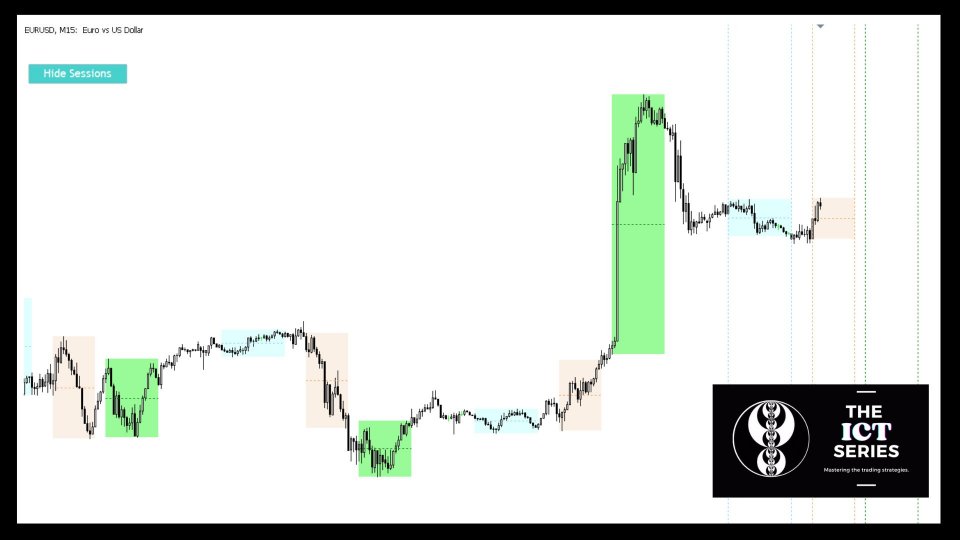
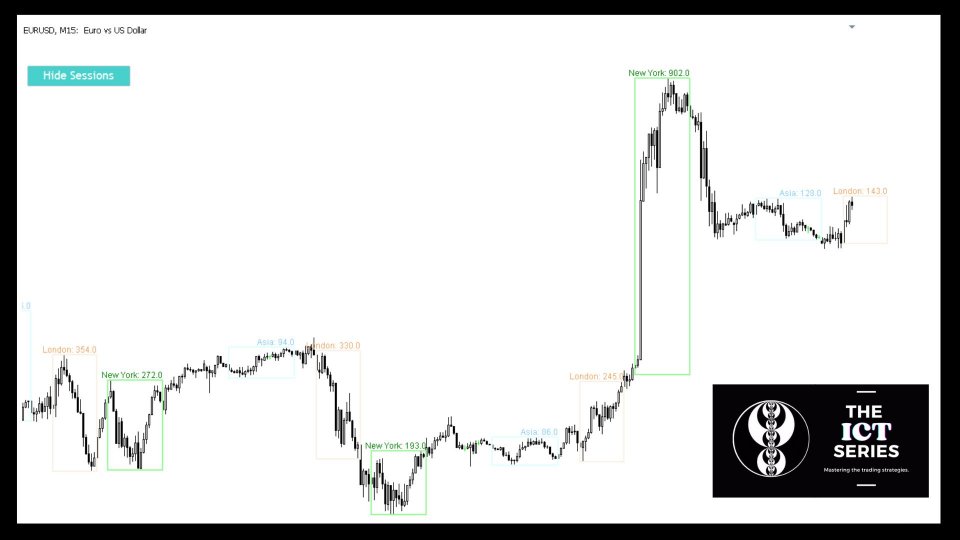
The indicator also plots the previous days sessions as well has the option to plot the current one only, this to adapt to each trader preference and usage. Additionally, it plots how many points have the sessions move in the last day. This will give you a better idea of what to expect from the current time and take a more informed decision.
Why to use The Kill Zones ICT ?
This tool is essential to take your trading to a new level. As well to trade some of the most interesting concepts like liquidity-based strategies, smart money trading and other theories taught by Inner Circle Trader (ICT) and other traders. In the following link you will find an strategy on how to use the indicator in your strategy and trade it in the most effective way possible.
This indicator will allow you to understand the dynamics of the market, see at what times are the buyers and sellers most active. What have they done in previous days during these times and allow you to create a strategy and decision around this important information.
Other features
- Vertical lines in sessions start and end times.
- Alerts for sessions starts.
- Middle range plot to see when a price is oversold or overbought.
Additionally, to make the use of the indicator easier it has full customization, allowing you to set your favorite colors, line styles, labels names and times. This way you can really use the indicators and enjoy trading your way.
This indicator is part of the ICT SERIES collection which can be found here. Use simultaneously with the other products to guarantee better results, as well if you have any ideas, concepts, or strategies which you would like to see in the ICT SERIES, please send it to us on direct message or comment, we would be happy to develop it and test it with you or join our community of traders who share insights, strategies, and support.
The series main focus are the Inner Circle Trader concepts (ICT ), Smart money concepts, institutional trading, Liquidity concepts, Turtle soups, IPDA, Wyckoff. Join our community.
