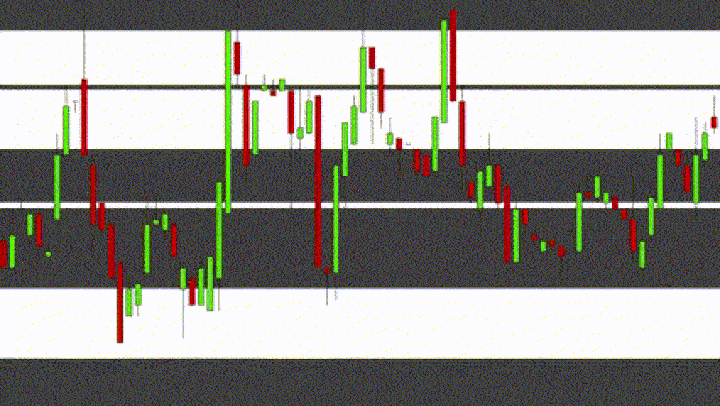
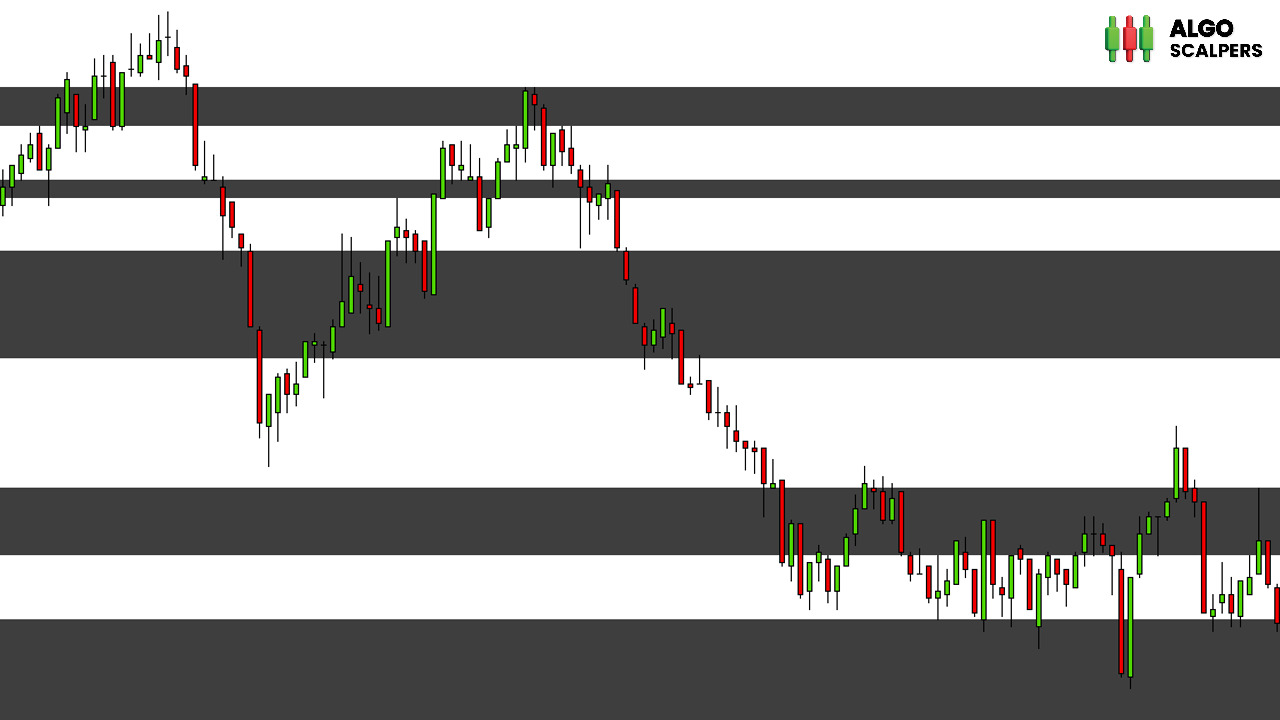
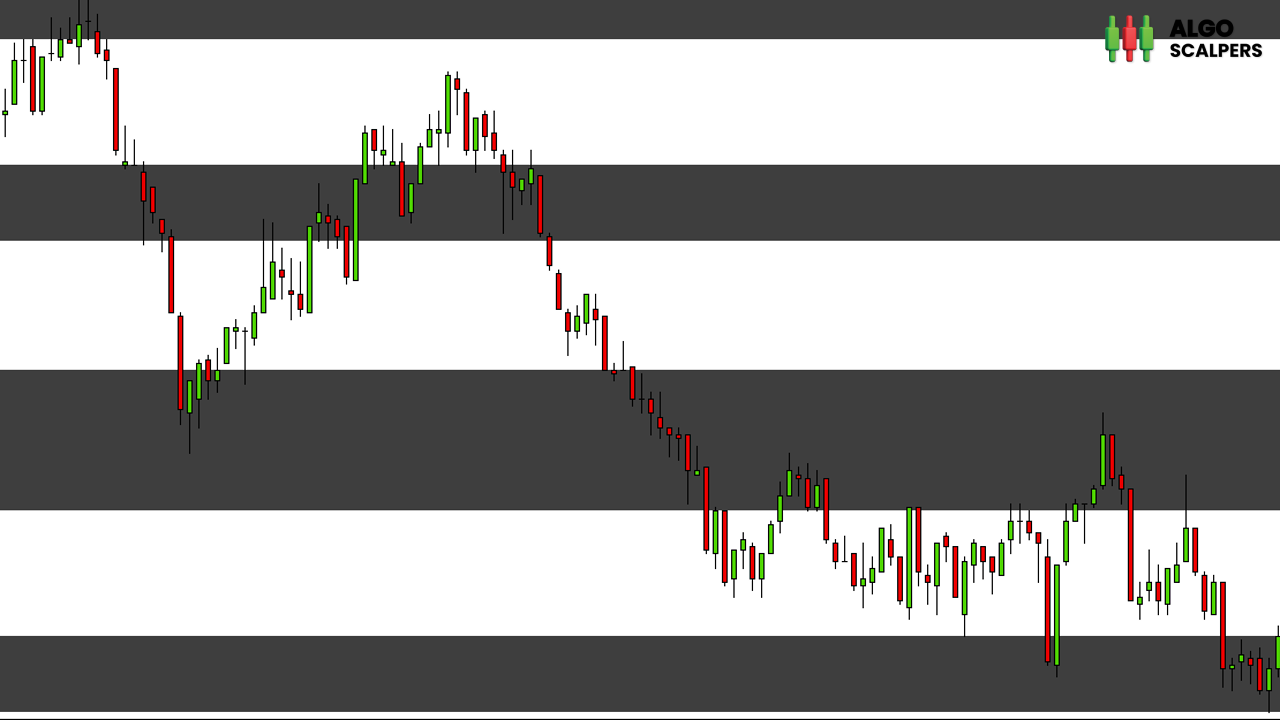
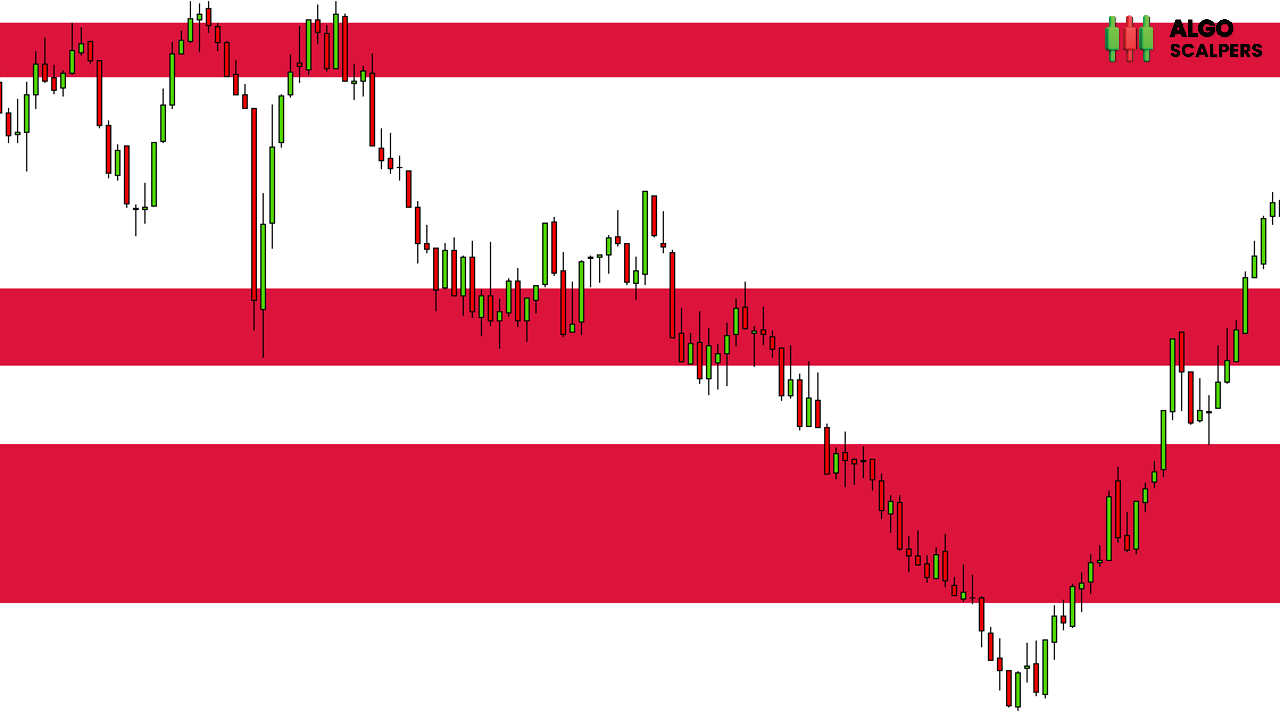
KMeans Price Zones Detector
- Indicators
- Polyware Yazilim Hizmetleri Limited Sirketi
- Version: 1.0
Welcome to the future of trading with the KMeans Price Zones Detector, an innovative MetaTrader indicator that leverages the power of machine learning to identify key price zones. This tool utilizes the KMeans clustering algorithm to dynamically detect centroids in price data, highlighting areas where prices are more likely to encounter support, resistance, or consolidation.
Innovative KMeans Algorithm
The KMeans Price Zones Detector stands out due to its advanced use of the KMeans clustering algorithm, a staple in machine learning for its efficiency and accuracy in pattern recognition. By analyzing historical price data, the indicator identifies clusters or centroids that represent significant price levels. These centroids are then used to calculate support and resistance zones, providing traders with crucial information about potential price reversals, breakouts, and consolidations.
Key Features
- Dynamic Zone Detection: The indicator continuously updates price zones based on the latest market data, ensuring that traders always have the most relevant information.
- Works Across All Timeframes: Whether you are a scalper on the 1-minute chart or a long-term investor on the daily chart, the KMeans Price Zones Detector adapts seamlessly to provide accurate zone detection.
- Compatible with All Forex Pairs: The indicator is designed to work with any forex pair, offering versatility and flexibility for traders dealing with multiple currencies.
- Comprehensive ATR Integration: By incorporating the Average True Range (ATR), the indicator adjusts the width of the zones based on market volatility, providing a realistic view of potential price movements.
- User-Friendly Visualization: The indicator draws clear, color-coded zones directly on the chart, making it easy for traders to interpret and act upon the data.
- Customization Options: Traders can adjust parameters such as the number of centroids, KMeans iterations, and ATR impact, tailoring the indicator to their specific trading strategies and preferences.
How It Works
- Initialization: The indicator initializes by setting the centroids using the historical price data.
- KMeans Clustering: The KMeans algorithm iteratively adjusts the centroids to minimize the distance between price data points and their nearest centroid, ensuring accurate zone detection.
- ATR Calculation: The Average True Range is calculated to determine the volatility-adjusted width of each zone.
- Zone Calculation: Based on the centroids and ATR, the support and resistance zones are calculated and visualized on the chart.
- Continuous Update: The indicator continuously updates the zones as new price data comes in, maintaining its relevance and accuracy in dynamic market conditions.
Why Choose KMeans Price Zones Detector?
- Precision and Reliability: The KMeans algorithm provides precise and reliable zone detection, helping traders make informed decisions.
- Machine Learning Power: Leverage advanced machine learning techniques to gain an edge in the market.
- Adaptability: Suitable for any trading style, whether you're day trading, swing trading, or investing long-term.
Transform your trading strategy with the KMeans Price Zones Detector and experience the power of machine learning in identifying key price zones. Enhance your trading decisions and stay ahead of the market with this cutting-edge tool.