Best And Worst
- Indicators
- Chantal Sala
- Version: 1.2
- Updated: 15 May 2017
- Activations: 10
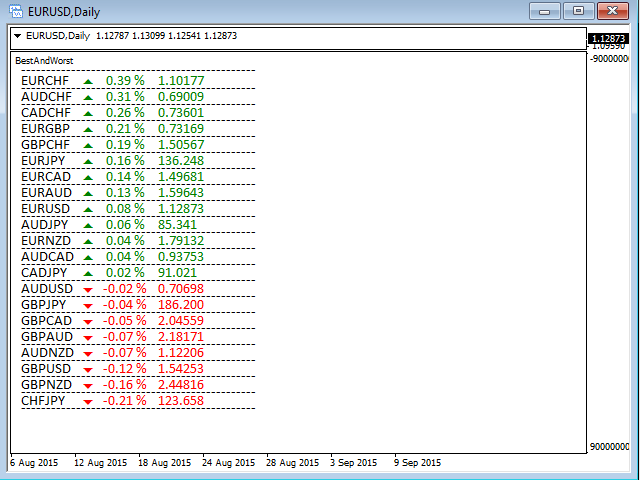
The Best and Worst indicator (similar to Net Change Indicator) has the peculiarity of being a dynamic indicator.
It seems a very Stock Exchange Indicator.
This means that it is able to draw up a list and put in order the best and worst instruments in descending order.
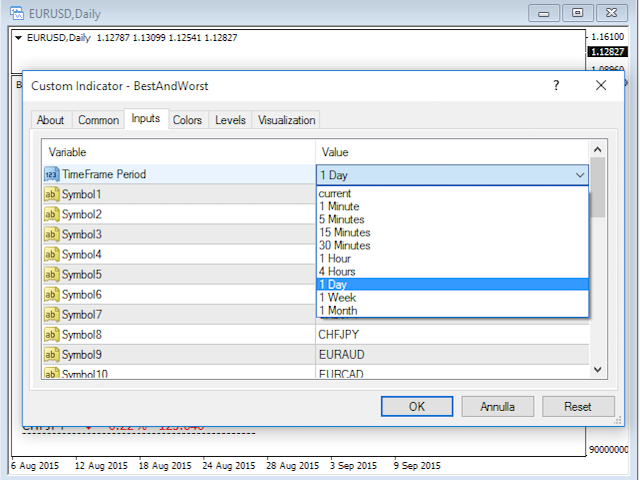
You can choose to show the percentage of any Time Frame: 1M, 5M, 15M, 30M, H1, H4 etc ...
This instrument could really give great suggestions on your trading in order to center the right time and to have a total view of the markets.
Input Parameters:
- TimeFrame Period
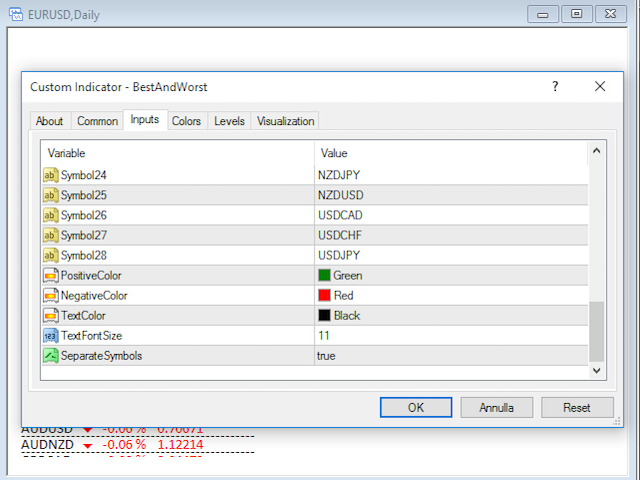
- 28 Symbols (to delete one, leave NULL)
- Setup Colors ( PositiveColor, NegativeColor, TextColor=Gray )
- TextFontSize
- SeparateSymbols (if you want show a separator line)


For me its quitte handy to be able to switch quickly to other symbols , i have one question for the author. Can there maybe be a version that splits the list in two , so we can have two list next to eachother instead of one long list? This because then you dont have to drag in your charts all the time!