Support Resistance Levels Guru
- Indicators
- Beatrice Bernard Mgaya
- Version: 1.0
Certainly! Let me introduce you to a powerful tool for MetaTrader 5 (MT5) that can automatically identify and draw support and resistance (S&R) levels on your trading charts. This tool is called the “Support and Resistance Levels Guru”.
Support Resistance Levels Guru
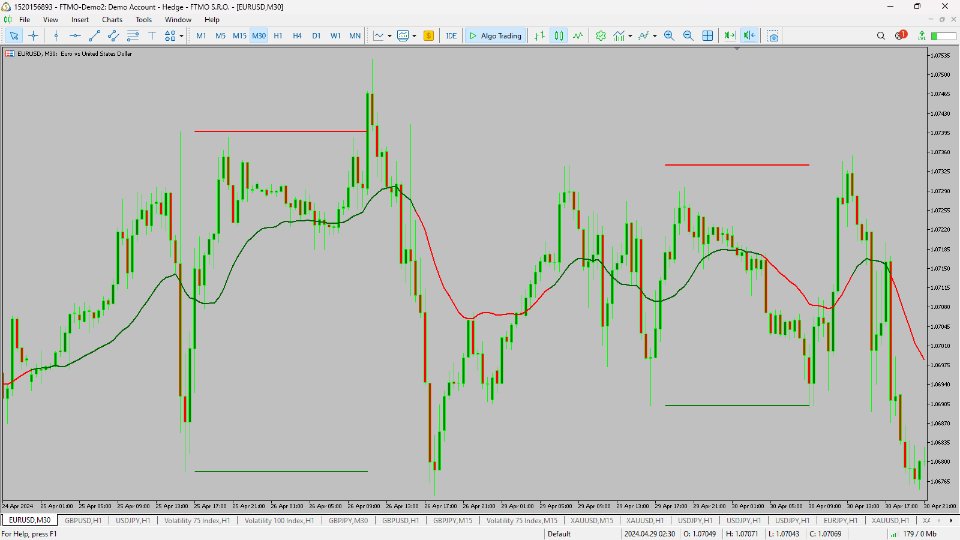
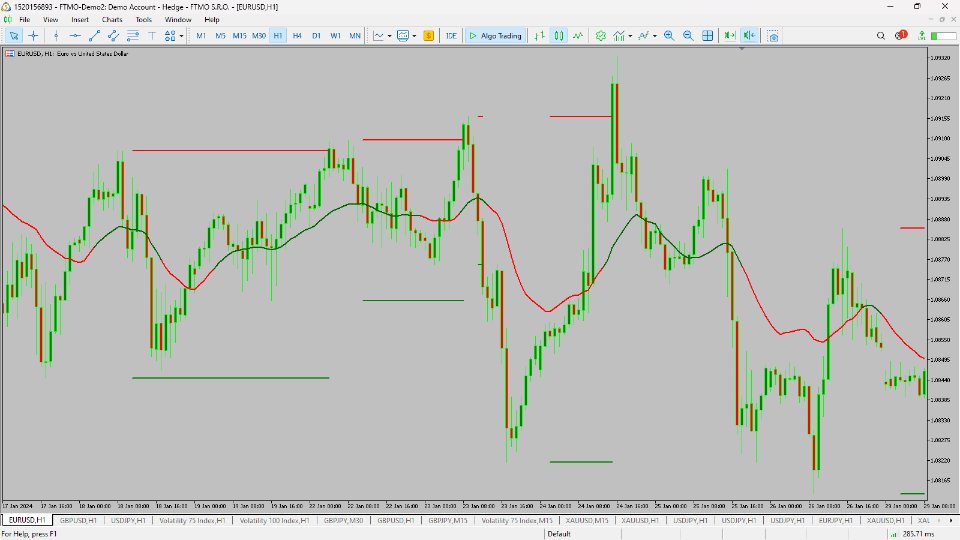
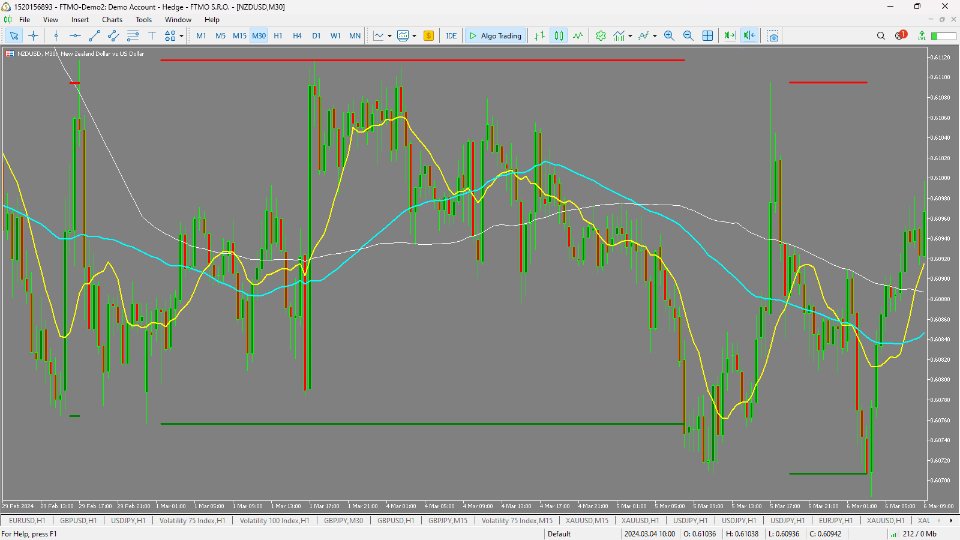
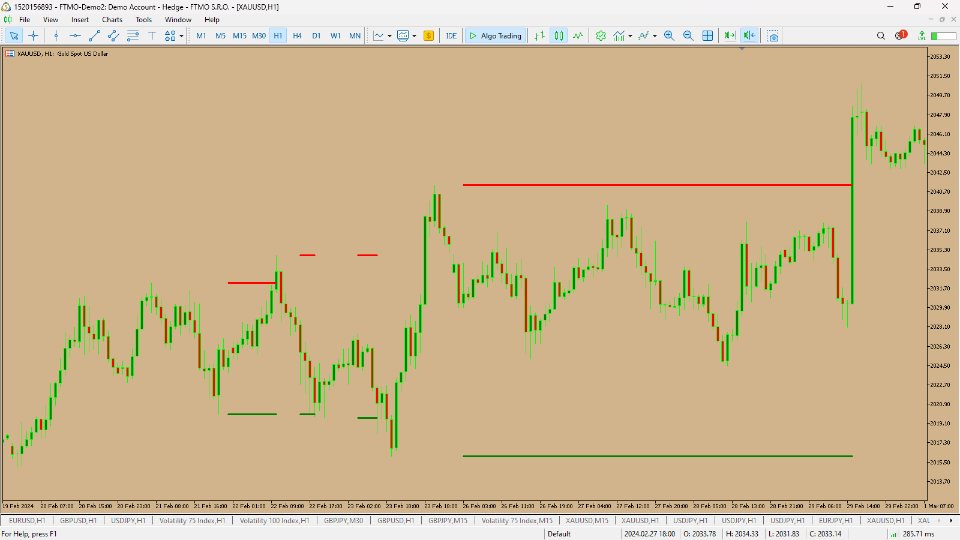
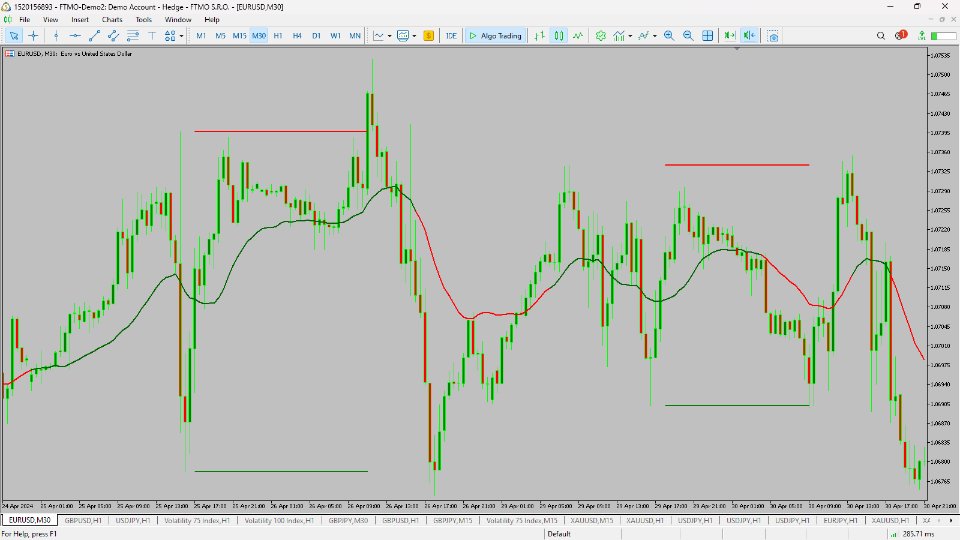
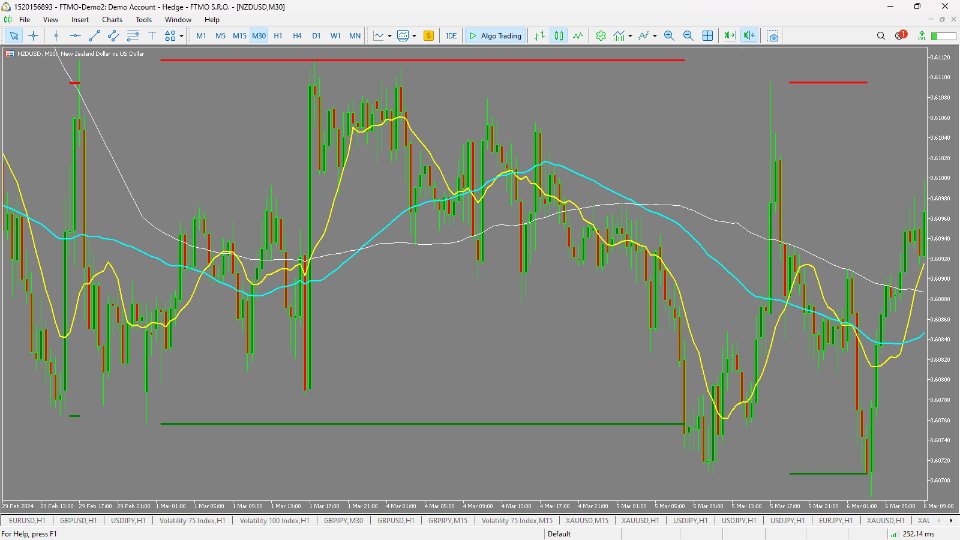
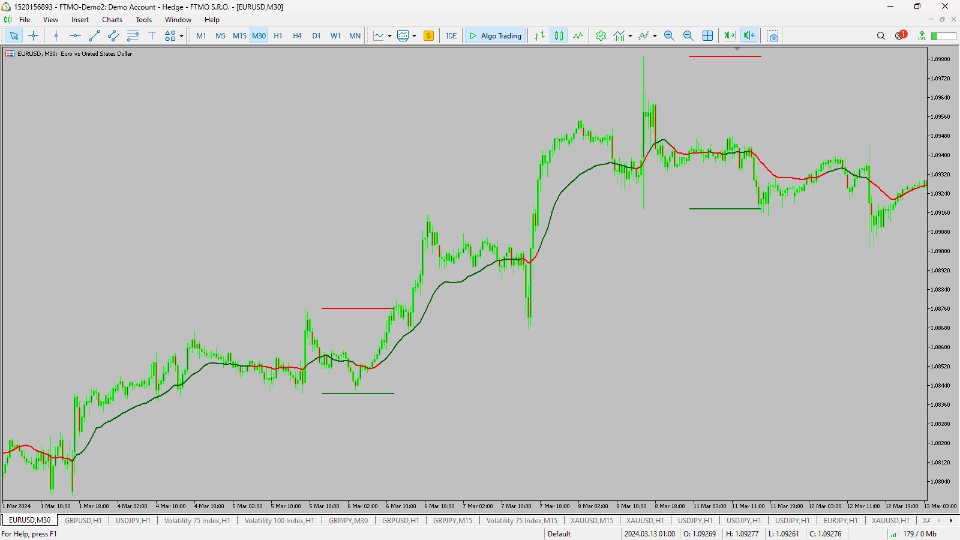
- The Support & Resistance Indicator automatically displays essential S&R levels on your chart. These levels are crucial for technical analysis and are used by many traders. Resistance levels (zones) are shown in Red, while support levels (zones) are displayed in Green.
- Functionality:
- Support Levels: These indicate the possible interest of buyers when the price approaches them.
- Resistance Levels: These indicate the opposite – when the price approaches these levels, sellers may be interested.
- Time-Saving Benefit:
- By auto-drawing the actual S&R levels, this indicator significantly saves time and effort during chart analysis.
- Professionals and novice traders alike benefit from having these levels readily available.
- Trading Applications:
- Order Placement: The displayed S&R levels serve as guidelines for placing orders, including setting stop-loss and take-profit levels.
- Trade Signals: They also help determine entry and exit signals for trades.
- Indicator Drawing Technique:
- The indicator builds S&R levels based on fractals, which are market extremes.
- Fractals are points where significant price changes occur.
- The indicator includes a built-in fractal indicator to identify these extremes.
- The height of the S&R levels depends on the distance between upper and lower fractals.
- As new fractals appear, the indicator adjusts the height of the levels without redrawing them.
- Market Coverage:
- The Support & Resistance Indicator works across various markets, including forex, cryptocurrencies, stocks, and indices.
How to Use Support and Resistance with Price Action and Breakout Strategies
-
Price Action:
- Combine S&R levels with candlestick patterns (e.g., pin bars, engulfing patterns).
- Look for price reactions (bounces or breakouts) at these levels.
- Confirm signals with other technical tools (e.g., RSI, MACD).
-
Breakout Strategy:
- Wait for price to break above resistance or below support.
- Use pending orders (buy stop or sell stop) to catch breakouts.
- Set stop-loss and take-profit levels based on nearby S&R zones.
Remember, S&R levels are not fixed they adapt to market conditions. Traders must stay flexible and adjust their strategies, accordingly. Having accurate S&R levels readily available can significantly enhance your trading decisions and overall strategy.






User didn't leave any comment to the rating