Dashboard Multi Currency MTF Double RSI
- Indicators
- Anon Candra N
- Version: 1.30
- Updated: 6 February 2025
- Activations: 20
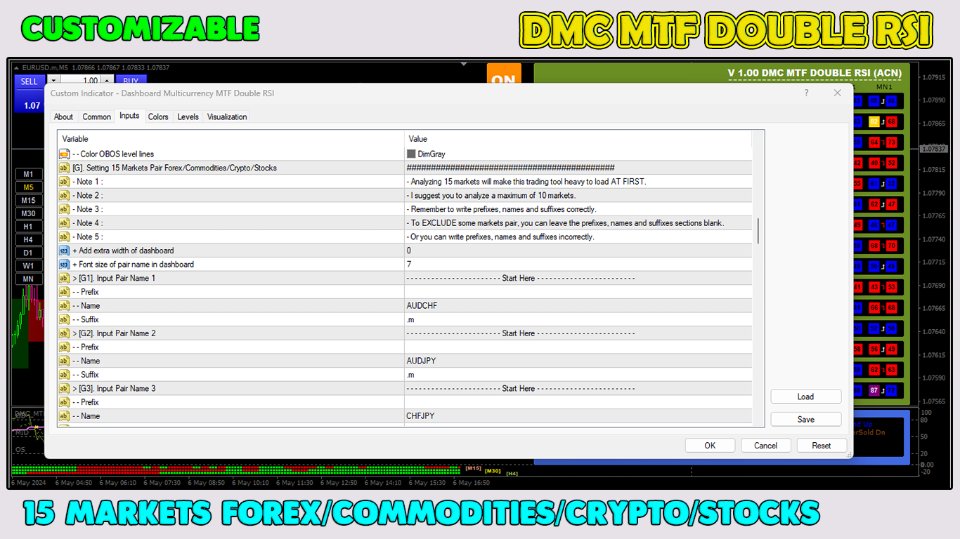
With this trading tool, you can scan 15 markets simultaneously.
Introducing, new trading indicator 2024 :
- First, I'm bored of only observing one market.
- Second, I don't want to lose the entry moment in another market.
I often look for markets where the fast RSI line > (or <=) slow RSI line starts from M1 to H4 (or just M1 to M30).
And also I often look for markets that are oversold/overbought from M1 to M30.
Don't miss the moment when market conditions meet the requirements above.
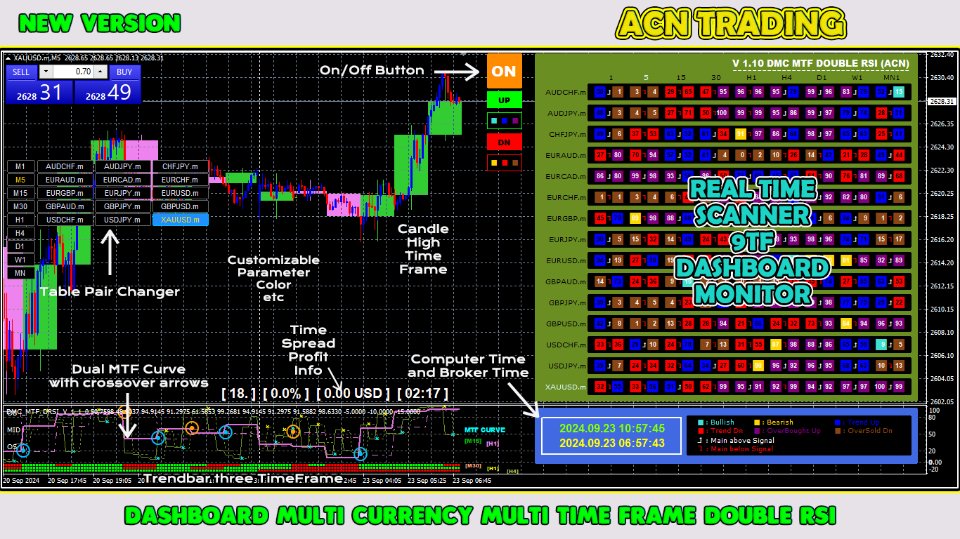
This is a scanner or dashboard of Double RSI with a lot of great features :
- Can show the data of fast RSI line
- Can show the data of slow RSI line
- Can show the position of fast RSI line and slow RSI line (fast line above slow line or fast line below slow line)
- Can show the data level of both fast RSI line and slow RSI line (bullish, bearish, trend up, trend down, overbought but still up and oversold but still down)
- Can show real time data from M1 to MN
- Can show the data of 15 currency pair (multicurrency forex/commodities/crypto/stocks)
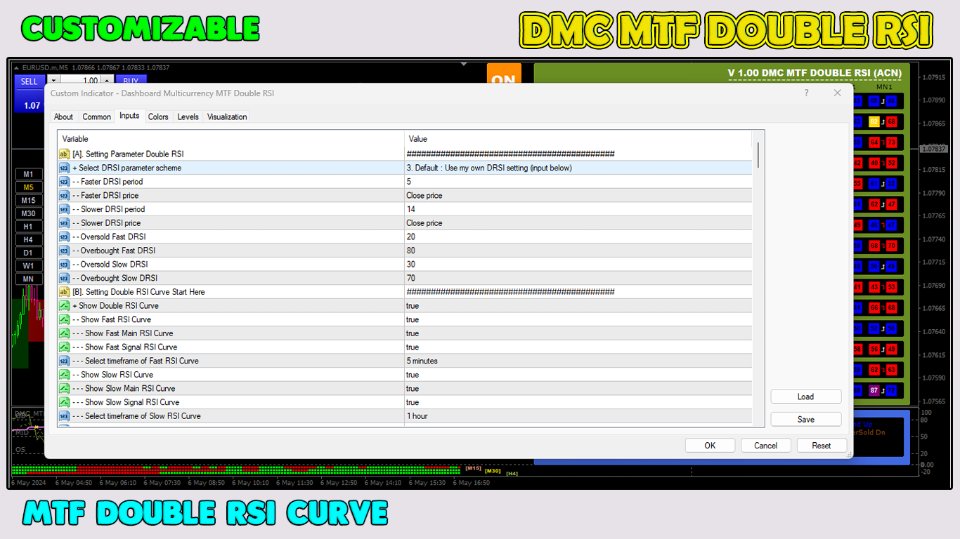
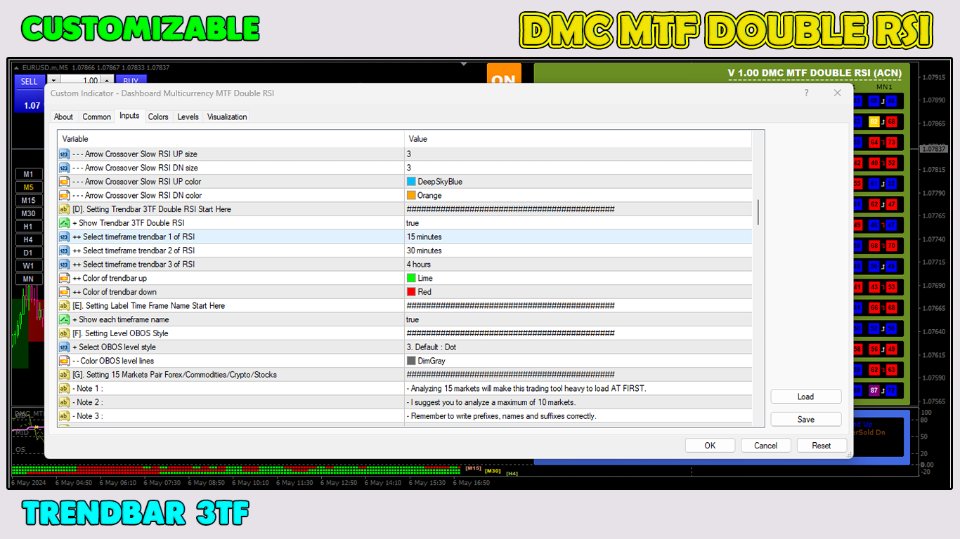
- Customizable parameter
- Customizable color OBOS level
- Beautiful 20 dashboard color scheme
- Equipped with on/off currency pair changer
- Equipped with candle high time frame
- Equipped with time spread profit info
- Equipped with current local computer time and broker time
- Equipped with MTF double RSI curve
- Equipped with crossover arrows of MTF double RSI curve
- Equipped with trend bar 3TF double RSI
This trading tool is absolutely what every trader needs.
Download today.
Make confident entries and trade like a pro!
Thank you.
#dashboardRSI #multicurrency #multitimeframe #RSItradingstrategy #scannerRSI #RSIindicator

