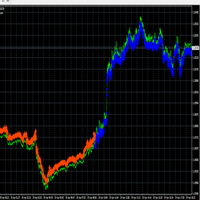
Smart Volume Tracker
- Indicators
- Thomas Bradley Butler
- Version: 2.0
- Updated: 30 April 2024
- Activations: 5
The Smart Volume Tracker is a indicator designed to provide insights into market sentiment by visually presenting bid and ask volume data in a dedicated window. This intuitive tool helps traders quickly identify where buying and selling activity is concentrated, allowing them to make more informed trading decisions.
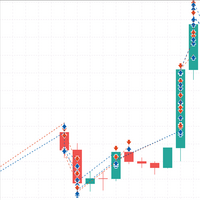
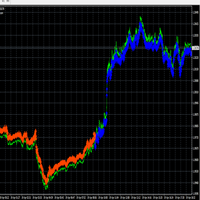
With Smart Volume Tracker, you can easily gauge whether the market is leaning toward a bullish or bearish trend. It shows clusters of bid and ask volumes, using green to represent buying activity and red for selling activity. This color-coded visualization makes it simple to determine the current mood of the market, helping you spot trends and potential turning points.
By observing the clustering patterns, you can identify key support and resistance levels, which are critical for effective trading. The separate indicator window keeps your main chart clear, allowing you to focus on your trading strategy while still gaining valuable insights into market dynamics.
Smart Volume Tracker is ideal for traders who want a straightforward way to track volume activity without overwhelming their main chart with additional data. Its adjustable settings let you customize the indicator to suit your preferences, ensuring that the information is presented clearly and effectively.
In summary, Smart Volume Tracker is a powerful yet easy-to-use tool that can enhance your trading by providing a clear view of market activity and sentiment. Use it to find opportunities, understand market trends, and make better trading decisions.
- Bid Clusters: These represent the demand side of the market, indicating where buying activity is concentrated. A higher volume of bids typically suggests an upward market trend or bullish sentiment.
- Ask Clusters: These represent the supply side of the market, indicating where selling activity is concentrated. A higher volume of asks often indicates a downward trend or bearish sentiment.
Here's how the calculation works in your code:
-
Tick Volume as a Proxy for Bid/Ask:
- The code assumes that tick volume represents both bid and ask activity. It's important to note that tick volume doesn't specifically separate bids and asks; it simply represents the total number of price changes within a given timeframe.
-
Buffer Initialization:
- The indicator initializes buffers (Bid Clusters and Ask Clusters) to store bid and ask volume data. The buffers are resized to match the number of candles (bars) in the chart.
-
Cluster Calculation
- The indicator calculates the bid and ask clusters for each candle.
- The code assigns the tick volume to both Bid Clusters and Ask Clusters, effectively treating tick volume as the representation of both buying and selling activity.
-
Displaying Clusters:
- The visualize of the bid and ask clusters.
- The function loops through the bars and displays the bid and ask volumes as text-based clusters, with color-coding (green for bids and red for asks). The positioning of these clusters depends on whether the candle is bullish or bearish.
