Golden Ratio Support Pressure Indicator
- Indicators
- Yong Xie
- Version: 1.1
- Updated: 24 April 2024
- Activations: 20
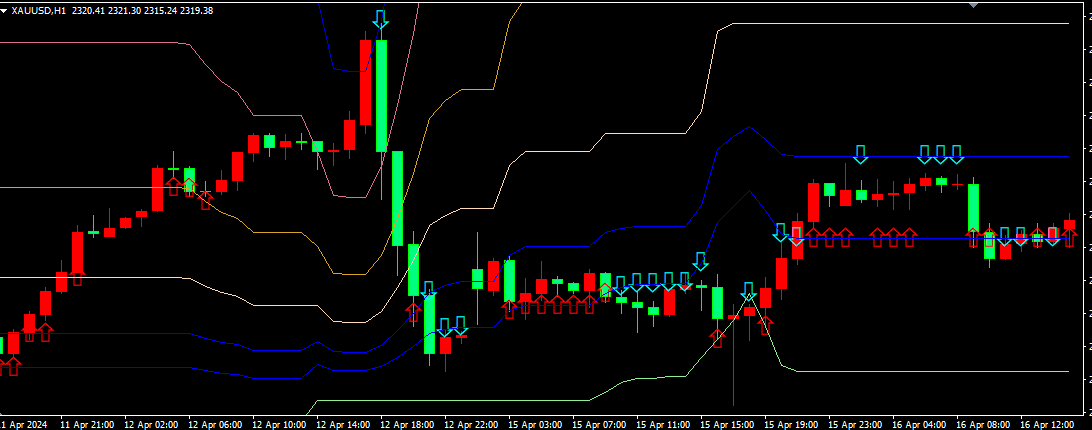
This indicator is based on the golden ratio theory, which obtains the high and low prices of the past 22 (default) K-lines, and calculates the support and pressure curves through the golden ratio coefficient.
When the price approaches the pressure line for the first time or multiple times, a downward arrow will appear, indicating that there is pressure and it is suitable to short sell;
When the price approaches the support line for the first time or multiple times, an upward arrow will appear, indicating support and making it suitable to buy long;
In the data window, the price values of each support and pressure line will be prompted, and the arrows that appear correspond to the values are up and down.
This indicator is suitable for short-term trading in the chart, which means holding a few candlesticks after entering and opening a position, and then closing the position. If you go long, the stop loss can be below the support line and the stop profit can be near the pressure line. If short selling, the stop loss can be above the pressure line and the stop profit can be near the support line.
The golden ratio coefficients involved in this indicator are 0.382, 0.618, 1.618, 2.168, and 4.236, respectively, and the corresponding support pressure lines are calculated.
Due to the limited number of indicators in MT4, this indicator is divided into two EX4 files. The first file has a golden ratio of 0.382, 0.618, and 1.618, the second file is 2.168 and 4.236, and the second file is named "Golden Ratio Support Pressure Indicator 2.168 and 4.236". It can be downloaded and used for free.