PowerZones Premium MT5
- Indicators
- Christophe Pa Trouillas
- Version: 1.0
- Activations: 5
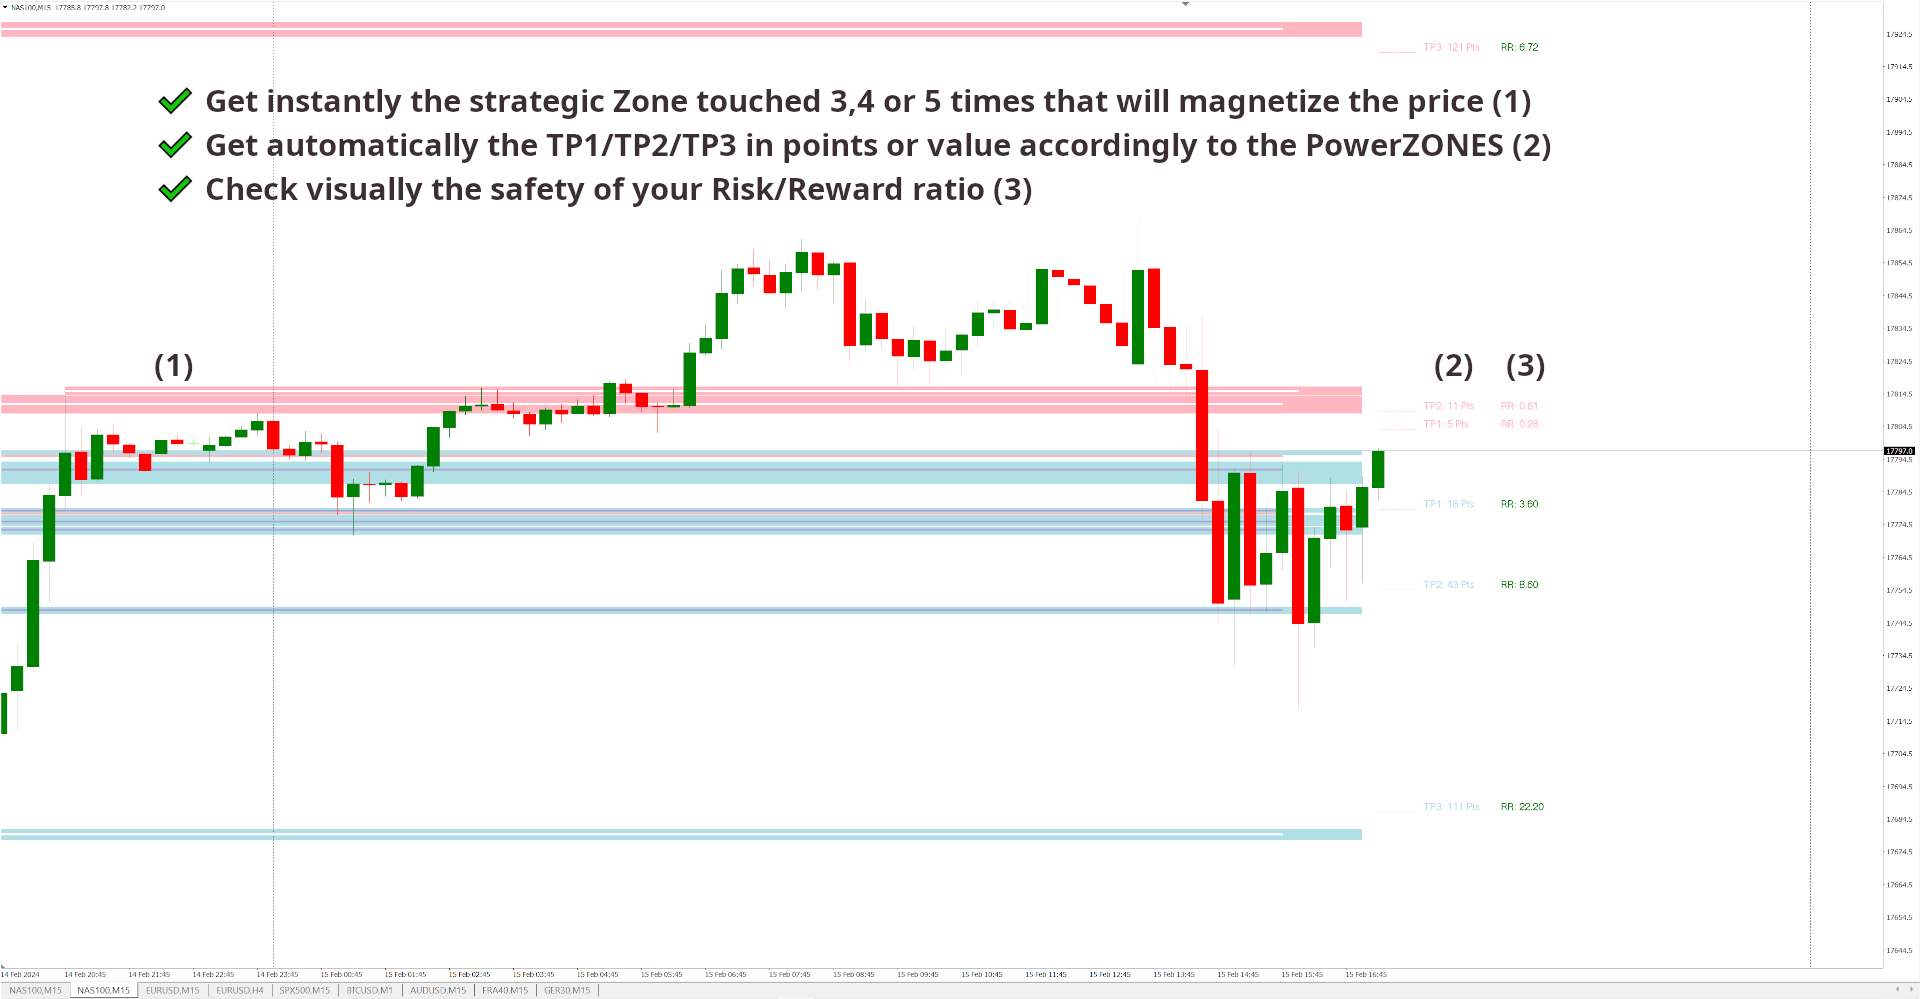
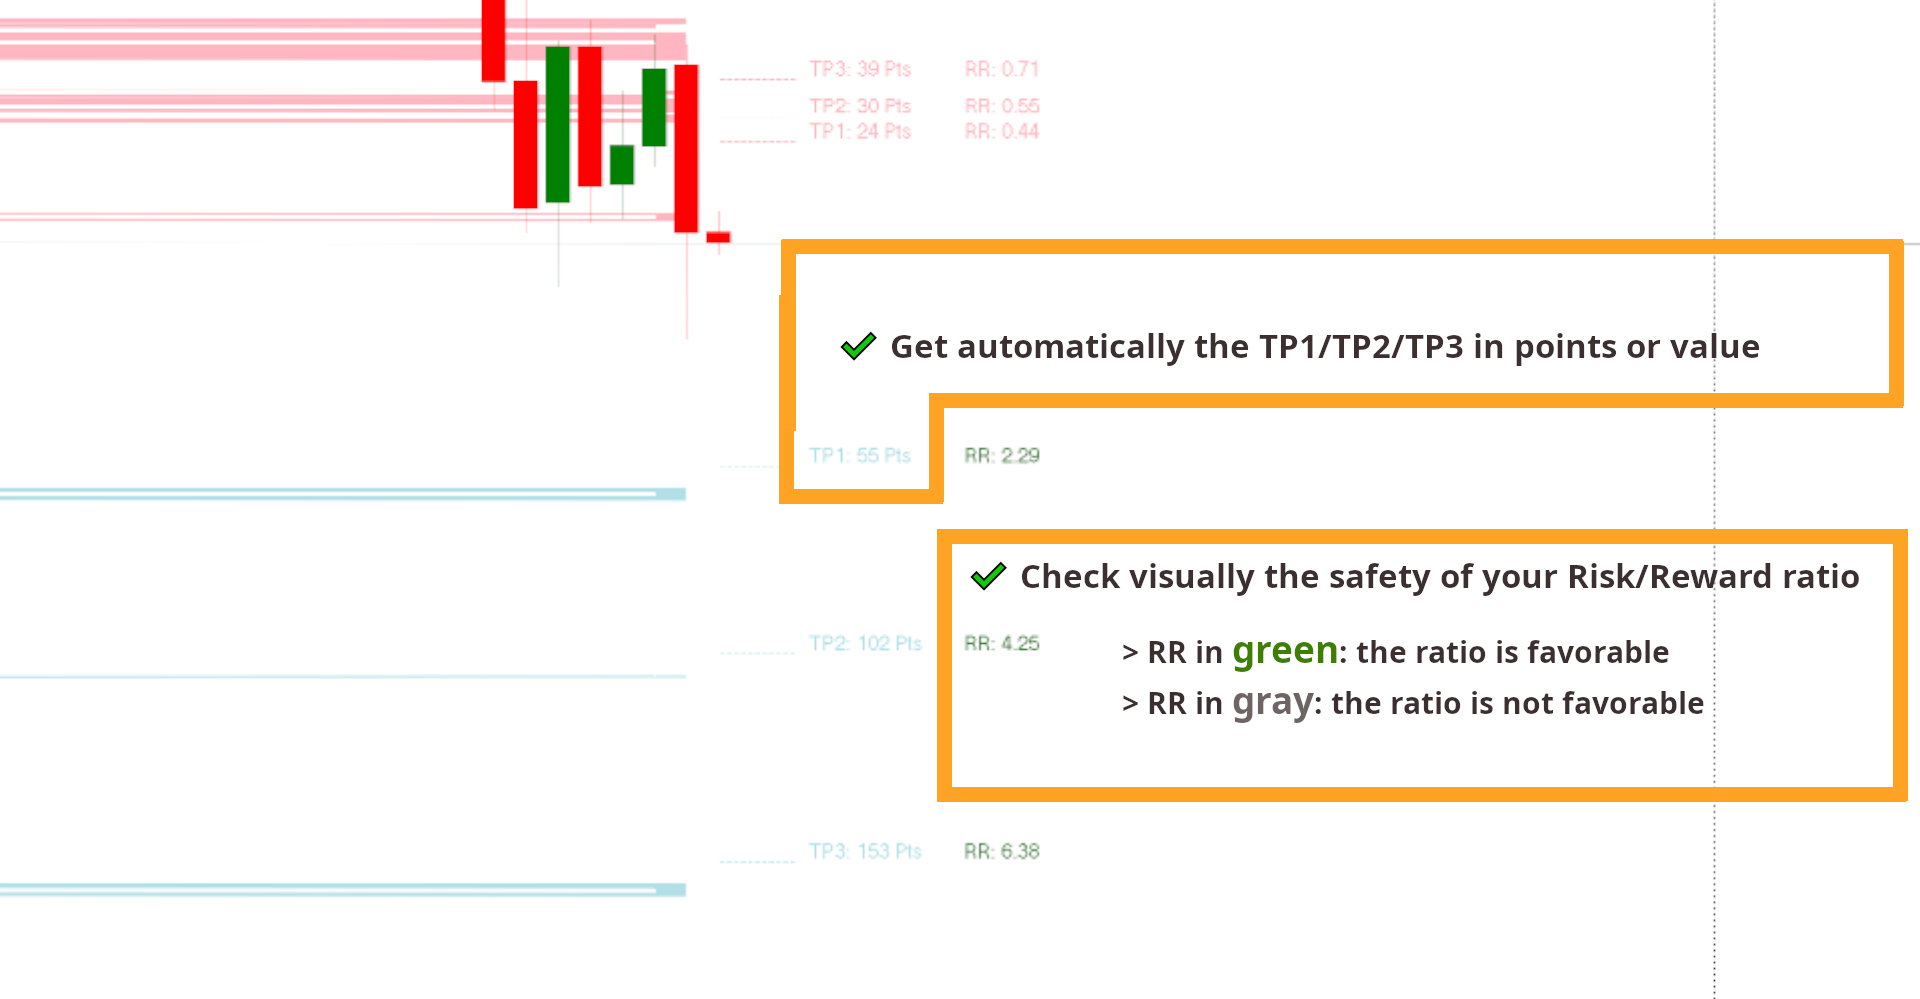
Strategic Zone touched x3, x4, x5 times >> TP1/TP2/TP3 in points or value >> Check visually the safety of your Risk/Reward ratio
Non-Repainting/Non-Redrawing and Non-Lagging Indicator - Ideal for both manual and robot trading - Fits all assets and all time frames
Limited time offer then back to >> $99
After purchase, please contact me on this channel for recommended and personalized settings
- MT4 version
Key Features
- Dynamic PowerZONES: Instantly visualize really strong support and resistance levels, allowing for precise Entry, StopLoss, TP1/2/3
- Customizable Alerts: Stay informed of potential trading opportunities with customizable alerts for breakout events.
- Multi-Timeframe Analysis: Seamlessly switch between different timeframes to gain a comprehensive view of market trends and price action.
- User-Friendly Interface: Intuitive design makes PowerZONES easy to use for both novice and experienced traders alike.
- Flexible Settings: Tailor PowerZONES to suit your trading style with customizable parameters and adjustable settings.
Why is it better?
We innovated on the basic Supports and Resistances concept by adding new features:
- Zones: that correspond better to real-life trading than lines
- Strength: we bring a simple option of how many times the Support/Resistance have been touched in the past
- Density of the Zones: which is the distance you want to have between 2 zones; the higher density, the more zones
- The zones change color depending on their position vs price: they turn red if the price is below them and blue if they are above
For the first time our indicator connects visually on the chart 3 concepts:
- The Zones that the market will test
- The potential TakeProfit Levels
- And a Risk Reward ratio between the support zones - for your Stop Loss and the resistances - for your TakeProfits
PowerZONES will change your trading routine and will help you stop impulsive trading.
NB: Please note that our product BladeSCALPER contains the PowerZONES indicator but without the TakeProfit and RiskReward option.

User didn't leave any comment to the rating
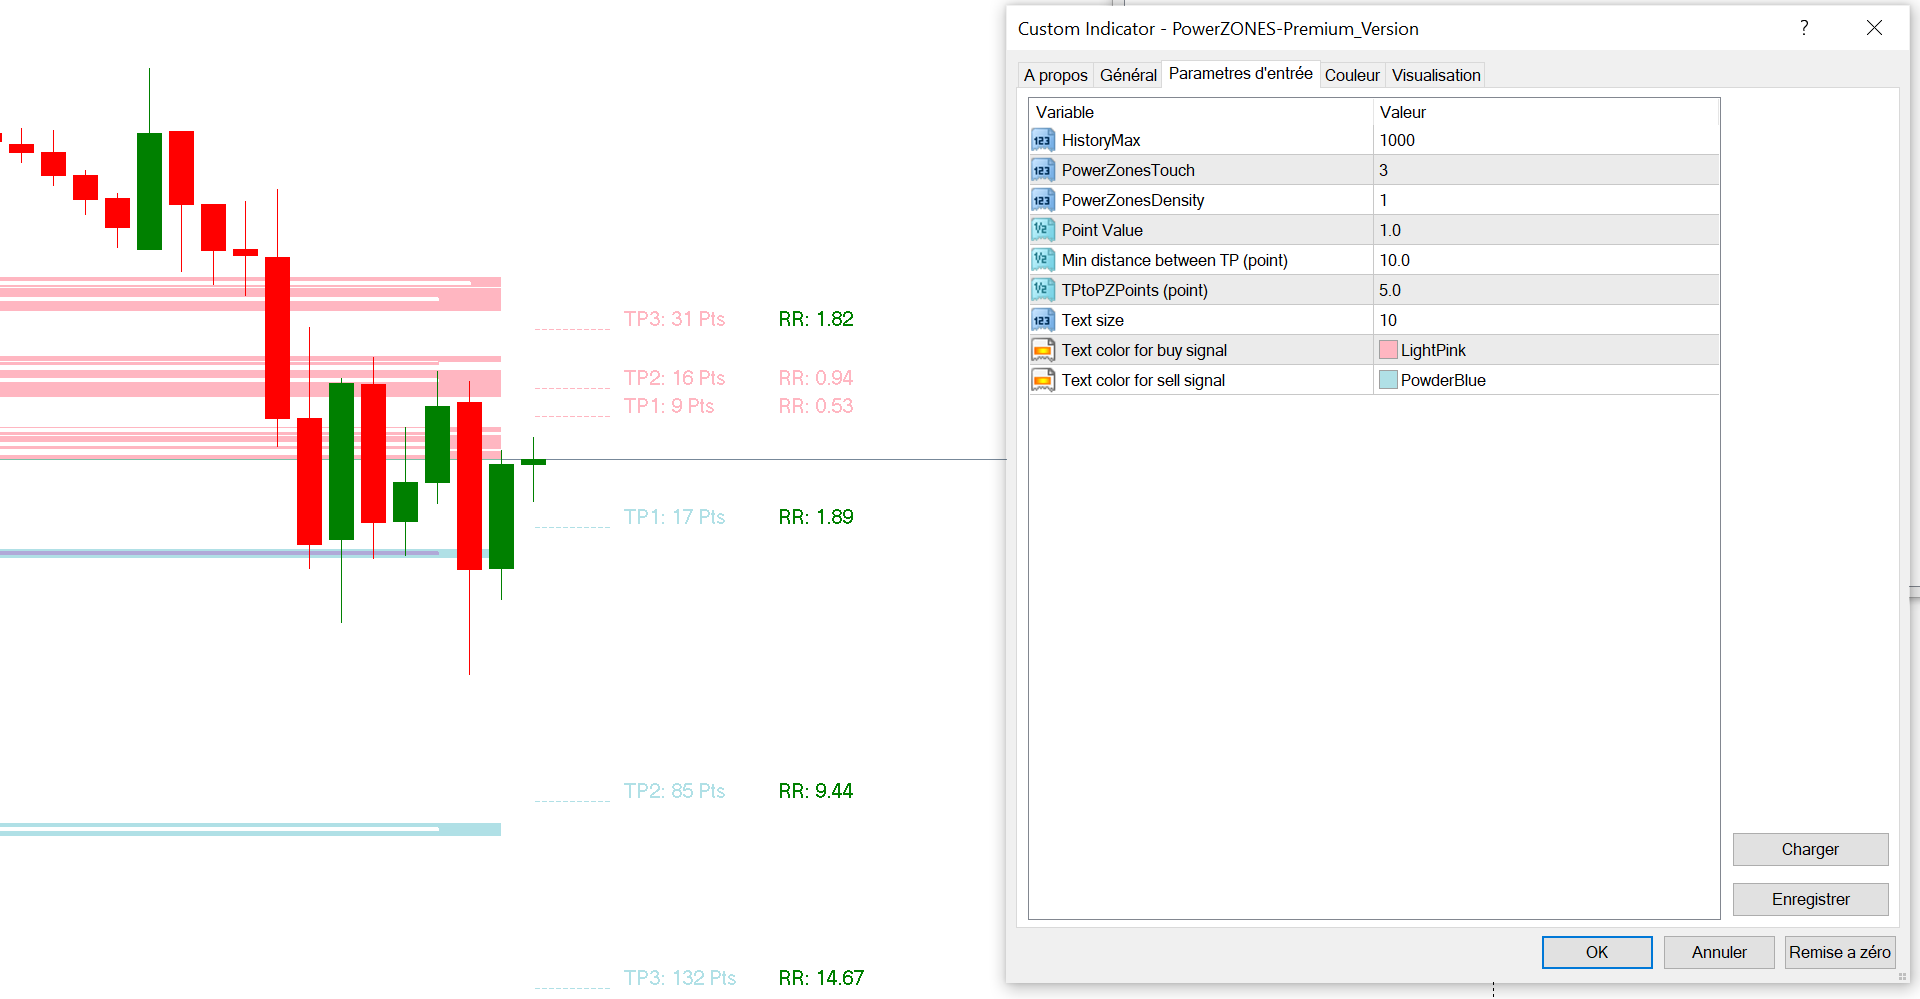
The picture you sent tells me that you did not change the parameters in the configuration menu "Min distance between TP" and "Point value". >> increase this distance up to 5 >> and "Point value" to 0.1 and you will see that everything will be clearer and much more useful. Please see in the comment section the picture I have sent you. Hope this quick assistance will make you change your review with a less severe notation (even if we respect it) ^^;-) I will make some cahnges in order not to cause these onboarding pb again.
So thanks !