Tick Flow Meter
- Utilities
- James Andrew Flannery
- Version: 1.1
- Updated: 16 April 2024
It is a cutting-edge indicator crafted to measure the intensity and frequency of ticks within specific time intervals. By focusing on tick flow, this indicator offers traders a unique perspective on market liquidity, momentum, and volatility, empowering them to make informed trading decisions.
Key Features:
-
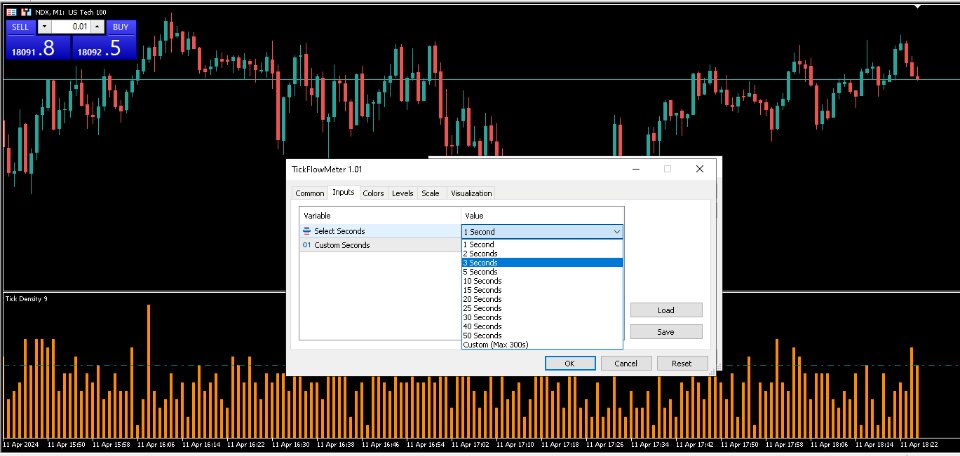
Granular Time Interval Selection: Choose from a wide range of predefined time intervals, including 1-second, 5-second, or 30-second periods, or customize your own timeframe to suit your trading strategy.
-
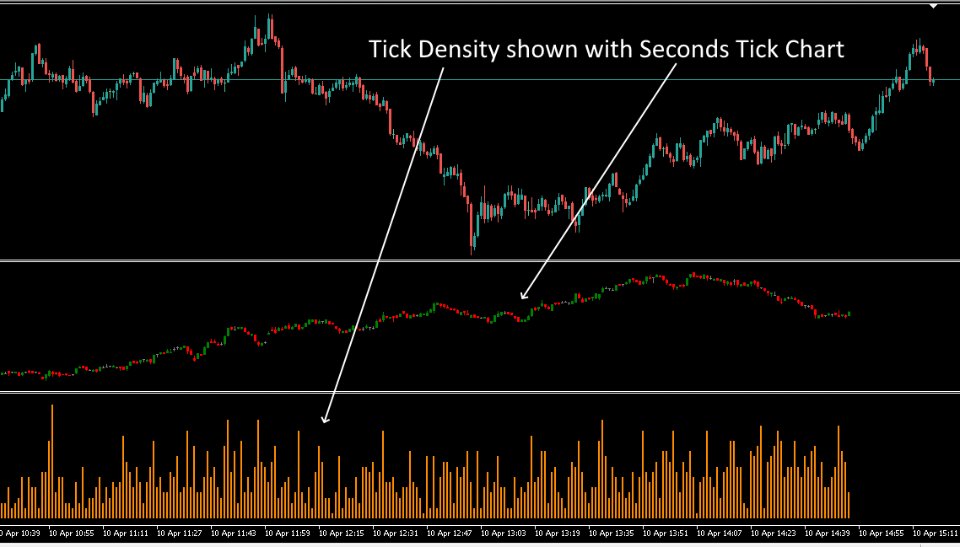
Dynamic Tick Density Analysis: Gain deep insights into market activity with real-time tick density analysis. The indicator visually represents tick flow using a histogram, allowing traders to identify periods of high or low market activity effortlessly.
-
Recommended Integration: Works well with the free Seconds Timeframe Candles indicator. By combining these two powerful intraday tools, traders can enhance their analysis and gain a comprehensive view of market volatility and activity.
-
Identify Trading Opportunities: Use the insights gained from the "Seconds Tick Flow Meter" to identify potential trading opportunities. Look for trends, momentum shifts, and patterns in tick flow to inform your trading decisions.
-
Compatible with intraday timeframes: The indicator supports intraday chart timeframes of H1 and below.
*Automatically resets if the timeframe is changed or after approximately 3 hours of continuous operation
The Tick Flow Meter is a powerful tool for traders seeking to gain a competitive edge in today's fast-paced markets. With its advanced tick density analysis and seamless integration with the 'Seconds Timeframe Candles' indicator, this tool empowers traders to make informed decisions and navigate the markets.
** Here is a little tip to sync the Tick Flow Meter with Seconds Timeframe Candle:
- Make sure both indicators are loaded up with the same seconds interval (e.g.10 seconds).
- Select a higher minute timeframe on your main chart.
- Now switch back to your original minute timeframe on the main chart and they should both be in sync.
