Super Breakouts Monitor
- Indicators
- Flavio Javier Jarabeck
- Version: 1.1
- Updated: 22 April 2024
- Activations: 20
Breakouts with strong momentum are challenging to catch. The purpose of the Super Breakouts Monitor is to identify such market conditions. This indicator is inspired by a concept from renowned Technical Analyst Tushar Chande, who combines two highly adaptive indicators, VIDYA and the Dynamic Momentum Index (both his creations), to capture the early stages of a successful breakout. At Minions Labs, we've added our unique enhancements to adapt these great ideas for modern markets like stocks, cryptocurrencies, indices, forex, and more.
WHY SHOULD I CARE about the Super Breakouts Monitor?
If you're a trader who loves a good breakout, this indicator provides early-stage signals.
Initially designed for Swing Trading in stocks, feedback from trader colleagues has shown that, with proper calibration, this indicator is versatile across various asset classes.
At Minions Labs, we allow you to test everything for free before committing any funds. We pride ourselves on our high ranking in the MQL5 ecosystem, thanks to our dedicated customer base and their enjoyment of our products worldwide. Our motto: Just Try It! For Free! No obligations! No Strings Attached! Experience the power of Minions Labs indicators.
HOW DOES THE Super Breakouts Monitor WORK?
The indicator uses a variable-length moving average called VIDYA, along with the Dynamic Momentum Index, an oscillator. This combination excels in identifying breakouts by adapting quickly to asset volatility. Additionally, we have integrated a 'BAND' feature adjustable via a percentage range, allowing full calibration for any asset. This feature helps visualize and capture potential breakouts, filtering out non-trending movements.
We have also incorporated a Trend Filtering tool, the Hull Moving Average, to add an extra layer of protection to your trades by ensuring you trade with the trend.
HOW TO "READ" the Super Breakouts Monitor
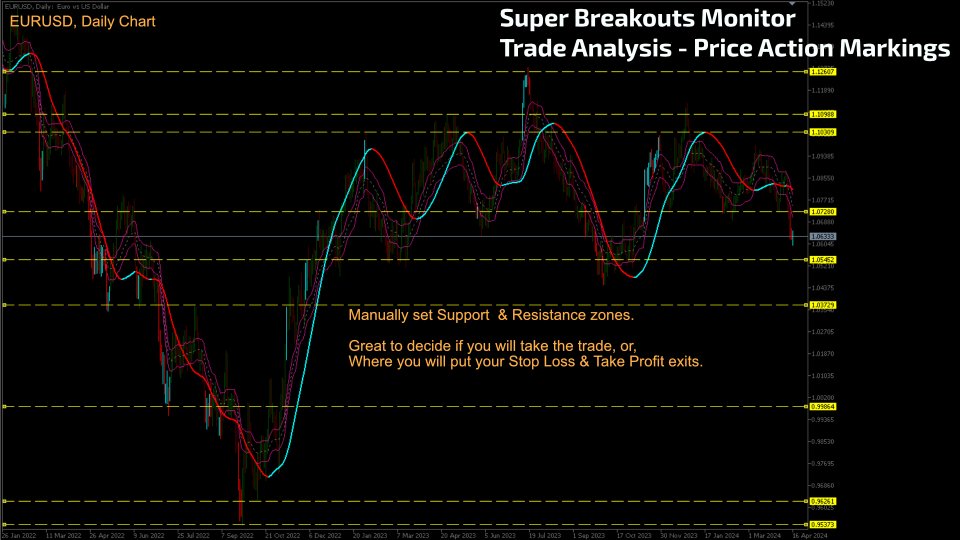
- No indicator or trading system is perfect; always use basic Price Action as a backdrop for your trading decisions, such as significant support and resistance areas.
- After calibrating the indicator, breakout signals will be indicated by highlighted candles. It’s important to note that using the CLOSE price may cause repaints; to ensure accuracy, wait for the candle to close before taking action.
- Leverage your knowledge about the asset you are trading to adjust the indicator's settings according to your risk preference.
Super Breakouts Monitor CALIBRATION PROCESS
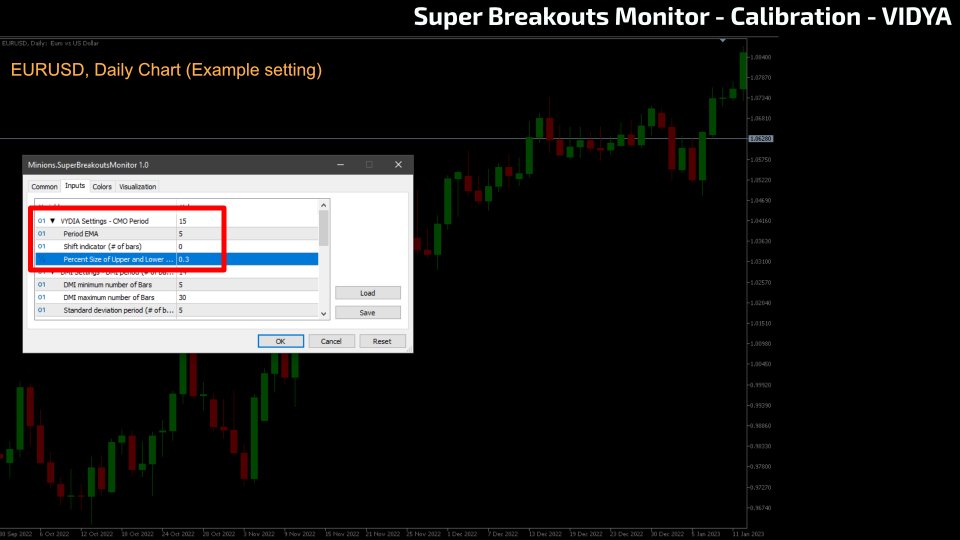
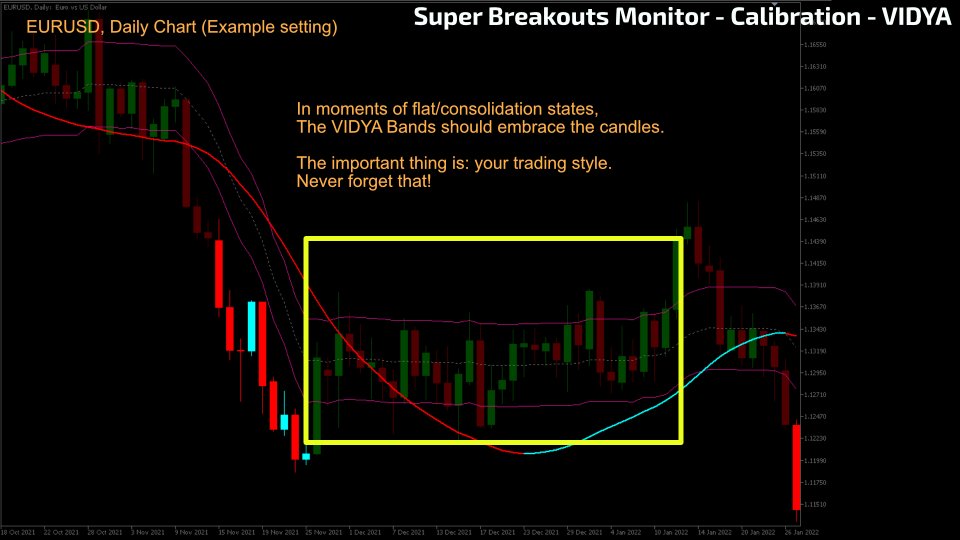
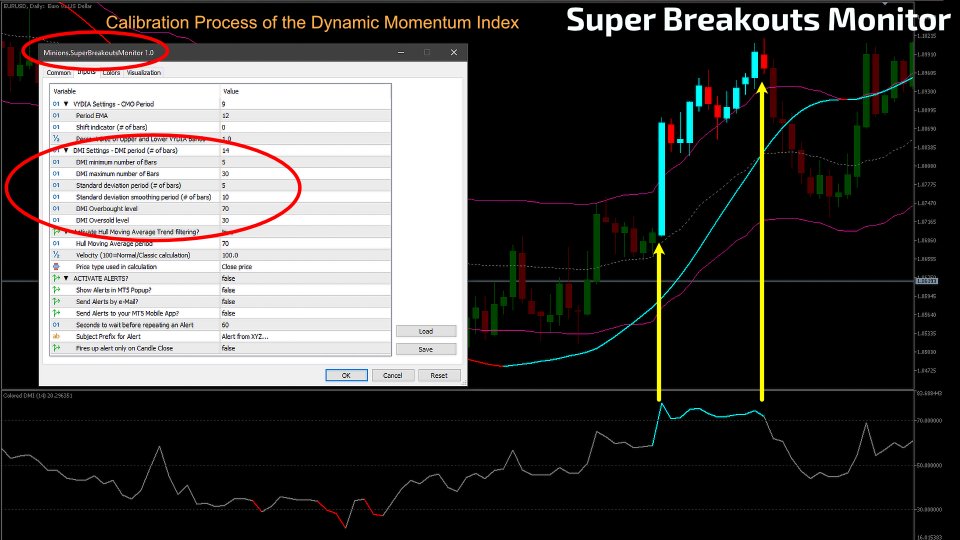
Calibration begins with the VIDYA indicator. This variable-length moving average responds dynamically to volatility, helping to 'hug' the common peaks and valleys of the asset's price action closely but not excessively. For a practical demonstration, please refer to the linked video.
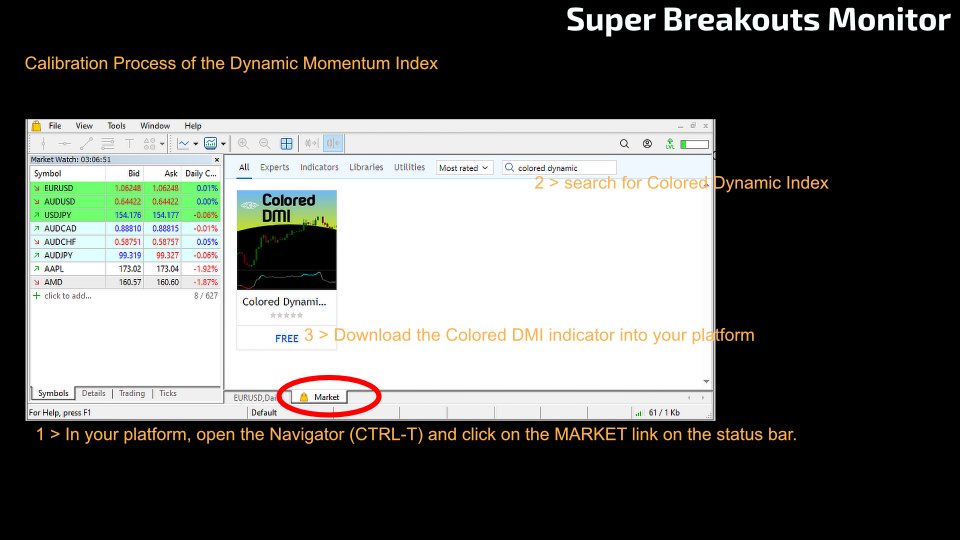
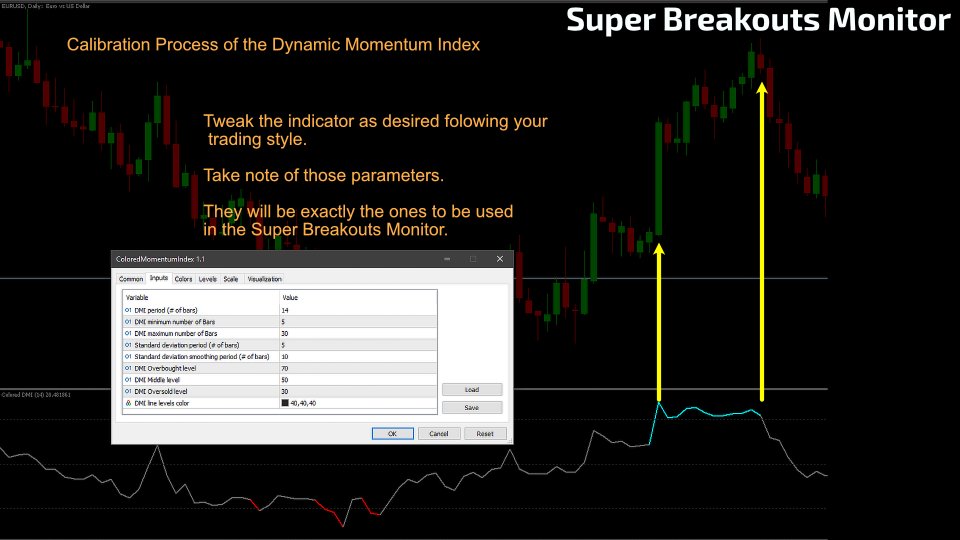
The Dynamic Momentum Index, better suited for spotting imminent breakouts than traditional indicators like the RSI, can be adjusted for overbought (70%) and oversold (30%) thresholds to fit your trading style. For step-by-step calibration, download our free Colored Dynamic Momentum Index from the MQL5 market.
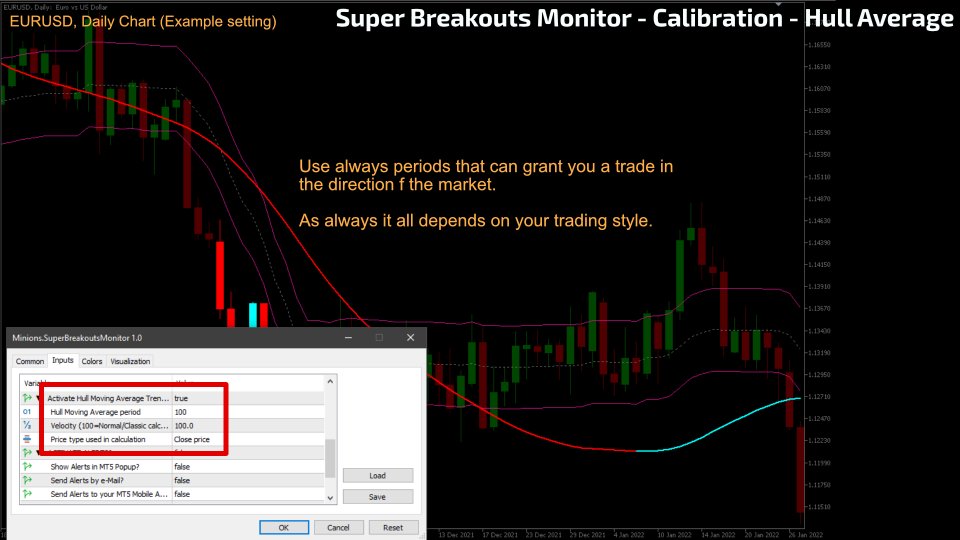
The final component in our system, the Hull Moving Average, provides rapid and smooth feedback on trend direction, aiding in decision-making about trade direction. Its settings can be adjusted or disabled as needed to match your trading strategy.
ASSETS CALIBRATION OF the Super Breakouts Monitor
Here are examples of settings for different assets, which you should adjust to fit your trading style and needs:
AMD (Advanced Micro Devices) - Daily Chart
- VIDYA - CMO Period: 15 / EMA: 7 / Shift: 0 / Band Size: 3%.
- DMI Period: 35 / Min: 5 / Max: 30 / StdDev: 5 / Smooth: 10 / Overbought: 70 / Oversold: 30.
- Hull Filtering: ON / Period: 150 / Price: CLOSE.
BTCUSD (Bitcoin) - Daily Chart
- VIDYA - CMO Period: 15 / EMA: 7 / Shift: 0 / Band Size: 3%.
- DMI Period: 35 / Min: 5 / Max: 30 / StdDev: 5 / Smooth: 10 / Overbought: 70 / Oversold: 30.
- Hull Filtering: ON / Period: 100 / Price: CLOSE.
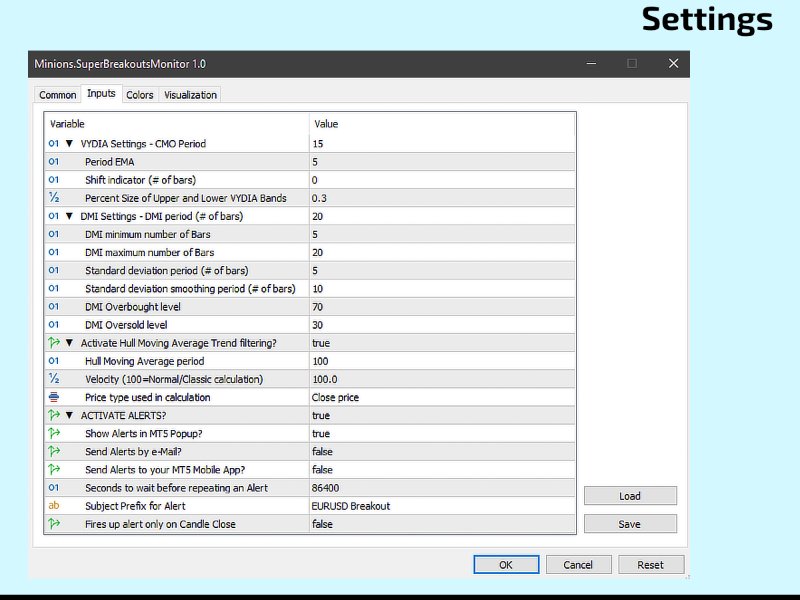
EURUSD (Euro USD FX) - Daily Chart
- VIDYA - CMO Period: 15 / EMA: 5 / Shift: 0 / Band Size: 0.3%.
- DMI Period: 20 / Min: 5 / Max: 20 / StdDev: 5 / Smooth: 10 / Overbought: 70 / Oversold: 30.
- Hull Filtering: ON / Period: 100 / Price: CLOSE.
Didn't Find a Feature You Need?
No product is perfect for everyone. If there's a feature you need that you can't find, please reach out to us. We value your feedback!
About Us
Flavio Jarabeck is the owner of MinionsLabs.com, dedicated to enhancing the skills and knowledge of professional traders with advanced trading robots and indicators, enabling them to explore new strategies in various markets and assets.

