Colored Dynamic Momentum Index DMI
- Indicators
- Flavio Javier Jarabeck
- Version: 1.1
- Updated: 5 April 2024
If you are (or were) a fan of the RSI indicator will love Tushar Chande's Dynamic Momentum Index indicator, that simply put is a dynamic variable lenght RSI, so it is more powerful. The DMI indicator internally uses a variable number of bars in its calculations, taking into consideration the volatility levels of the current market you are analyzing. This way, the DMI indicator will use more bars as volatility decreases and less bars when volatility increases, giving you a more powerfull analysis over the Overbought and Oversold stages of the asset being analyzed.
If you want to be more in depth with this subject, please read Tushar Chande & Stanley Kroll book "The New Technical Trader" from Wiley Finance.
How to "READ" the Colored Dynamic Momentum Index (DMI)
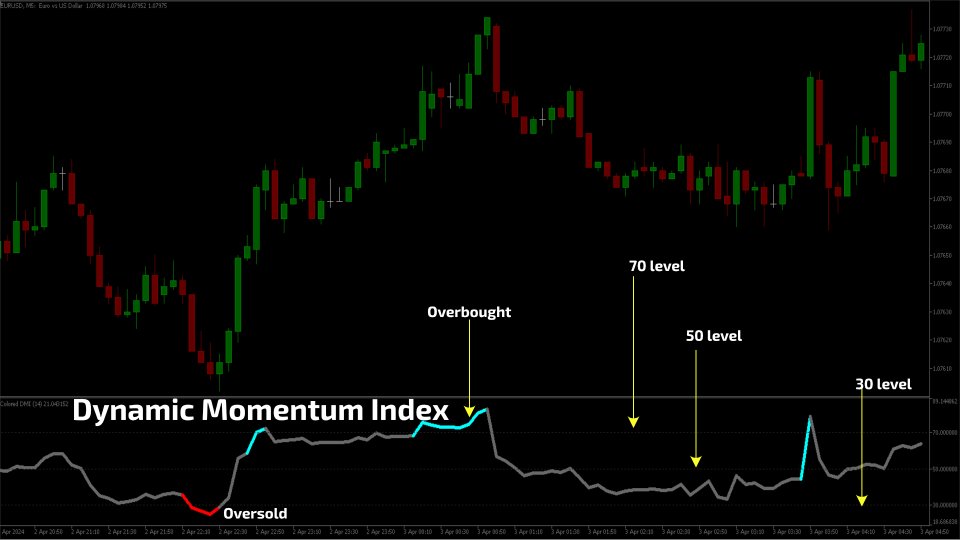
- Read as a RSI indicator, with traditionals levels set at 30 and 70. Of course, tweaking the settings will give you more accuracy analyzing your favorite asset. So try it!
- Readings below 30 are a Oversold state, and above 70, an Overbought state.
SETTINGS
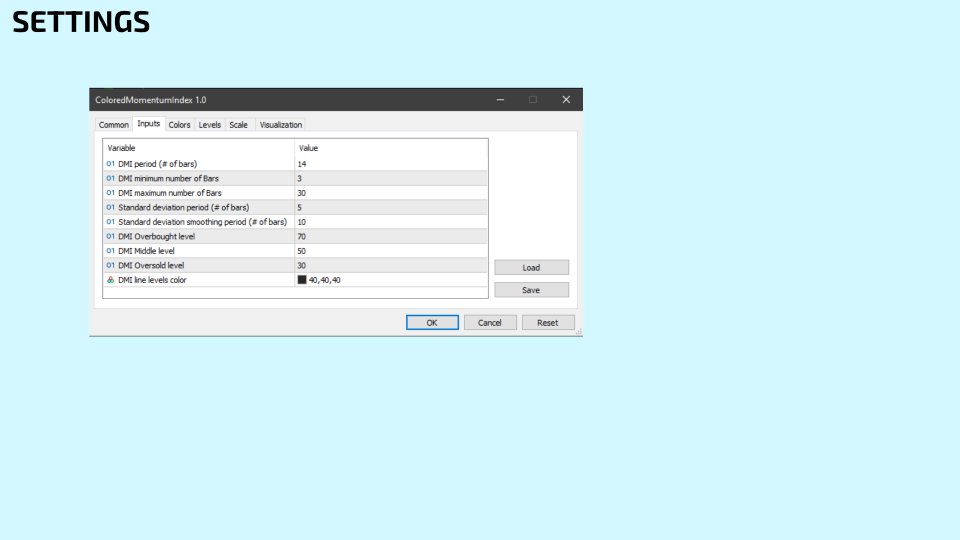
- DMI period (number of bars to analyze)
- DMI minimum number of bars to analyze. Default/Classic: 3 bars (days, if you are using daily charts)
- DMI maximum number of bars to analyze. DefaultClassic: 30 bars (days, if you are using daily charts)
- Standard Deviation period (number of bars). Default/Classiv: 5 bars (days, if you are using daily charts)
- Standard deviation smoothing period (bars). Default/Classic: 10 bars (days, if you are using daily charts)
- Overbought/Oversold levels.
If you like this indicator, all I am asking is a little Review (not a Comment, but a REVIEW!)...
This will mean A LOT to me... And this way I can continue to give away Cool Stuff for Free...
With No Strings Attached! Ever!
Live Long and Prosper!
;)


Indicador excelente, será que plotar uma média móvel no gráfico baseado nele seria possível, você tem alguma sugestão?