• Overview
  • Reviews
  • Comments

MovingAveragePRO

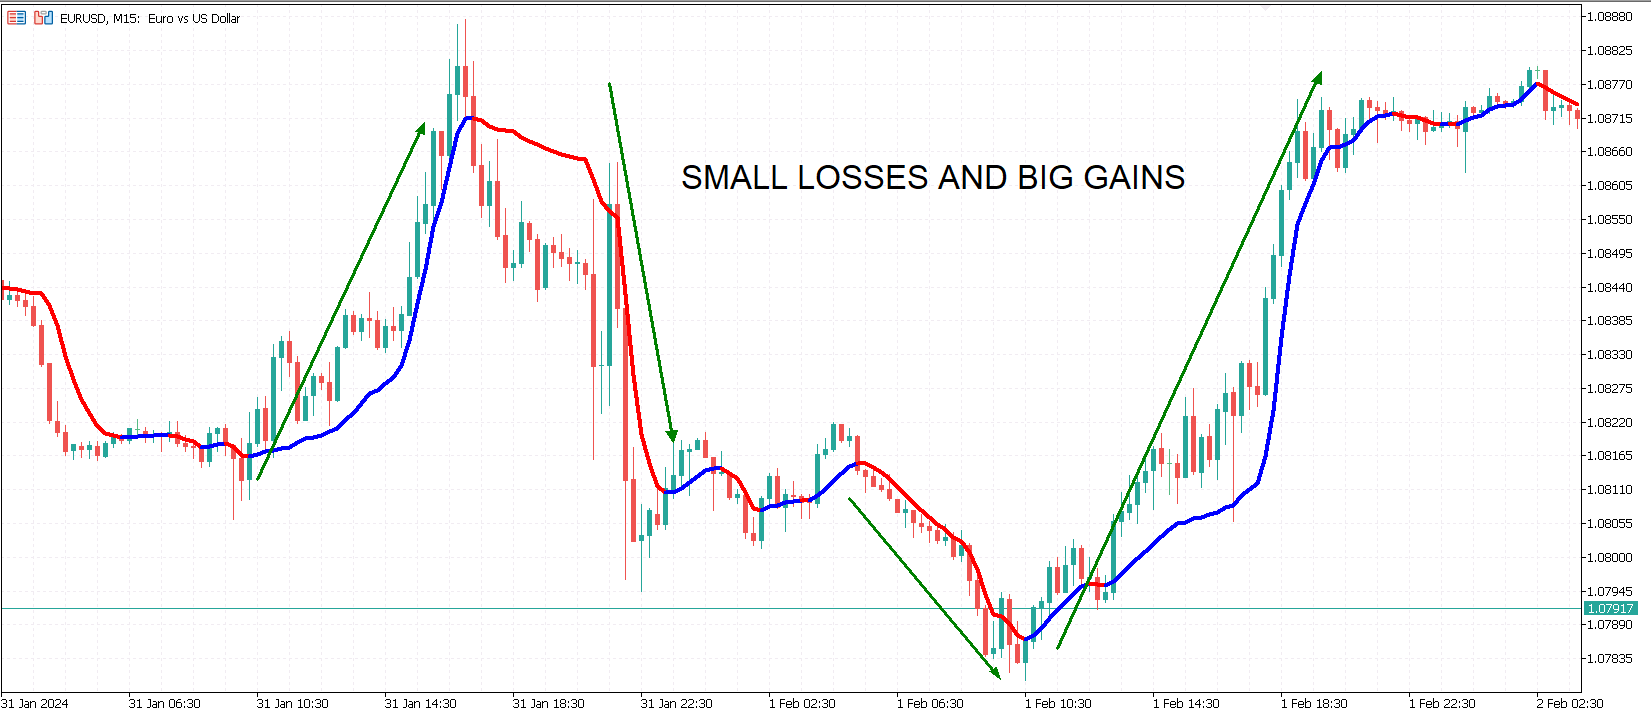
An invention that will turn your working principles upside down.

Especially in horizontal and stagnant markets, annoying losses can occur.

Besides, following trend lines, support and resistance can be tiring.

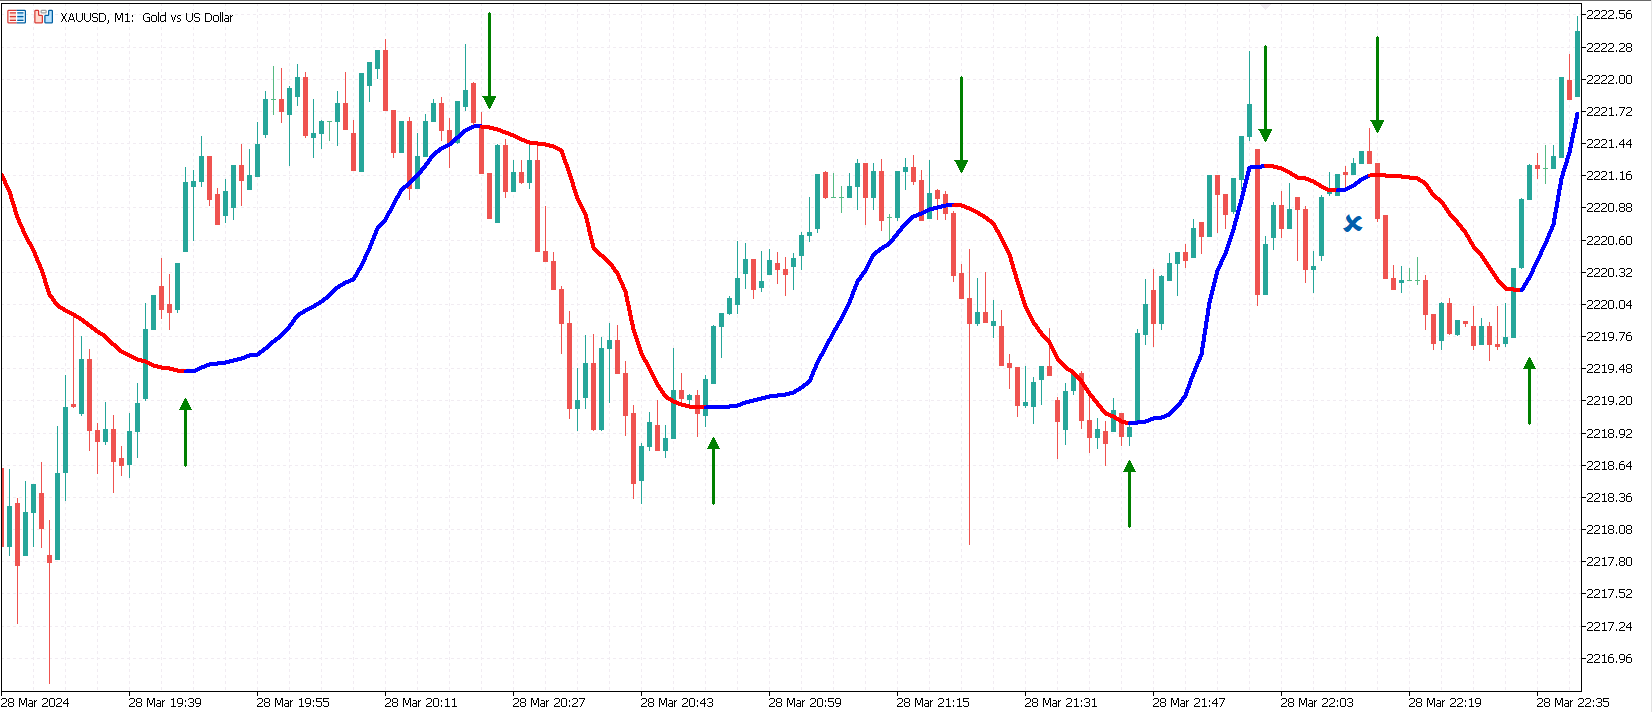
To put an end to all this, I decided to create a professional "moving average" indicator.

All you have to do is follow the colors.

If you need additional support, I recommend the "Heiken-Ashi" candle indicator in my profile.

I wish you lots of profit..
Recommended products
Was: $249  Now: $99   Market Profile defines a number of day types that can help the trader to determine market behaviour. A key feature is the Value Area, representing the range of price action where 70% of trading took place. Understanding the Value Area can give traders valuable insight into market direction and establish the higher odds trade. It is an excellent addition to any system you may be using. Inspired by Jim Dalton’s book “Mind Over Markets”, this indicator is designed to suit the
Market Session Visual
Kambiz Shahriarynasab
The  Market Sessions Indicator for MT5 helps you  predict market turnarounds  by detecting major supply and demand areas. These pivot points tend to occur after a new session has started and the previous one is still open. It is also used to gauge how many points or pips the market moves on average during a session. This helps us to place better our take profits and stop losses. The indicator works on all forex pairs, gold, silver, commodities, stocks, indices and any other instrument that yo
Indicator for determining flat and trend. If the price is below any of the two histograms and two lines (red and blue), this is a sell zone. When purchasing this version of the indicator, MT4 version for one real and one demo account - as a gift (to receive, write me a private message)! If the price is above any of the two histograms and two lines (red and blue), this is a buy zone. MT4 version:  https://www.mql5.com/ru/market/product/3793 If the price is between two lines or in the zone
This indicator will show you the TP and SL Values (in that currency) that you already set  for every orders on the charts  ( closed to the transaction/order line)  that will help you a lot to estimated your profit and loss for every order.    And it also show you the PIPs values too.  the shown format  is      " Currency Values of our Profit or Loss /  PIPs values ".    The TP Value will be shown in Green Color and  the SL Value  will be shown in Red Color.  For any question or more information,
No Demand No Supply MT5
Trade The Volume Waves Single Member P.C.
No Demand No Supply   This indicator identifies   No Demand –No Supply candles to your chart and plots volume bars colored according to the signal. It can be applied to all timeframes or to a specific one only. It can also be used as regular volume indicator  with exceptional future of WEIGHTED VOLUME. Furthermore is has an alert notification, sound and email when a signals occurs. The indicator does not repaint but the alert will come on two candles back due to the definition of No Demand No Su
PZ Mean Reversion MT5
PZ TRADING SLU
3 (2)
Outperform traditional strategies: effective mean reversion for savvy traders Special Offer: Purchase now to receive free bonuses worth $159! (Read more for details) Unique indicator that implements a professional and quantitative approach to mean reversion trading. It capitalizes on the fact that the price diverts and returns to the mean in a predictable and measurable fashion, which allows for clear entry and exit rules that vastly outperform non-quantitative trading strategies. [ Installati
KT Renko Patterns MT5
KEENBASE SOFTWARE SOLUTIONS
KT Renko Patterns scans the Renko chart brick by brick to find some famous chart patterns that are frequently used by traders across the various financial markets. Compared to the time-based charts, patterns based trading is easier and more evident on Renko charts due to their uncluttered appearance. KT Renko Patterns features multiple Renko patterns, and many of these patterns are extensively explained in the book titled Profitable Trading with Renko Charts by Prashant Shah. A 100% automate
PZ Trend Trading MT5
PZ TRADING SLU
3.67 (3)
Capture every opportunity: your go-to indicator for profitable trend trading Special Offer: Purchase now to receive free bonuses worth $159! (Read more for details) Trend Trading is an indicator designed to profit as much as possible from trends taking place in the market, by timing pullbacks and breakouts. It finds trading opportunities by analyzing what the price is doing during established trends. [ Installation Guide | Update Guide | Troubleshooting | FAQ | All Products ] Trade financial
Market Session Pro
Kambiz Shahriarynasab
The  Market Sessions Indicator for MT5 helps you  predict market turnarounds  by detecting major supply and demand areas. These pivot points tend to occur after a new session has started and the previous one is still open. It is also used to gauge how many points or pips the market moves on average during a session. This helps us to place better our take profits and stop losses. The indicator works on all forex pairs, gold, silver, commodities, stocks, indices and any other instrument that your
Surf Board
Mohammadal Alizadehmadani
Benefits of the Surfboard indicator : Entry signals without repainting If a signal appears and is confirmed, it does NOT disappear anymore, unlike indicators with repainting, which lead to major financial losses because they can show a signal and then remove it. perfect opening of trades The indicator algorithms allow you to find the Peak and floor position to enter a deal (buy or sell an asset), which increases the success rate for each and every trader using it. Surfboard works with any asse
Your Pointer is no ordinary Forex channel. This corridor is built on the basis of the analysis of several candles, starting from the last one, as a result of which the extremes of the studied interval are determined. They are the ones who create the channel lines. Like all channels, it has a middle line as well as a high and low line. This channel is worth watching for its unusual behavior. The use of the Your Pointer indicator allows the trader to react in time to the price going beyond the bo
To get access to MT4 version please click here . - This is the exact conversion from TradingView: "Stochastic Momentum Index" By "UCSgears". - This is a popular version of stochastic oscillator on tradingview. - This is a light-load processing and non-repaint indicator. - Buffers are available for the lines on chart. - You can message in private chat for further changes you need. Thanks for downloading
Thunder Scalper
Mr Fares Mohammad Alabdali
Buy and Sell Targets Indicator You can see the buying and selling goals in the box and they are inevitably achieved. It consists of three lines: the first green color sets buying targets, the second red color sets selling targets, and the third blue color is the average price. Trading Method For Buy Trade: The entry point will be where the wavy blue line  (representing the average price) is 'broken' by the ascending 'Buy' candle from beneath Please wait until the next candle appears
DYJ TradingView
Daying Cao
5 (1)
DYJ TRADINGVIEW is a multi indicator rating system, using the rating signals counts and analysis tools to find entry opportunities in global markets DYJ TRADINGVIEW has 10 built-in indicators for market analysis. Indicator-based analysis is used by many traders to help them make decisions on what trades to take and where to enter and exit them.  We use several different types that can complement each other well. Use us to follow your market, You can find more accurate transactions. The trend ind
Double HMA MTF for MT5
Pavel Zamoshnikov
3.67 (3)
This is an advanced multi-timeframe version of the popular Hull Moving Average (HMA) Features Two lines of the Hull indicator of different timeframes on the same chart. The HMA line of the higher timeframe defines the trend, and the HMA line of the current timeframe defines the short-term price movements. A graphical panel with HMA indicator data from all timeframes at the same time . If the HMA switched its direction on any timeframe, the panel displays a question or exclamation mark with a tex
Upgraded - Stars added to indentify Areas you can scale in to compound on your entry  when buying or selling version 2.4 Upgraded Notifications and alerts added version 2.3 *The indicator is suitable for all pairs fromm  Deriv pairs (Vix,jump,boom & crash indices) , Currencies, cryptos , stocks(USA100, USA30 ), and metals like gold etc. How does it work? Increasing the period make it more stable hence will only focus on important entry points However  lowering the period will mean the indica
Owl Smart Levels MT5
Sergey Ermolov
4.31 (39)
MT4 version  |   FAQ The Owl Smart Levels Indicator is a complete trading system within the one indicator that includes such popular market analysis tools as Bill Williams' advanced fractals , Valable ZigZag which builds the correct wave structure of the market, and Fibonacci levels which mark the exact levels of entry into the market and places to take profits. Detailed description of the strategy Instructions for working with the indicator Advisor-assistant in trading Owl Helper Private User
Market Profile MetaTrader System  — is a classic Market Profile implementation that can show the price density over time, outlining the most important price levels, value area, and control value of a given trading session. This indicator can be attached to timeframes between M1 and D1 and will show the Market Profile for daily, weekly, monthly, or even intraday sessions. Lower timeframes offer higher precision. Higher timeframes are recommended for better visibility. It is also possible to use a
Volume Profile V6
Andrey Kolesnik
4.5 (2)
Market volume profile indicator.  It works on almost all instruments - currency pairs, stocks, futures, on real volumes and on ticks.  It can be set as automatic determination of the range of building a profile, for example, for a week or a month, etc.  and set the range manually by moving the borders (two vertical lines red and blue).  Shown as a bar graph.  The width of the histogram at a given level means, conventionally, the number of trades made on it.  With the "Mode level line color" para
Mr Big MT5
Pavel Verveyko
The indicator shows and highlights the chart candles, which are formed as a result of large players entering the market in large volumes. Such candles can also be formed after achieving a certainty on the market, when most of the participants hold positions in the same direction. The movement is likely to continue in that direction after such candles. The indicator highlights the significant candles from the existing ones on the chart; The indicator allows identifying the trends based on candles
Banana Binary MT5 Signal
Nirundorn Promphao
1 (1)
Promotion $66 lifetime for you. The principle of this indicator is very simple: detecting the trend with Moving Average, then monitoring the return point of graph by using the crossing of Stochastic Oscillator and finally predicting BUY and SELL signal with arrows, alerts and notifications. The parameters are fixed and automatically calculated on each time frame. Example: If you install indicator on EURUSD, timeframe M5: the indicator will detect the main trend with the Moving Average on this t
Hull Suite By Insilico
Yashar Seyyedin
5 (2)
To get access to MT4 version please click here . - This is the exact conversion from TradingView: "Hull Suite" By "Insilico". - This is a light-load processing and non-repaint indicator. - You can message in private chat for further changes you need. Here is the source code of a simple Expert Advisor operating based on signals from  Hull Suite . #include <Trade\Trade.mqh> CTrade trade; int handle_hull= 0 ; input group "EA Setting" input int magic_number= 123456 ; //magic number input double fixe
PipFinite Exit EDGE MT5
Karlo Wilson Vendiola
4.89 (37)
Did You Have A Profitable Trade But Suddenly Reversed? In a solid strategy, exiting a trade is equally important as entering. Exit EDGE helps maximize your current trade profit and avoid turning winning trades to losers. Never Miss An Exit Signal Again Monitor all pairs and timeframes in just 1 chart www.mql5.com/en/blogs/post/726558 How To Trade You can close your open trades as soon as you receive a signal Close your Buy orders if you receive an Exit Buy Signal. Close your Sell orde
Noize Absorption Index - is the manual trading system that measures the difference of pressure between bears forces and bulls forces. Green line - is a noize free index that showing curent situation. Zero value of index shows totally choppy/flat market.Values above zero level shows how powerfull bullish wave is and values below zero measures bearish forces.Up arrow appears on bearish market when it's ready to reverse, dn arrow appears on weak bullish market, as a result of reverse expectation.
Your Trend Friend
Luigi Nunes Labigalini
5 (1)
The trend is your friend! Look at the color of the indicator and trade on that direction. It does not  repaint. After each candle is closed, that's the color of the trend. You can focus on shorter faster trends or major trends, just test what's most suitable for the symbol and timeframe you trade. Simply change the "Length" parameter and the indicator will automatically adapt. You can also change the color, thickness and style of the lines. Download and give it a try! There are big movements
Our   Basic Support and Resistance   indicator is the solution you need to boost your technical analysis. This indicator allows you to project support and resistance levels on the chart /   MT4 Version Features Integration of Fibonacci Levels:  With the option to display Fibonacci levels alongside support and resistance levels, our indicator gives you an even deeper insight into market behavior and possible reversal areas. Performance Optimization:  With the option to update extended lines
The   Supply and Demand Zones indicator   is one of the best tools we have ever made. This great tool automatically draws supply and demand zones, the best places for opening and closing positions. It has many advanced features such as multi timeframe zones support, displaying the width of zones, alert notifications for retouched zones, and much more. Because of market fractality, this indicator can be used for any kind of trading. Whether you are a positional, swing, or intraday trader does no
A huge number of traders use the VolumeProfile/MarketProfile analysis method. And I think there is no need to explain such concepts as POC and VAH/VAL. However, the standard VolumeProfile representation has a drawback - we only see the current picture of the market. We see the "convexity" of the volume distribution within the period. But we don't see the main thing - the "migration" of the POC level during the price movement. Our indicator is unique. It is dynamic. The first feature is that the
Pmax
Celal Engin Baka
PMax is a brand new indicator developed by KivancOzbilgic in earlier 2020. It's a combination of two trailing stop loss indicators; One is Anıl Özekşi's MOST (Moving Stop Loss) Indicator and the other one is well known ATR based SuperTrend. Both MOST and SuperTrend Indicators are very good at trend following systems but conversely their performance is not bright in sideways market conditions like most of the other indicators. Profit Maximizer - PMax tries to solve this problem.   PMax
SMT (Smart Money Technique) Divergence refers to the price divergence between correlated assets or their relationship to inversely correlated assets.  By analyzing SMT Divergence, traders can gain insights into the market's institutional structure and identify whether smart money is accumulating or distributing assets.  Every price fluctuation should be confirmed by market symmetry, and any price asymmetry indicates an SMT Divergence, suggesting a potential trend reversal. MT4 Version -  https:/
Buyers of this product also purchase
Atomic Analyst MT5
Issam Kassas
4.79 (19)
First of all Its worth emphasizing here that this Trading Indicator is   Non-Repainting   , Non Redrawing and Non Lagging Indicator   Indicator, Which makes it ideal from both manual and robot trading.  User manual: settings, inputs and strategy . The Atomic Analyst  is a PA Price Action Indicator that uses Strength and Momentum of the price to find a better edge in the market. Equipped with Advanced filters which help remove noises and false signals, and Increase Trading Potential. Using Mult
First of all Its worth emphasizing here that this Trading System is Non-Repainting   , Non Redrawing and Non Lagging Indicator Which makes it ideal from both manual and robot trading .  Online course, manual and download presets. The Smart Trend Trading System MT5 is a comprehensive trading solution tailored for new and experienced traders . It combines over 10 premium indicators and features more than 7 robust trading strategies , making it a versatile choice for diverse market conditions . Tre
Gold Stuff mt5
Vasiliy Strukov
4.9 (183)
Gold Stuff mt5 is a trend indicator designed specifically for gold and can also be used on any financial instrument. The indicator does not redraw and does not lag. Recommended time frame H1. Contact me immediately after the purchase to get   personal bonus!  You can get a free copy of our Strong Support and Trend Scanner indicator, please pm. me! Settings  and manual   here   SETTINGS Draw Arrow - on off. drawing arrows on the chart. Alerts -   on off audible alerts. E-mail notification - on of
TPSpro RFI Levels MT5
Roman Podpora
4.67 (9)
Reversal First Impulse levels (RFI)      INSTRUCTIONS        RUS       -       ENG              R ecommended to use with an indicator   -   TPSpro  TREND PRO -  Version MT4                 A key element in trading is zones or levels from which decisions to buy or sell a trading instrument are made. Despite attempts by major players to conceal their presence in the market, they inevitably leave traces. Our task was to learn how to identify these traces and interpret them correctly. Main functi
TPSproTREND PrO MT5
Roman Podpora
4.89 (9)
TPSpro TREND PRO  - is a trend indicator that automatically analyzes the market and provides information about the trend and each of its changes, as well as giving signals for entering trades without redrawing! The indicator uses each candle, analyzing them separately. referring to different impulses - up or down impulse. Exact entry points into transactions for currencies, crypto, metals, stocks, indices!  Version MT4               DETAILED DESCRIPTION               R ecommended to use with an
Trend Screener Pro MT5
STE S.S.COMPANY
4.88 (67)
Unlock the Power of Trends Trading with the Trend Screener Indicator: Your Ultimate Trend Trading Solution powered by Fuzzy Logic and Multi-Currencies System! Elevate your trading game with the Trend Screener, the revolutionary trend indicator designed to transform your Metatrader into a powerful Trend Analyzer. This comprehensive tool leverages fuzzy logic and integrates over 13 premium features and three trading strategies, offering unmatched precision and versatility. LIMITED TIME OFFER : Tre
Quantum Trend Sniper
Bogdan Ion Puscasu
4.92 (48)
Introducing   Quantum Trend Sniper Indicator , the groundbreaking MQL5 Indicator that's transforming the way you identify and trade trend reversals! Developed by a team of experienced traders with trading experience of over 13 years,   Quantum Trend Sniper Indicator   is designed to propel your trading journey to new heights with its innovative way of identifying trend reversals with extremely high accuracy. ***Buy Quantum Trend Sniper Indicator and you could get Quantum Breakout Indicator fo
FX Power MT5 NG
Daniel Stein
5 (6)
Trading GOLD, and currencies, with the dog walk strategy  - super smart Trading GOLD, and currencies, with the breakout strategy  - super easy Visit our all-new   Stein Investments Welcome Page   to get the latest information, updates and trading strategies. FX Power MT5 NG  is the next generation of our long-time very popular currency strength meter, FX Power.  And what does this next-generation strength meter offer? Everything you have loved about the original FX Power  PLUS GOLD/XAU st
First of all Its worth emphasizing here that this Trading Tool is Non Repainting , Non Redrawing and Non Lagging Indicator , Which makes it ideal for professional trading . Online course, user manual and demo. The Smart Price Action Concepts Indicator is a very powerful tool for both new and experienced traders . It packs more than 20 useful indicators into one , combining advanced trading ideas like Inner Circle Trader Analysis and Smart Money Concepts Trading Strategies . This indicator focus
IX Power MT5
Daniel Stein
4.17 (6)
IX Power   finally brings the unbeatable precision of FX Power to all your trading symbols. It accurately determines the intensity of short, medium and long-term trends in your favourite indices, stocks, commodities, ETFs, and even cryptocurrencies. You can   analyse everything   your terminal has to offer. Try it out and experience how   your timing improves significantly   when trading. Read about our latest strategic development -  Easy scalping with IX Power Visit our all-new   Stein Inve
This dashboard shows the latest available   harmonic patterns   for the selected symbols, so you will save time and be more efficient /   MT4 version . Free Indicator:   Basic Harmonic Pattern Indicator columns Symbol:  the selected symbols will appear Trend:   bullish or bearish Pattern:  type of pattern (gartley, butterfly, bat, crab, shark, cypher or ABCD) Entry:  entry price SL:  stop loss price TP1:   1st take profit price TP2:  2nd take profit price TP3:  3rd take profit price Current
Top indicator for MT5   providing accurate signals to enter a trade without repainting! It can be applied to any financial assets:   forex, cryptocurrencies, metals, stocks, indices .  Watch  the video  (6:22) with an example of processing only one signal that paid off the indicator! MT4 version is here It will provide pretty accurate trading signals and tell you when it's best to open a trade and close it. Most traders improve their trading results during the first trading week with the help of
How many times have you bought a trading indicator with great back-tests, live account performance proof with fantastic numbers and stats all over the place but after using it, you end up blowing your account? You shouldn't trust a signal by itself, you need to know why it appeared in the first place, and that's what RelicusRoad Pro does best! NOW $147 (increasing to $499 after a few updates) - UNLIMITED ACCOUNTS (PCs or MACs) **  User Manual + Strategies + Training Videos + Private Group with
ICT, SMC, SMART MONEY CONCEPTS, SMART MONEY, Smart Money Concept, Support and Resistance, Trend Analysis, Price Action, Market Structure, Order Blocks, BOS/CHoCH,   Breaker Blocks ,  Momentum Shift,   Supply&Demand Zone/Order Blocks , Strong Imbalance, HH/LL/HL/LH,    Fair Value Gap, FVG, Invert FVG, IFVG,  Premium  &   Discount   Zones, Fibonacci Retracement, OTE, Buy Side Liquidity, Sell Side Liquidity, BSL/SSL Taken, Equal Highs & Lows, MTF Dashboard, Multiple Time Frame, BigBar, HTF OB, HTF
Easy By Sell is a market indicator for opening and closing positions. It becomes easy to track market entries with alerts. It indicates trend reversal points when a price reaches extreme values ​​and the most favorable time to enter the market. it is as effective as a Fibonacci to find a level but it uses different tools such as an algorithm based on ATR indicators and Stochastic Oscillator. You can modify these two parameters as you wish to adapt the settings to the desired period. My othe
Blahtech Supply Demand MT5
Blahtech Limited
4.54 (13)
Was: $299  Now: $99   Supply Demand uses previous price action to identify potential imbalances between buyers and sellers. The key is to identify the better odds zones, not just the untouched ones. Blahtech Supply Demand indicator delivers functionality previously unavailable on any trading platform. This 4-in-1 indicator not only highlights the higher probability zones using a multi-criteria strength engine, but also combines it with multi-timeframe trend analysis, previously confirmed swings
Advanced Supply Demand MT5
Bernhard Schweigert
4.53 (15)
Best Solution for any Newbie or Expert Trader! This indicator is a unique, high quality and affordable trading tool because we have incorporated a number of proprietary features and a new formula. With this update, you will be able to show double timeframe zones. You will not only be able to show a higher TF but to show both, the chart TF, PLUS the higher TF: SHOWING NESTED ZONES. All Supply Demand traders will love it. :) Important Information Revealed Maximize the potential of Advanced Suppl
Introduction to X3 Chart Pattern Scanner X3 Cherart Pattern Scanner is the non-repainting and non-lagging indicator detecting X3 chart patterns including Harmonic pattern, Elliott Wave pattern, X3 patterns, and Japanese Candlestick patterns. Historical patterns match with signal patterns. Hence, you can readily develop the solid trading strategy in your chart. More importantly, this superb pattern scanner can detect the optimal pattern of its kind. In addition, you can switch on and off individu
AW Trend Predictor MT5
AW Trading Software Limited
4.78 (58)
The combination of trend and breakdown levels in one system. An advanced indicator algorithm filters market noise, determines the trend, entry points, as well as possible exit levels. Indicator signals are recorded in a statistical module, which allows you to select the most suitable tools, showing the effectiveness of the signal history. The indicator calculates Take Profit and Stop Loss marks. Manual and instruction ->  HERE  / MT4 version ->  HERE How to trade with the indicator:  Trading wit
FX Trend MT5
Daniel Stein
4.68 (37)
Visit our all-new   Stein Investments Welcome Page   to get the latest information, updates and trading strategies. Do you want to become a constantly profitable 5-star forex trader? Then  get our Stein Investments trading tools  and send us a screenshot to get your personal invitation to our exclusive trading chat with 500+ members. FX Trend displays the trend direction, duration, intensity and the resulting trend rating for all time frames in real time. You'll see at a glance at which dire
Introducing   Quantum Breakout PRO , the groundbreaking MQL5 Indicator that's transforming the way you trade Breakout Zones! Developed by a team of experienced traders with trading experience of over 13 years,   Quantum Breakout PRO   is designed to propel your trading journey to new heights with its innovative and dynamic breakout zone strategy. Quantum Breakout Indicator will give you signal arrows on breakout zones with 5 profit target zones and stop loss suggestion based on the breako
Auto Order Block with break of structure based on ICT and Smart Money Concepts (SMC) Futures Break of Structure ( BoS )             Order block ( OB )            Higher time frame Order block / Point of Interest ( POI )    shown on current chart           Fair value Gap ( FVG ) / Imbalance   -  MTF      ( Multi Time Frame )    HH/LL/HL/LH  -  MTF      ( Multi Time Frame )  Choch  MTF      ( Multi Time Frame )  Volume Imbalance     ,  MTF          vIMB Gap’s Power of 3 Equal High
AT Forex Indicator MT5
Marzena Maria Szmit
5 (4)
The AT Forex Indicator MT5 is a sophisticated trading tool designed to provide traders with a comprehensive analysis of multiple currency pairs. This powerful indicator simplifies the complex nature of the forex market, making it accessible for both novice and experienced traders. AT Forex Indicator uses advanced algorithms to detect trends, patterns and is an essential tool for traders aiming to enhance their forex trading performance. With its robust features, ease of use, and reliable signal
Matrix Arrow Indicator MT5
Juvenille Emperor Limited
5 (14)
Matrix Arrow Indicator MT5  is a unique 10 in 1 trend following   100% non-repainting  multi-timeframe indicator that can be used on all symbols/instruments:   forex,   commodities,   cryptocurrencies,   indices,   stocks .  Matrix Arrow Indicator MT5  will determine the current trend at its early stages, gathering information and data from up to 10 standard indicators, which are: Average Directional Movement Index (ADX) Commodity Channel Index (CCI) Classic Heiken Ashi candles Moving Aver
Gold TMAF MTF  - this is a best stock technical indicator. The indicator algorithm analyzes the price movement of an asset and reflects volatility and potential entry zones. The best indicator signals: For SELL = red upper boundary of TMA2 above the red upper boundary of TMA1 + red fractal indicator above + yellow SR signal arrow in the same direction. For BUY = blue lower boundary of TMA2 below the blue lower boundary of TMA1 + blue fractal indicator from below + aqua SR signal arrow in the s
Automated Trendlines MT5
Georgios Kalomoiropoulos
Trendlines  are the most essential tool of technical analysis in forex trading.  Unfortunately, most  traders don’t draw them correctly. Automated Trendlines indicator is a professional tool for serious traders that help you visualize the trending movement of the markets . AMAZING OFFER --> Activations from 5 to 20 for "MTF Supply Demand Zones" and "Automated Trendlines" There are two types of Trendlines Bullish Trendlines and Bearish Trendlines. In the uptrend, Forex trend line is drawn th
Elliott Wave Trend was designed for the scientific wave counting. This tool focuses to get rid of the vagueness of the classic Elliott Wave Counting using the guideline from the template and pattern approach. In doing so, firstly Elliott Wave Trend offers the template for your wave counting. Secondly, it offers Wave Structural Score to assist to identify accurate wave formation. It offers both impulse wave Structural Score and corrective wave Structure Score. Structural Score is the rating to sh
Gartley Hunter Multi
Siarhei Vashchylka
5 (8)
Gartley Hunter Multi - An indicator for searching for harmonic patterns simultaneously on dozens of trading instruments and on all possible timeframes. Manual (Be sure to read before purchasing) | Version for MT4 Advantages 1. Patterns: Gartley, Butterfly, Shark, Crab. Bat, Alternate Bat, Deep Crab, Cypher 2. Simultaneous search for patterns on dozens of trading instruments and on all possible timeframes 3. Search for patterns of all possible sizes. From the smallest to the largest 4. A
Golden Spikes Premium
Kwaku Bondzie Ghartey
Golden Spikes Detector Overview: The Golden Spikes Premium is a groundbreaking trading indicator meticulously crafted for the Boom and Crash indices on the Deriv market. Tailored to meet the needs of discerning traders, this powerful tool operates exclusively on the one-minute timeframe, providing timely and precise signals to maximize your trading potential. The Golden Spikes Detector stands out in its ability to deliver accurate signals, ensuring that you capitalize on market opportunities wit
FX Volume MT5
Daniel Stein
4.94 (17)
Visit our all-new   Stein Investments Welcome Page   to get the latest information, updates and trading strategies. FX Volume is the FIRST and ONLY volume indicator that provides a REAL insight into the market sentiment from a broker's point of view. It provides awesome insights into how institutional market participants, like brokers, are positioned in the Forex market, much faster than COT reports. Seeing this information directly on your chart is the real game-changer and breakthrough solut
More from author
SuperTrendCCI
Volkan Mustafaoglu
The best quality application of the famous Super Trend indicator that requires no introduction. It is completely faithful to the original algorithm and powered by the CCI indicator. - easy to trade - It implements all kinds of warnings. - It implements a multi-timezone dashboard. - It cannot be repainted or backpainted. Input parameters - ATR Period – This is the average true range period. - ATR Multiplier - The ATR multiplier that defines the trend. - CCI - Makes trend following powerful. -
Heikin Ashi Heikin Ashi is a charting technique that can be used to predict future price movements. It is similar to traditional candlestick charts. However, unlike a regular candlestick chart, the Heikin Ashi chart attempts to filter out some of the market noise by smoothing out strong price swings to better identify trend movements in the market. To create Heiken Ashi, a formula is used in which price data is entered, while ordinary candles are built only on bare numbers, without using any
OriginalSuperTrend
Volkan Mustafaoglu
Supertrend is a trend following indicator based on   the Average True Range   (ATR)   . Calculating the odd line combines trend detection and volatility. It can be used to detect changes in trend direction and position stops. Basic knowledge Supertrend is a trend following indicator. It takes up space on the main chart and its plots show the current trend. A Supertrend can be used for varying durations (daily, weekly, intraday, etc.) and varying instruments (stocks, futures or forex). Super
Filter:
No reviews
Reply to review