• Overview
  • Reviews
  • Comments

Heiken Ashi Suavizado

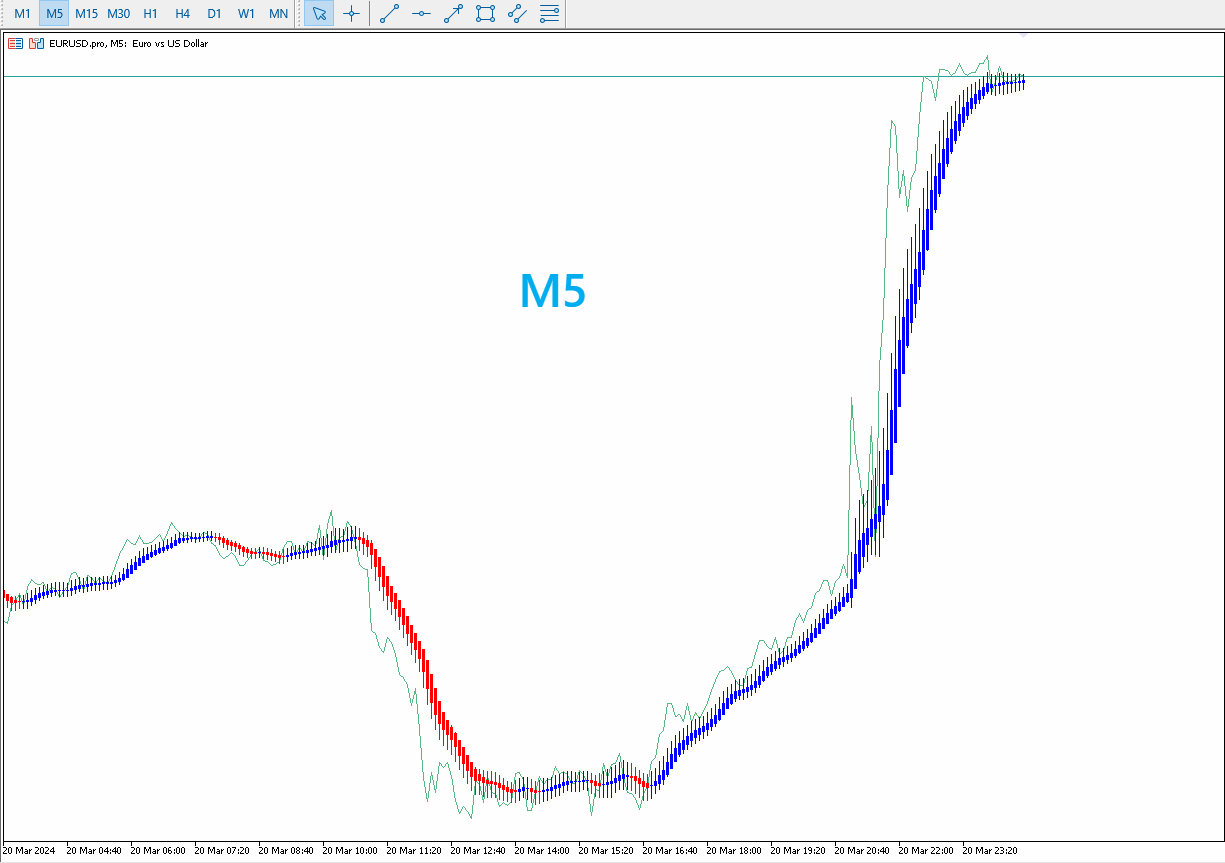
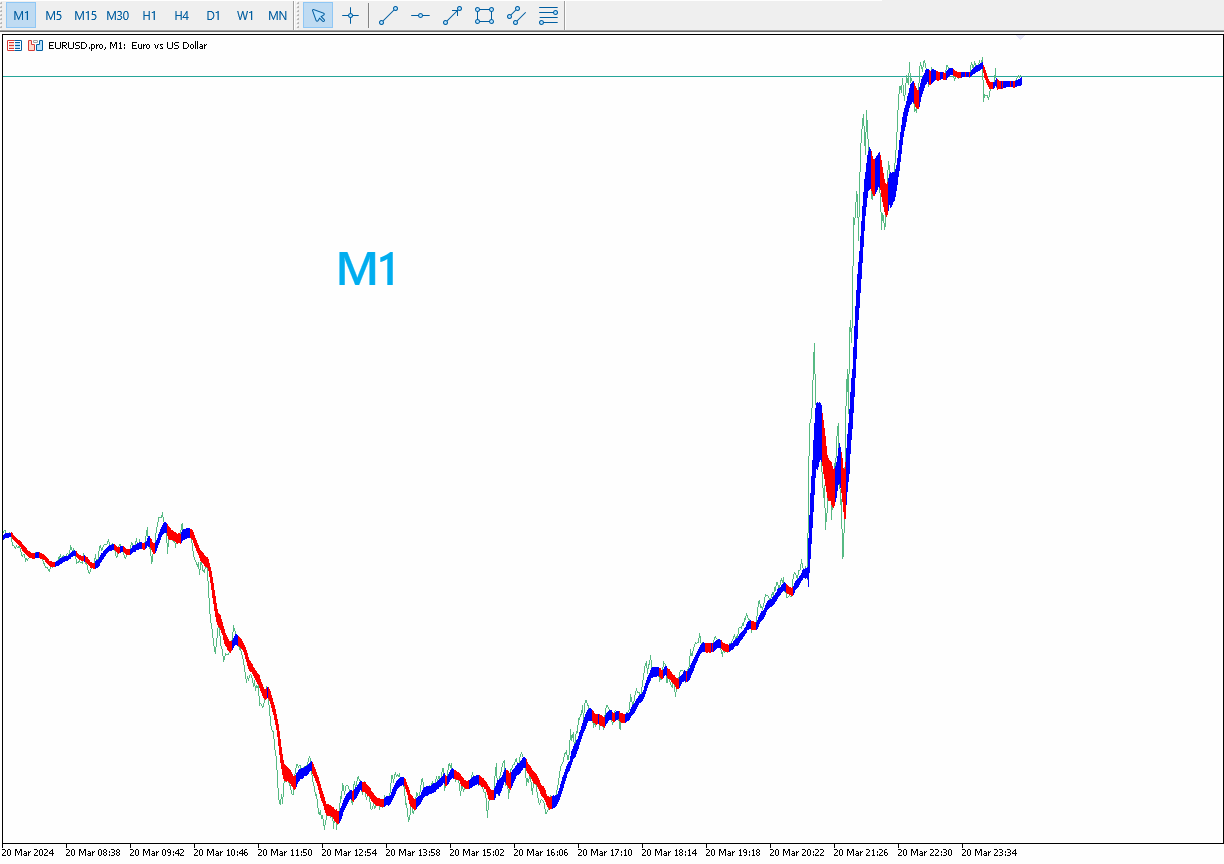
El **Heiken Ashi Smoothed** es una versión suavizada del indicador técnico Heiken Ashi, que se utiliza en el análisis de gráficos de velas para identificar tendencias del mercado y pronosticar movimientos de precios. Este indicador se basa en el promedio de datos de precios para formar un gráfico de velas que ayuda a los traders a filtrar el ruido del mercado.

**¿Para qué sirve?**
Este indicador se utiliza para identificar cuándo los traders deben permanecer en una operación y cuándo está por ocurrir una pausa o una reversión⁷. Además, puede ser utilizado para detectar la dirección de la tendencia a corto y largo plazo, identificar soportes y resistencias dinámicos, establecer stops de seguimiento y detectar reversiones de tendencia cuando el precio cruza por encima o por debajo de la vela Heiken Ashi.

**Ventajas**
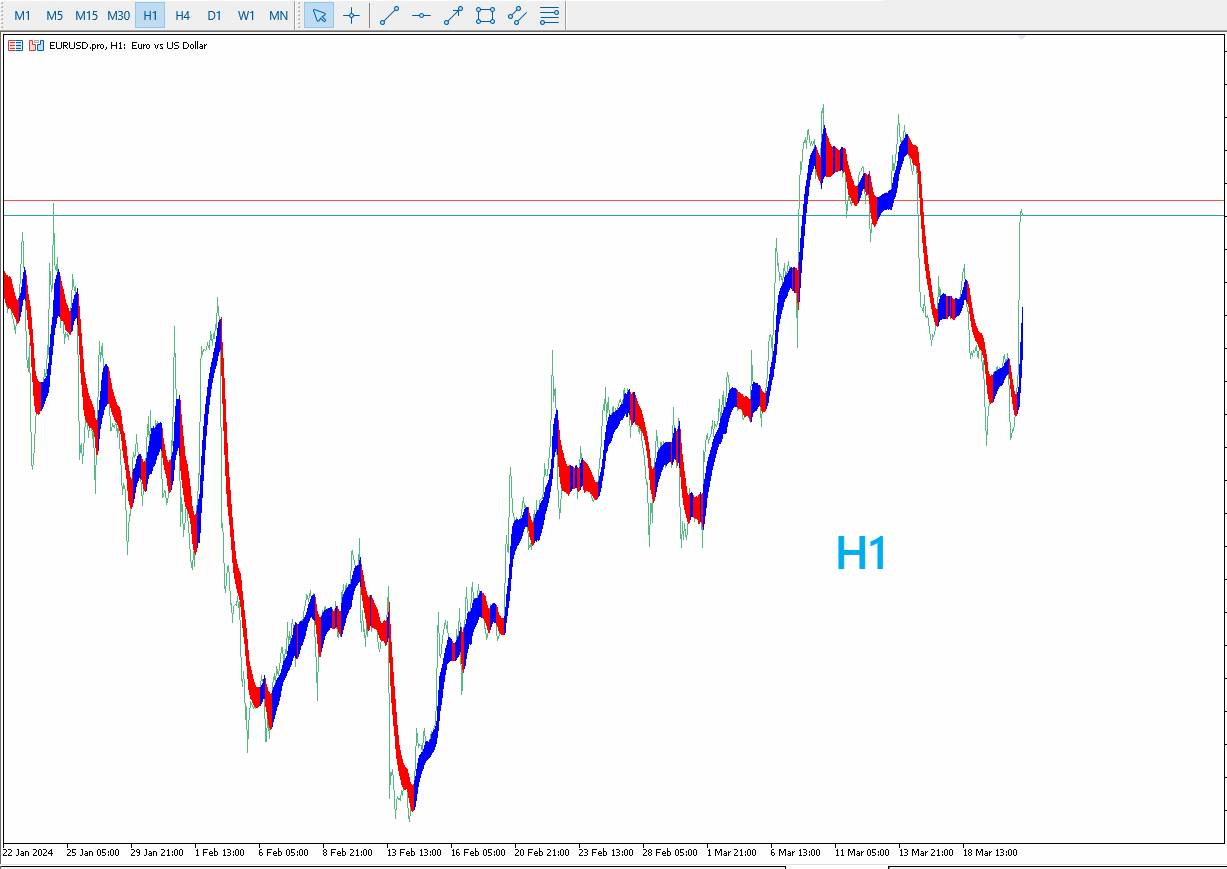
- Reduce el ruido del mercado, es decir, el efecto de aquellos datos anómalos que no van en línea con la tendencia principal.
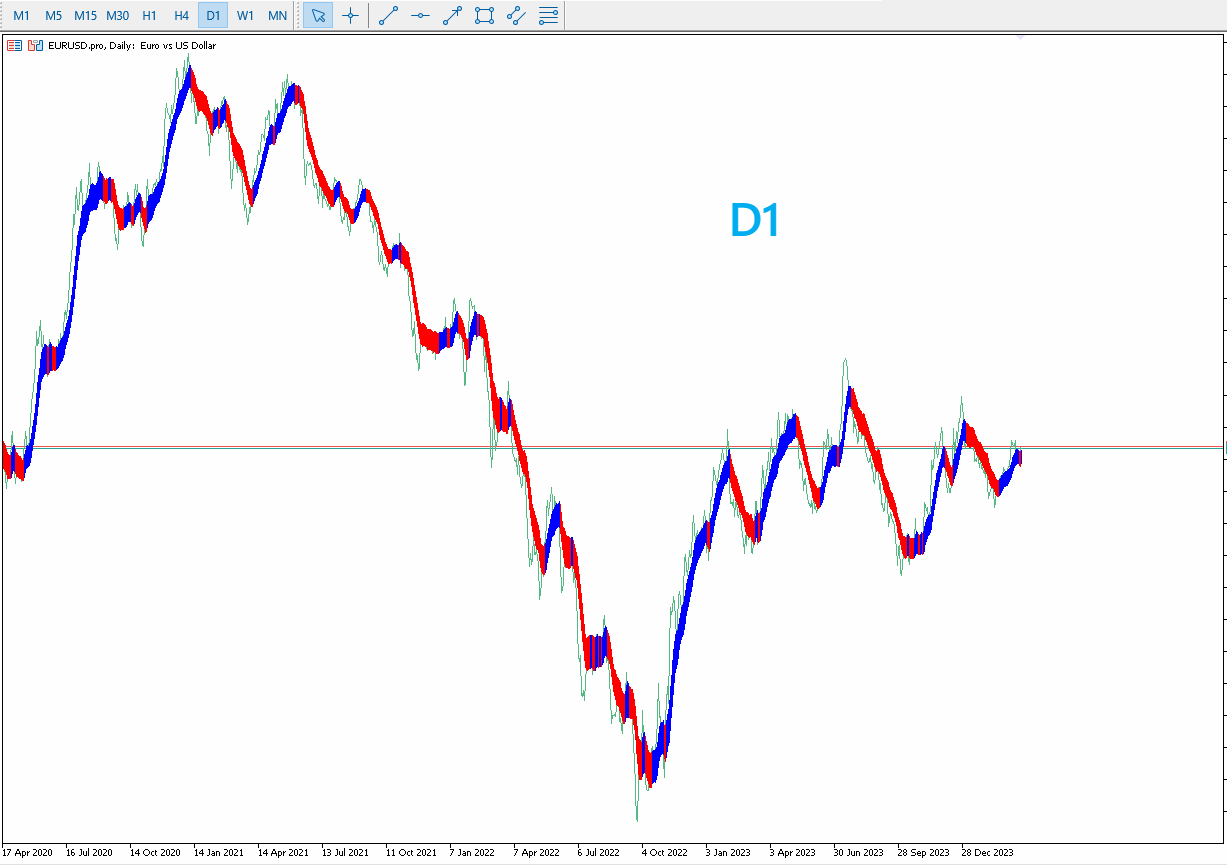
- Proporciona una mejor representación de la tendencia del mercado y de los posibles movimientos de precios.
- Genera gráficos más suaves con tendencias y reversiones más fáciles de detectar.
- Es accesible y puede ser utilizado por cualquier trader técnico, ya sean principiantes o más experimentados.

**Aspectos a considerar al operar**
- Aunque el Heiken Ashi Smoothed es útil para identificar tendencias, puede no mostrar los precios reales, lo que puede dificultar ciertos análisis, como la identificación de patrones de gráficos o niveles clave de soporte y resistencia.
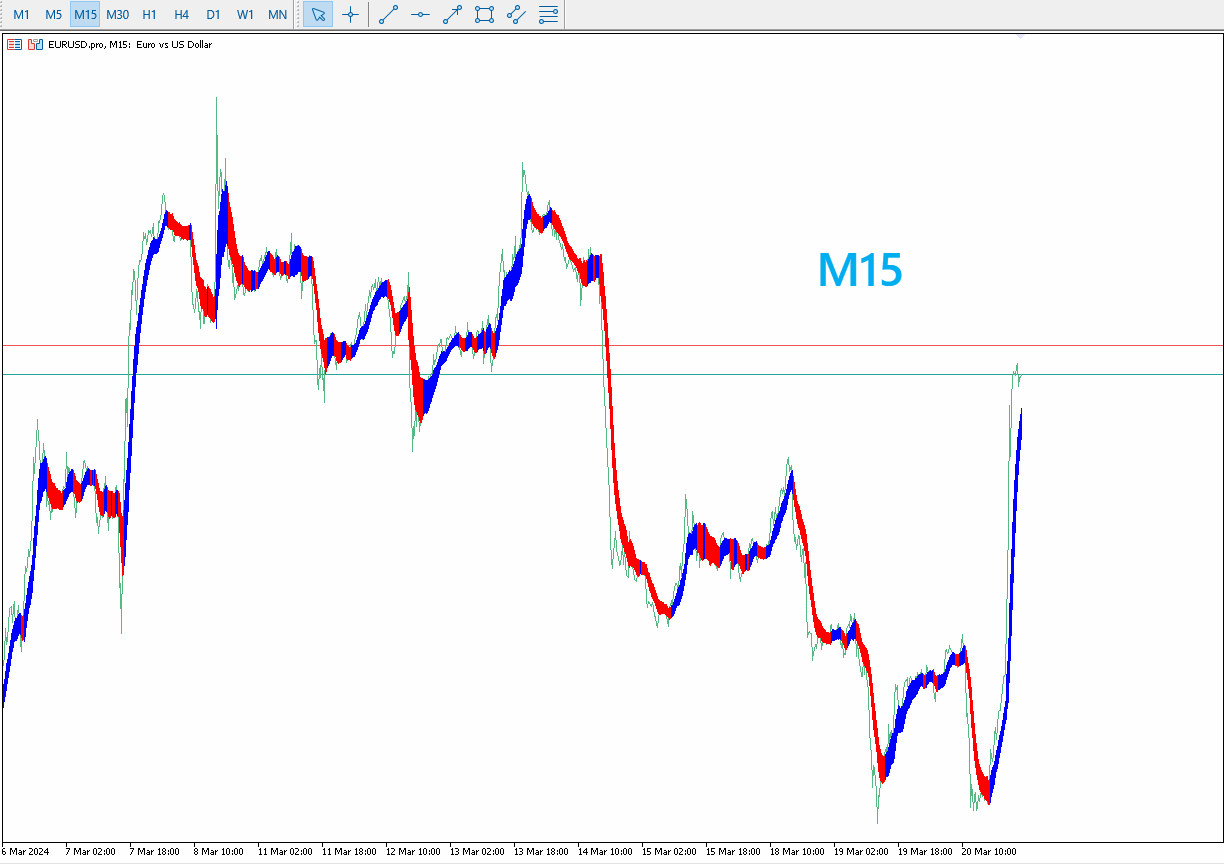
- En mercados laterales, puede dar señales erróneas y falsas.
- Para operar con la tendencia con el Heikin Ashi, se recomienda utilizar un trailing stop.
- La aparición de una vela alcista en una tendencia bajista, o viceversa, suele ser señal inequívoca de un claro agotamiento de una tendencia en vigor.

Es importante recordar que, como con cualquier indicador técnico, el Heiken Ashi Smoothed debe utilizarse en conjunto con otras herramientas y técnicas de análisis para aumentar la probabilidad de éxito en las operaciones.


Recommended products
Novato
Juan Manuel Rojas Perez
5 (1)
Descubre el poderoso aliado que te guiará en el laberinto de los mercados financieros. Este indicador revolucionario te llevará de la incertidumbre a la claridad, permitiéndote identificar con precisión los puntos de inflexión del mercado. Mejora tus decisiones de entrada y salida, optimiza tus operaciones y ¡multiplica tus ganancias con confianza. ¡Para más información, te invitamos a unirte a nuestro canal de Telegram en https://t.me/Profit_Evolution  ¡Allí encontrarás contenido exclusivo, an
FREE
Novato alertas
Juan Manuel Rojas Perez
4.75 (4)
Descubre el poderoso aliado que te guiará en el laberinto de los mercados financieros. Este indicador revolucionario te llevará de la incertidumbre a la claridad, permitiéndote identificar con precisión los puntos de inflexión del mercado. Mejora tus decisiones de entrada y salida, optimiza tus operaciones y ¡multiplica tus ganancias con confianza. Ahora con alertas en tu pc o móvil ¡Para más información, te invitamos a unirte a nuestro canal de Telegram en   https://t.me/Profit_Evolution  ¡Al
FREE
PreCogniTrade
Juan Manuel Rojas Perez
PreCogniTrade : Un Indicador Técnico Avanzado para Predecir el Mercado (Fase Beta) El  PreCogniTrade  es un indicador técnico revolucionario diseñado para los traders que buscan una ventaja competitiva en los mercados financieros. Este indicador no solo analiza las tendencias actuales, sino que también predice los movimientos futuros de los precios con una precisión asombrosa, lo que lo convierte en una herramienta de incalculable valor para cualquier estrategia de trading. Características Pri
FREE
Midas VWAP
Paulo Henrique Faquineli Garcia
4 (1)
Volume Weighted Average Price (VWAP) is a trading benchmark commonly used by Big Players that gives the average price a Symbol has traded throughout the day. It is based on both Volume and price. This indicator contains Daily VWAP and MIDAS' VWAP, which means you are able to anchor the beggining of MIDAS' calculations and, therefore you will be able to use this methodology to study price versus volume moves after anchor point. You will be able to anchor up to 3 HIGH MIDAS VWAP's and 3 LOW. Wish
FREE
Non Lag Ma
Juan Manuel Rojas Perez
El indicador técnico Non Lag MA (Non-Lagged Moving Average) es una variante de la media móvil que busca reducir el retraso inherente a las medias móviles tradicionales. Pros: - Menos retraso: Al estar diseñado para reducir el retraso, el Non Lag MA puede proporcionar señales más rápidas que las medias móviles tradicionales. - Tendencias claras: Las líneas del Non Lag MA muestran claramente las tendencias alcistas y bajistas, lo que facilita la interpretación de la dirección del mercado. - Pers
FREE
Velas MTF
Juan Manuel Rojas Perez
5 (1)
Velas Multi Time Frame Las velas multi time frame, también conocidas como "MTF candles" en inglés, son un indicador técnico que permite visualizar velas japonesas de un marco temporal diferente al marco temporal principal en el que estás operando. Este enfoque ofrece una perspectiva más amplia del comportamiento del precio, lo que resulta especialmente útil para los traders que emplean estrategias de acción del precio. A continuación, se detallan los conceptos clave relacionados con este indic
FREE
Envolventes con alertas
Juan Manuel Rojas Perez
MT5 Enveloping Pattern Detector: Your competitive advantage in trading Are you looking for a tool to help you accurately identify the best trading opportunities in the forex market? Our Engulfing Pattern Detector provides you with a highly reliable buy or sell signal, based on one of the most recognized and effective Japanese candlestick patterns: the engulfing pattern. With an average success rate of 70%, this indicator will allow you to make safer and more profitable investment decisions. Don'
FREE
Cipher B Divergences
Alberto Gauer Borrego
5 (4)
Finally a Metatrader version of the very popular (and expensive) Market Cipher B indicator, or the Vumanchu Cipher B + Divergences very popular on Tradingview platform. This tool is very heavy on calculations, total are 31 plots using 97 buffers from several indicators. On my mid end computer, timeframes below M15 start getting a bit laggy, so it would require a powerful computer to run it properly at very low timeframes. It's still usable here, but somewhat sluggish response in Metatrader (lik
FREE
Stackable VWAP
Flavio Javier Jarabeck
3.5 (4)
Volume Weighted Average Price (VWAP) is a trading benchmark commonly used by Big Players that gives the average price a Symbol has traded throughout the day. It is based on both Volume and price. Additionally we put in this indicator the MVWAP (Moving Volume Weighted Average Price). For those who do not know the usage and the importance od this indicator I recommend a great article about this subject at Investopedia ( https://www.investopedia.com/articles/trading/11/trading-with-vwap-mvwap.asp
FREE
CM Ema Trend Bars
Biswarup Banerjee
5 (1)
Indicator Name: CM EMA Trend Bars Overview: The CM EMA Trend Bars indicator is a straightforward yet effective tool that changes the color of price bars based on their relationship to the Exponential Moving Average (EMA). This visual cue helps traders quickly identify trend direction and potential trading opportunities. Key Features: Dynamic Bar Coloring: The indicator changes the color of the bars depending on whether they are above or below the EMA, providing a clear visual representation of t
FREE
Wave Box Market Frenquency
Jean Jacques Huve Ribeiro
4.75 (4)
Totally linked to the result of a movement and the duration he had. Its height records how many ticks the asset walked during a given movement, its width shows us the duration that movement had. Its configuration must be in line with the Weis Wave Indicator configuration to observe the movement force and can indicate a possible accumulation or distribution of the movement;
FREE
Non Lag Ma MTF
Juan Manuel Rojas Perez
Versión Beta El indicador técnico Non Lag MA MTF (Non-Lagged Moving Average Multi-Time Frame) es una versión avanzada del Non Lag MA que permite visualizar la media móvil en varios marcos temporales simultáneamente.   Pros: - Visión integral: Proporciona una visión más completa al mostrar la media móvil en diferentes marcos temporales en un solo gráfico. - Anticipación de tendencias: Ayuda a anticipar cambios de tendencia al observar la convergencia o divergencia de las medias móviles en distint
FREE
A ideia do indicador é mudar de cores assim que o candle viole a banda; Caso o candle viole a banda superior, pinta o candle de vermelho, Caso o candle viole a banda inferior , pinta o candle de verde, Se o candle passar em algum momento pela média, ele assume uma cor acinzentada; Os candles que não passem pela média, nem violem a banda, apresentarão cor verde fraca, se for de alta e cor vermelha fraca se for de baixa. Projeto concebido no canal Aprenda a programar, keltner cores.
FREE
VWAP and MVWAP
Flavio Javier Jarabeck
4.17 (6)
Volume Weighted Average Price (VWAP) is a trading benchmark commonly used by Big Players that gives the average price a Symbol has traded throughout the day. It is based on both Volume and price. Additionally we put in this indicator the MVWAP (Moving Volume Weighted Average Price). For those who do not know the usage and the importance od this indicator I recommend a great article about this subject at Investopedia ( https://www.investopedia.com/articles/trading/11/trading-with-vwap-mvwap.asp )
FREE
MIDAS Super VWAP
Flavio Javier Jarabeck
4.44 (9)
Imagine VWAP, MVWAP and MIDAS in one place... Well, you found it! Now you can track the movement of Big Players in various ways, as they in general pursue the benchmarks related to this measuring, gauging if they had good execution or poor execution on their orders. Traders and analysts use the VWAP to eliminate the noise that occurs throughout the day, so they can measure what prices buyers and sellers are really trading. VWAP gives traders insight into how a stock trades for that day and deter
FREE
Value Chart Candlesticks
Flavio Javier Jarabeck
4.73 (11)
The idea of a Value Chart indicator was presented in the very good book I read back in 2020 , " Dynamic Trading Indicators: Winning with Value Charts and Price Action Profile ", from the authors Mark Helweg and David Stendahl. The idea is simple and the result is pure genius: Present candlestick Price analysis in a detrended way! HOW TO READ THIS INDICATOR Look for Overbought and Oversold levels. Of course, you will need to test the settings a lot to find the "correct" one for your approach. It
FREE
Here I present you this awesome indicator I made. This is a nique combination witch puts you in the same level as MM's. So you can surf a lot of waves and identify the rally time, breakouts, and the perfect time to get in the market. ---- The SSL Channel is a great all-rounder based on 2 Simple Moving Averages, one of recent Highs, one of recent Lows. The calculation prints a   channel   on the chart consisting of 2 lines. This strategy gives a Long signal when price closes above the top of thes
Time Spaced Moving Averages
Flavio Javier Jarabeck
5 (3)
The concept is simple: Plotting Price behavior within several periods of time. Some Symbols behave very well during the trading day - with this I mean Intraday trading - and this behavior ends up plotting effectively well with the proposed Exponential Moving Averages in this indicator... Obviously that this behavior could not be seen in all Symbols, but you can give it a try... Just drop this indicator in a chart and you will see for yourself... This indicator is intended for "Feeling the Trend"
FREE
Bollinger Bands B
Flavio Javier Jarabeck
4.5 (2)
John Bollinger created this indicator in 2010 as a way to read the original indicator (Bollinger Bands) in a more "technical" way, shown as an oscillator. The typical range of the Bollinger Bands %B is 0 - 0.5 - 1.0, where "0" represents the lower band, the "0.5" the middle band, and "1" the upper band. The line on the indicator represents the Closing prices. As simple as that. SETTINGS Bollinger Bands period of analysis Standard Deviation multiplier Shift Price type to be analyzed If you like
FREE
Functional in the Forex market. Functional in the B3 market - Bolsa Brasil Balcão. Motivation The technical Fibonacci retraction indicator for many is essential and the basis for all market movement forecasts. The name of the tool comes from the Italian mathematician Leonardo de Pisa (13th century). This DEMO version will work in Meta Trader with Demo and Strategy Tester. To purchase the Full version that works on a Real account, click on: https://www.mql5.com/en/market/product/38089 Opera
FREE
The 3 Bar Break
Stephen Reynolds
Three Bar Break is based on one of Linda Bradford Raschke's trading methods that I have noticed is good at spotting potential future price volatility. It looks for when the 1st bar's High is less than the 3rd bar's High as well as the 1st bar's Low to be higher than the 3rd bar's Low. This then predicts the market might breakout to new levels within 2-3 of the next coming bars. It should be used mainly on the daily chart to help spot potential moves in the coming days. Features : A simple meth
FREE
Stop Guardian
Antonio Simon Del Vecchio
5 (1)
Introducing Stop Guardian: Elevating Your Risk Management with Trailing Stop and Profit Closure. Stop Guardian is an Expert Advisor (EA) designed to optimize risk management in your trading strategies, combining trailing stop and an automatic position closure system based on profits. Key Features Automated Risk Management : Automatically adjusts open positions using trailing stop to protect profits and minimize losses. Customizable Settings : Allows you to adjust trailing stop parameters (Tra
FREE
Rejection Zones
Paulo Henrique Faquineli Garcia
Este poderoso indicador analisa o gráfico e mostra zonas de Rejeição de Preços! Isto é, locais onde o preço foi, mas não foi aceito pelo mercado! A visualização desta zona de Rejeição, facilita o entendimento do trader na tomada de decisões de onde operar e como operar! O indicador é composto por 4 linhas, sendo classificadas em 2 grupos: Linhas Vermelha e Amarela: Denotam os extremos onde o preço conseguiu chegar, mas não foi aceito! Linhas Laranja e Azul: A partir delas, denotam o Início da z
FREE
Economic Markers
Flavio Javier Jarabeck
4.79 (14)
Easily get all relevant economic events of the current day right into your chart, as markers. Filter what kind of markers do you want: by country (selected individually) and by Importance (High relevance, Medium, Low or any combination of these). Configure the visual cues to your liking. If there is more than one event set to the very same time, their Names will be stacked and you will see the messages merged with the plus (+) sign on the marker. Obviously that long or too much events on the sam
FREE
MultiSymbolsWpr Indice x IBOV
Israel Goncalves Moraes De Souza
O Indicador identifica relação do Índice com a soma dos principais ativos, funciona para qualquer mercado do mund o, possui um oscilador WPR com a soma dos principais ativos escolhidos, indicando a antecipação do movimento em relação ao Índice. Características WPR com a soma dos papéis escolhidos - branco WPR do papel atual - vermelho Canal de Tendência O indicador pode indicar movimento de entradas, sendo: cruzamento das linhas cruzamento da linha Multi Symbols no -50 cruzamento entre os canai
FREE
Easy Reward to Risk RRR Indicator for MT5 The Easy Reward to Risk RRR Indicator is a powerful trading assistant that streamlines technical analysis. It calculates and visualizes the risk-to-reward ratio in real time. This tool simplifies trading decisions by displaying two distinct areas on the chart a red zone for stop-loss levels and a green zone for take-profit levels . These zones help traders visualize potential losses and gains .   Easy Reward to Risk RRR Specification Table The followin
FREE
RSI back arrows
Smaylle Rafael Coelho Mariano
The   RSI Back Arrows   indicator is a powerful tool designed for traders who rely on the Relative Strength Index (RSI) to identify potential market reversals. This indicator specifically highlights when the RSI has exited the   oversold   or   overbought   zones, providing clear visual signals to inform trading decisions. Key Features: Visual Cues : The indicator marks arrows on the chart when the RSI crosses back into a neutral zone, making it easy to spot potential entry and exit points. Over
FREE
VWAP Level MT5
Francesco Lenza
5 (1)
The VWAP Level indicator is a technical analysis tool that calculates the weighted average price for the traded volumes of a specific asset. The VWAP provides traders and investors with the average price of an asset over a specific time frame. It is commonly used by investors to compare data on "passive" trading operations, such as pension funds and mutual funds, but also by traders who want to check if an asset has been bought or sold at a good market price. To calculate the VWAP level we us
FREE
Indicador Maestro del Trader Características Principales: Spread del Mercado en Tiempo Real : Visualiza el diferencial entre el precio de compra y venta directamente en tu gráfico.  Cuenta Regresiva del Cierre de Vela : No más sorpresas al final de la vela. El indicador muestra un cronómetro que te informa cuánto tiempo queda antes de que se cierre la vela actual. ¡Actúa con precisión en los momentos cruciales! Ganancias o Pérdidas en Tiempo Real : ¿Estás en verde o en rojo? El Indicador Maest
FREE
Spike Catch Pro
Amani Fungo
4 (6)
Spike Catch Pro 22:03 release updates Advanced engine for searching trade entries in all Boom and Crash pairs (300,500 and 1000) Programmed strategies improvements Mx_Spikes (to combine Mxd,Mxc and Mxe), Tx_Spikes,   RegularSpikes,   Litho_System,   Dx_System,   Md_System,   MaCross,   Omx_Entry(OP),  Atx1_Spikes(OP),   Oxc_Retracement (AT),M_PullBack(AT) we have added an arrow on strategy identification, this will help also in the visual manual backtesting of the included strategies and see ho
FREE
Buyers of this product also purchase
Trend Screener Pro MT5
STE S.S.COMPANY
4.89 (74)
Unlock the Power of Trends Trading with the Trend Screener Indicator: Your Ultimate Trend Trading Solution powered by Fuzzy Logic and Multi-Currencies System! Elevate your trading game with the Trend Screener, the revolutionary trend indicator designed to transform your Metatrader into a powerful Trend Analyzer. This comprehensive tool leverages fuzzy logic and integrates over 13 premium features and three trading strategies, offering unmatched precision and versatility. LIMITED TIME OFFER : Tre
Golden Trend Indicator MT5
Noha Mohamed Fathy Younes Badr
4.88 (16)
Golden Trend indicator  is The best indicator for predicting trend movement this indicator never lags and never repaints and never back paints    and give  arrow buy and sell    before the candle appear  and it will help you and  will make your trading decisions clearer its work on all currencies and  gold and crypto and all time frame This unique  indicator uses very secret algorithms to catch the  trends, so you can trade using this indicator and see the trend clear on charts  manual guide and
FX Levels MT5
Daniel Stein
5 (3)
FX Levels: Exceptionally Accurate Support & Resistance for All Markets Quick Overview Looking for a reliable way to pinpoint support and resistance levels across any market—currencies, indices, stocks, or commodities? FX Levels merges our traditional “Lighthouse” method with a forward-thinking dynamic approach, offering near-universal accuracy. By drawing from real-world broker experience and automated daily plus real-time updates, FX Levels helps you identify reversal points, set profit targe
IX Power MT5
Daniel Stein
4.83 (6)
IX Power: Unlock Market Insights for Indices, Commodities, Cryptos, and Forex Overview IX Power is a versatile tool designed to analyze the strength of indices, commodities, cryptocurrencies, and forex symbols. While FX Power offers the highest precision for forex pairs by leveraging all available currency pair data, IX Power focuses exclusively on the underlying symbol’s market data. This makes IX Power an excellent choice for non-forex markets and a reliable option for forex charts when deta
FX Volume MT5
Daniel Stein
4.82 (17)
FX Volume: Experience Genuine Market Sentiment from a Broker’s Perspective Quick Overview Looking to elevate your trading approach? FX Volume provides real-time insights into how retail traders and brokers are positioned—long before delayed reports like the COT. Whether you’re aiming for consistent gains or simply want a deeper edge in the markets, FX Volume helps you spot major imbalances, confirm breakouts, and refine your risk management. Get started now and see how genuine volume data can
FX Power MT5 NG
Daniel Stein
5 (11)
FX Power: Analyze Currency Strength for Smarter Trading Decisions Overview FX Power is your go-to tool for understanding the real strength of currencies and Gold in any market condition. By identifying strong currencies to buy and weak ones to sell, FX Power simplifies trading decisions and uncovers high-probability opportunities. Whether you’re looking to follow trends or anticipate reversals using extreme delta values, this tool adapts seamlessly to your trading style. Don’t just trade—trade
CBT Quantum Maverick High-Efficiency Binary Trading System CBT Quantum Maverick is a finely tuned, high-performance binary options trading system designed for traders seeking precision, simplicity, and disciplined trading. No customization is required—this system is optimized for effective results right out of the box. Simply follow the signals, which can be mastered with a bit of practice. Key Features: Signal Precision: New-bar-based trading signals—targeting the next candle based on curren
TPSproTREND PrO MT5
Roman Podpora
4.69 (16)
TPSpro TREND PRO  - is a trend indicator that automatically analyzes the market and provides information about the trend and each of its changes, as well as giving signals for entering trades without redrawing! The indicator uses each candle, analyzing them separately. referring to different impulses - up or down impulse. Exact entry points into transactions for currencies, crypto, metals, stocks, indices!  ИНСТРУКЦИЯ RUS         INSTRUCTIONS  ENG       R ecommended to use with an indicator   -
FX Dynamic: Track Volatility and Trends with Customized ATR Analysis Overview FX Dynamic is a powerful tool that leverages Average True Range (ATR) calculations to give traders unparalleled insights into daily and intraday volatility. By setting up clear volatility thresholds—such as 80%, 100%, and 130%—you can quickly identify potential profit opportunities or warnings when markets exceed typical ranges. FX Dynamic adapts to your broker’s time zone, helps you maintain a consistent measure of
Top indicator for MT5   providing accurate signals to enter a trade without repainting! It can be applied to any financial assets:   forex, cryptocurrencies, metals, stocks, indices .  Watch  the video  (6:22) with an example of processing only one signal that paid off the indicator! MT4 version is here It will provide pretty accurate trading signals and tell you when it's best to open a trade and close it. Most traders improve their trading results during the first trading week with the help of
This dashboard shows the latest available   harmonic patterns   for the selected symbols, so you will save time and be more efficient /   MT4 version . Free Indicator:   Basic Harmonic Pattern Comparison of "Basic Harmonic Pattern" vs. "Basic Harmonic Patterns Dashboard" Indicators Feature Basic Harmonic Pattern Basic Harmonic Patterns Dashboard Functionality Detects and displays harmonic patterns on a single chart Searches multiple symbols and timeframes for harmonic patterns, displays res
Matrix Arrow Indicator MT5
Juvenille Emperor Limited
5 (13)
Matrix Arrow Indicator MT5  is a unique 10 in 1 trend following   100% non-repainting  multi-timeframe indicator that can be used on all symbols/instruments:   forex,   commodities,   cryptocurrencies,   indices,   stocks .  Matrix Arrow Indicator MT5  will determine the current trend at its early stages, gathering information and data from up to 10 standard indicators, which are: Average Directional Movement Index (ADX) Commodity Channel Index (CCI) Classic Heiken Ashi candles Moving Average
Gartley Hunter Multi
Siarhei Vashchylka
5 (9)
Gartley Hunter Multi - An indicator for searching for harmonic patterns simultaneously on dozens of trading instruments and on all possible timeframes. Manual (Be sure to read before purchasing) | Version for MT4 Advantages 1. Patterns: Gartley, Butterfly, Shark, Crab. Bat, Alternate Bat, Deep Crab, Cypher 2. Simultaneous search for patterns on dozens of trading instruments and on all possible timeframes 3. Search for patterns of all possible sizes. From the smallest to the largest 4. All fou
Gold Stuff mt5
Vasiliy Strukov
4.92 (173)
Gold Stuff mt5 is a trend indicator designed specifically for gold and can also be used on any financial instrument. The indicator does not redraw and does not lag. Recommended time frame H1. Contact me immediately after the purchase to get   personal bonus!  You can get a free copy of our Strong Support and Trend Scanner indicator, please pm. me! Settings  and manual   here  Please note that I do not sell my EA's or special sets on telegram, it is only available on Mql5 and my set files are on
TPSpro RFI Levels MT5
Roman Podpora
4.53 (19)
A key element in trading is zones or levels from which decisions to buy or sell a trading instrument are made. Despite attempts by major players to conceal their presence in the market, they inevitably leave traces. Our task was to learn how to identify these traces and interpret them correctly. ИНСТРУКЦИЯ RUS         INSTRUCTIONS  ENG         R ecommended to use with an indicator   -   TPSpro  TREND PRO -  Version MT4 Bonus: 6 months of  "RFI SIGNALS"  subscription with your purchase! Main
First of all Its worth emphasizing here that this Trading Tool is Non Repainting , Non Redrawing and Non Lagging Indicator , Which makes it ideal for professional trading . Online course, user manual and demo. The Smart Price Action Concepts Indicator is a very powerful tool for both new and experienced traders . It packs more than 20 useful indicators into one , combining advanced trading ideas like Inner Circle Trader Analysis and Smart Money Concepts Trading Strategies . This indicator focus
Atomic Analyst MT5
Issam Kassas
4.32 (19)
First of all Its worth emphasizing here that this Trading Indicator is   Non-Repainting   , Non Redrawing and Non Lagging Indicator   Indicator, Which makes it ideal from both manual and robot trading.  User manual: settings, inputs and strategy . The Atomic Analyst  is a PA Price Action Indicator that uses Strength and Momentum of the price to find a better edge in the market. Equipped with Advanced filters which help remove noises and false signals, and Increase Trading Potential. Using Multi
Bill Williams Advanced
Siarhei Vashchylka
5 (9)
Bill Williams Advanced is designed for automatic chart analysis using Bill Williams' "Profitunity" system. The indicator analyzes four timeframes at once. Manual (Be sure to read before purchasing) Advantages 1. Automatically analyzes the chart using the "Profitunity" system of Bill Williams. The found signals are placed in a table in the corner of the screen. 2. Equipped with a trend filter based on the Alligator indicator. Most of the system signals are recommended to be used only according t
Support And Resistance Screener Breakthrough unique Solution With All Important levels analyzer and Markets Structures Feature Built Inside One Tool ! Our indicator has been developed by traders for traders and with one Indicator you will find all Imporant market levels with one click. LIMITED TIME OFFER : Support and Resistance Screener Indicator is available for only 50 $ and lifetime. ( Original price 125$ ) (offer extended) The available tools ( Features ) in our Indicator are :  1. HH-LL S
Quantum Trend Sniper
Bogdan Ion Puscasu
4.73 (51)
Introducing   Quantum Trend Sniper Indicator , the groundbreaking MQL5 Indicator that's transforming the way you identify and trade trend reversals! Developed by a team of experienced traders with trading experience of over 13 years,   Quantum Trend Sniper Indicator   is designed to propel your trading journey to new heights with its innovative way of identifying trend reversals with extremely high accuracy. ***Buy Quantum Trend Sniper Indicator and you could get Quantum Breakout Indicator for
RelicusRoad Pro MT5
Relicus LLC
4.78 (18)
How many times have you bought a trading indicator with great back-tests, live account performance proof with fantastic numbers and stats all over the place but after using it, you end up blowing your account? You shouldn't trust a signal by itself, you need to know why it appeared in the first place, and that's what RelicusRoad Pro does best! User Manual + Strategies + Training Videos + Private Group with VIP Access + Mobile Version Available A New Way To Look At The Market RelicusRoad is th
Quantum TrendPulse
Bogdan Ion Puscasu
5 (13)
Introducing Quantum TrendPulse , the ultimate trading tool that combines the power of SuperTrend , RSI , and Stochastic into one comprehensive indicator to maximize your trading potential. Designed for traders who seek precision and efficiency, this indicator helps you identify market trends, momentum shifts, and optimal entry and exit points with confidence. Key Features: SuperTrend Integration: Easily follow the prevailing market trend and ride the wave of profitability. RSI Precision: Detect
TW Trend Scalper Indicator: The TW Scalper Shoot brings you a unique trading experience by utilizing the latest trading strategies and artificial intelligence technology. This product meets the diverse needs of scalper traders by providing two distinct categories of signals: Test this exceptional product today and start your unique experience toward becoming a trend scalper. Additionally, Get a product worth   $37  as a gift. Signal Categories: 1. Long-term and Safe Signals: These signals ar
Gann Squares Indicator: Analyzing Markets with Geometric Patterns The Gann Squares indicator is a powerful tool for market analysis that draws upon the mathematical concepts introduced by W.D. Gann in his article on "Mathematical Formula for Market Predictions." This indicator incorporates Gann's techniques involving square numbers such as 144, 90, and 52, as well as the Square of 9. Additionally, it incorporates  method for utilizing the Square of 9 in conjunction with channels and the star pa
ICT, SMC, SMART MONEY CONCEPTS, SMART MONEY, Smart Money Concept, Support and Resistance, Trend Analysis, Price Action, Market Structure, Order Blocks, BOS/CHoCH,   Breaker Blocks ,  Momentum Shift,   Supply&Demand Zone/Order Blocks , Strong Imbalance, HH/LL/HL/LH,    Fair Value Gap, FVG, Invert FVG, IFVG,  Premium  &   Discount   Zones, Fibonacci Retracement, OTE, Buy Side Liquidity, Sell Side Liquidity, BSL/SSL Taken, Equal Highs & Lows, MTF Dashboard, Multiple Time Frame, Big Bar, HTF OB, HTF
BookMap HeatMap
Roberto Spadim
1 (2)
This Indicator creates a heatmap based on depth of market of the current symbol or another symbol. Other symbol is useful when you trade futures market and a contract has 'mini' and 'full' split. For example, in Brazil (B3 - BMF&Bovespa), WDO and DOL are future Forex contract of BRL/USD (where 1 DOL = 5 WDO) and big banks work mostly with DOL (where liquidity is important). Please use with M1 timeframe , objects are too small to be displayed at higher timeframes (MT5 limit). The number of level
Black Dragon indicator mt5
Ramil Minniakhmetov
4.83 (58)
The trend detection indicator will compliment any strategy and can also be used as an independent tool. Be careful i not sell EA or sets at telegram it scam. All settings free here at   blog .  IMPORTANT! Contact me immediately after the purchase to get instructions and a bonus!  Benefits  Easy to use; does not overload the graphic wih unnecessary information. The ability to use as filter for any strategy. Contains bult -in dynamic levels of cupport and resistange,  which can be used both, for p
Berma Bands
Muhammad Elbermawi
5 (3)
The Berma Bands (BBs) indicator is a valuable tool for traders seeking to identify and capitalize on market trends. By analyzing the relationship between the price and the BBs, traders can discern whether a market is in a trending or ranging phase. Visit the [ Berma Home Blog ] to know more. Berma Bands are composed of three distinct lines: the Upper Berma Band, the Middle Berma Band, and the Lower Berma Band. These lines are plotted around the price, creating a visual representation of the pric
Gold Trend 5
Sergei Linskii
3.5 (2)
Gold Trend - this is a good stock technical indicator. The indicator algorithm analyzes the price movement of an asset and reflects volatility and potential entry zones. The best indicator signals: For SELL = red histogram + red SHORT pointer + yellow signal arrow in the same direction. For BUY = blue histogram + blue LONG pointer + aqua signal arrow in the same direction. Benefits of the indicator: The indicator produces signals with high accuracy. A confirmed arrow signal can only be redrawn
Introducing   Quantum Breakout PRO , the groundbreaking MQL5 Indicator that's transforming the way you trade Breakout Zones! Developed by a team of experienced traders with trading experience of over 13 years,   Quantum Breakout PRO   is designed to propel your trading journey to new heights with its innovative and dynamic breakout zone strategy. Quantum Breakout Indicator will give you signal arrows on breakout zones with 5 profit target zones and stop loss suggestion based on the breakout b
More from author
SchaffTrendCycle
Juan Manuel Rojas Perez
5 (2)
Schaff Trend Cycle (STC)  "CON ALERTAS" El Indicador Schaff Trend Cycle (STC) es una herramienta técnica utilizada en el trading e inversión para identificar tendencias y generar señales de compra o venta. ¿Qué es el Schaff Trend Cycle? El STC fue desarrollado por Doug Schaff para mejorar las medias móviles incorporando análisis de ciclos. Su objetivo es identificar tendencias y cambios de tendencia midiendo la fuerza y velocidad de los cambios de precio. Es un oscilador que mide la velocidad
FREE
Velas MTF
Juan Manuel Rojas Perez
5 (1)
Velas Multi Time Frame Las velas multi time frame, también conocidas como "MTF candles" en inglés, son un indicador técnico que permite visualizar velas japonesas de un marco temporal diferente al marco temporal principal en el que estás operando. Este enfoque ofrece una perspectiva más amplia del comportamiento del precio, lo que resulta especialmente útil para los traders que emplean estrategias de acción del precio. A continuación, se detallan los conceptos clave relacionados con este indic
FREE
Tendencia Magica
Juan Manuel Rojas Perez
5 (2)
El indicador técnico Trend Magic es una herramienta de análisis de tendencias que combina el Índice de Canal de Mercancía (CCI) y el Rango Verdadero Medio (ATR) para identificar la dirección de la tendencia del mercado. Aquí tienes un resumen de sus pros y contras, así como las mejores condiciones del mercado para su uso: Pros: - Identificación clara de la tendencia: Cambia de color para indicar tendencias alcistas (azul) y bajistas (rojo), lo que facilita la visualización de la dirección del
FREE
Novato alertas
Juan Manuel Rojas Perez
4.75 (4)
Descubre el poderoso aliado que te guiará en el laberinto de los mercados financieros. Este indicador revolucionario te llevará de la incertidumbre a la claridad, permitiéndote identificar con precisión los puntos de inflexión del mercado. Mejora tus decisiones de entrada y salida, optimiza tus operaciones y ¡multiplica tus ganancias con confianza. Ahora con alertas en tu pc o móvil ¡Para más información, te invitamos a unirte a nuestro canal de Telegram en   https://t.me/Profit_Evolution  ¡Al
FREE
Novato
Juan Manuel Rojas Perez
5 (1)
Descubre el poderoso aliado que te guiará en el laberinto de los mercados financieros. Este indicador revolucionario te llevará de la incertidumbre a la claridad, permitiéndote identificar con precisión los puntos de inflexión del mercado. Mejora tus decisiones de entrada y salida, optimiza tus operaciones y ¡multiplica tus ganancias con confianza. ¡Para más información, te invitamos a unirte a nuestro canal de Telegram en https://t.me/Profit_Evolution  ¡Allí encontrarás contenido exclusivo, an
FREE
PreCogniTrade
Juan Manuel Rojas Perez
PreCogniTrade : Un Indicador Técnico Avanzado para Predecir el Mercado (Fase Beta) El  PreCogniTrade  es un indicador técnico revolucionario diseñado para los traders que buscan una ventaja competitiva en los mercados financieros. Este indicador no solo analiza las tendencias actuales, sino que también predice los movimientos futuros de los precios con una precisión asombrosa, lo que lo convierte en una herramienta de incalculable valor para cualquier estrategia de trading. Características Pri
FREE
Trend detection index TDI
Juan Manuel Rojas Perez
El Trend Detection Index (TDI) es un indicador técnico introducido por M. H. Pee. Se utiliza para detectar cuándo ha comenzado una tendencia y cuándo ha llegado a su fin. El TDI puede usarse como un indicador independiente o combinado con otros; se desempeñará bien en la detección del comienzo de las tendencias. Los indicadores de tendencia son esenciales para detectar las tendencias de los mercados financieros. Estos indicadores ayudan a determinar la dirección que probablemente siga el activ
FREE
Non Lag Ma MTF
Juan Manuel Rojas Perez
Versión Beta El indicador técnico Non Lag MA MTF (Non-Lagged Moving Average Multi-Time Frame) es una versión avanzada del Non Lag MA que permite visualizar la media móvil en varios marcos temporales simultáneamente.   Pros: - Visión integral: Proporciona una visión más completa al mostrar la media móvil en diferentes marcos temporales en un solo gráfico. - Anticipación de tendencias: Ayuda a anticipar cambios de tendencia al observar la convergencia o divergencia de las medias móviles en distint
FREE
Envolventes con alertas
Juan Manuel Rojas Perez
MT5 Enveloping Pattern Detector: Your competitive advantage in trading Are you looking for a tool to help you accurately identify the best trading opportunities in the forex market? Our Engulfing Pattern Detector provides you with a highly reliable buy or sell signal, based on one of the most recognized and effective Japanese candlestick patterns: the engulfing pattern. With an average success rate of 70%, this indicator will allow you to make safer and more profitable investment decisions. Don'
FREE
MAs Multi Tiempo
Juan Manuel Rojas Perez
5 (1)
El indicador técnico propuesto es un sistema de medias móviles de múltiples marcos temporales diseñado para ayudar a los operadores del mercado financiero a seguir de cerca los movimientos tendenciales. Al combinar medias móviles de diferentes períodos, este indicador ofrece una visión más completa de la dirección de la tendencia, lo que permite a los traders identificar oportunidades de trading con mayor precisión. Al utilizar este indicador, los operadores pueden maximizar sus ganancias al tom
FREE
Martillo con alertas
Juan Manuel Rojas Perez
MT5 Hammer Pattern Detector: Your guide to more profitable operations Tired of searching for the best trading opportunities? Our innovative indicator gives you a competitive advantage by automatically identifying hammer patterns on your charts. Known for its high probability of success, the hammer pattern has been a fundamental tool in the arsenal of experienced traders for decades. Our indicator, designed to accurately detect this key pattern, will allow you to: Identify trend reversals earl
FREE
Multi Oscilador
Juan Manuel Rojas Perez
Un indicador técnico de múltiples osciladores es una herramienta de análisis que combina varios osciladores para proporcionar una visión más completa de la dinámica del mercado. Los osciladores son fórmulas matemáticas que se calculan a partir de los datos de los precios y se representan gráficamente para ayudar a identificar la tendencia actual, el sentimiento del mercado y posibles puntos de giro. **¿Para qué sirve?** Este indicador sirve para identificar condiciones de sobrecompra y sobreve
FREE
El indicador técnico conocido como   Líneas de Tendencia Perfecta . Este indicador es una herramienta valiosa en el análisis técnico y se utiliza para mejorar la toma de decisiones en el trading. Aquí tienes una descripción paso a paso de cómo funciona y cómo puede ser utilizado por los traders: Identificación de Tendencias : Las líneas de tendencia perfecta se dibujan conectando dos o más puntos de precio en un gráfico, revelando así la dirección general del mercado. Una línea ascendente indica
FREE
La **Media Móvil de Tercera Generación (TGMMA)** es una versión avanzada del indicador estándar de **Media Móvil (MA)**. Fue descrita por primera vez por Manfred G. Dürschner en su artículo "Gleitende Durchschnitte 3.0" (en alemán). Aquí están las características clave de la TGMMA: 1. **Reducción del Retraso**:    - A diferencia de las MAs tradicionales, la TGMMA reduce significativamente el retraso. Se adapta más rápidamente a los cambios de precios, lo que la hace ideal para traders que busc
FREE
Non Lag Ma
Juan Manuel Rojas Perez
El indicador técnico Non Lag MA (Non-Lagged Moving Average) es una variante de la media móvil que busca reducir el retraso inherente a las medias móviles tradicionales. Pros: - Menos retraso: Al estar diseñado para reducir el retraso, el Non Lag MA puede proporcionar señales más rápidas que las medias móviles tradicionales. - Tendencias claras: Las líneas del Non Lag MA muestran claramente las tendencias alcistas y bajistas, lo que facilita la interpretación de la dirección del mercado. - Pers
FREE
Indicador Maestro del Trader Características Principales: Spread del Mercado en Tiempo Real : Visualiza el diferencial entre el precio de compra y venta directamente en tu gráfico.  Cuenta Regresiva del Cierre de Vela : No más sorpresas al final de la vela. El indicador muestra un cronómetro que te informa cuánto tiempo queda antes de que se cierre la vela actual. ¡Actúa con precisión en los momentos cruciales! Ganancias o Pérdidas en Tiempo Real : ¿Estás en verde o en rojo? El Indicador Maest
FREE
Filter:
No reviews
Reply to review