Dashboard MACD Stochastic
- Indicators
- Vladimir Karputov
- Version: 1.10
- Activations: 5
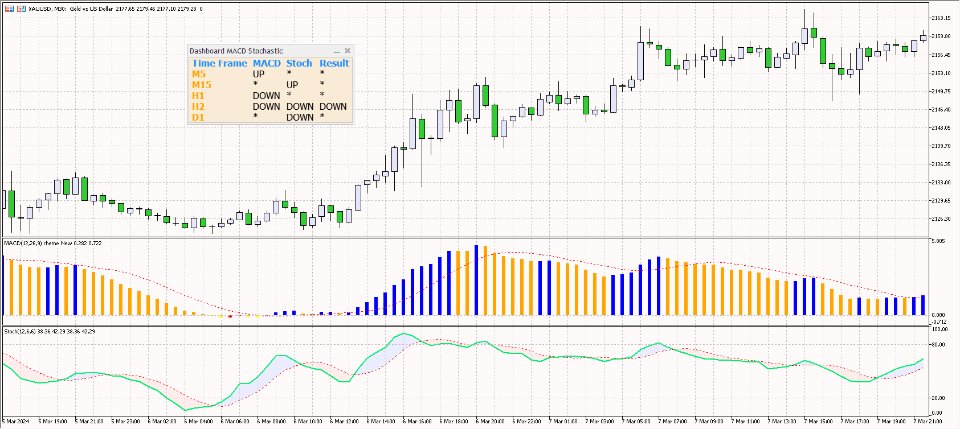
The dashboard scans the readings of two indicators: 'MACD' and 'Stochastic'. Displays signals in three columns: for MACD, for Stochastic, and the resulting column (if the signal is the same for both indicators).
Scanning can be selected on one or more timeframes. If you disable all timeframes, the dashboard will still load, but with settings specifically for such cases.
Signals are always checked for the zero bar (zero bar is the rightmost bar on the chart) of the indicator.
Description of parameters.
- "Timeframes" - select the timeframes on which the scan will be performed.
- "MACD" and "Stochastic" are parameters for indicators. The parameters of the indicators are the same for each timeframe.
- "Table" - sets the colors for the table: Table background, Table header color and Table first column color.
Description of signals.
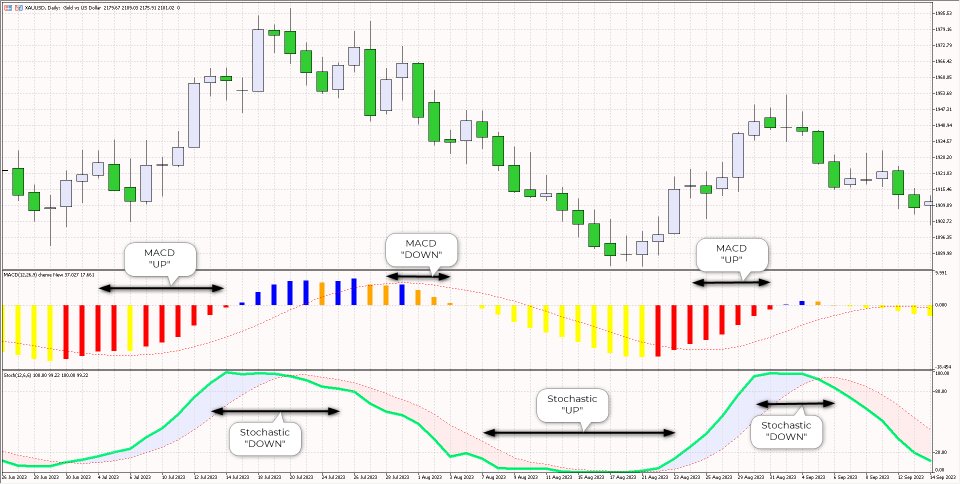
For the MACD, the UP signal is formed if both the Main line and the Signal line are below zero, and the Main line is above the Signal line. The "DOWN" signal is the opposite.
For 'Stochastic', the 'UP' signal is formed if the line is below '20', and the 'DOWN' signal is formed if the line is above '80'.
If the signal for both indicators is the same, then this signal will be displayed in the resulting column. If the signals are different, then there will be no resulting singal.

