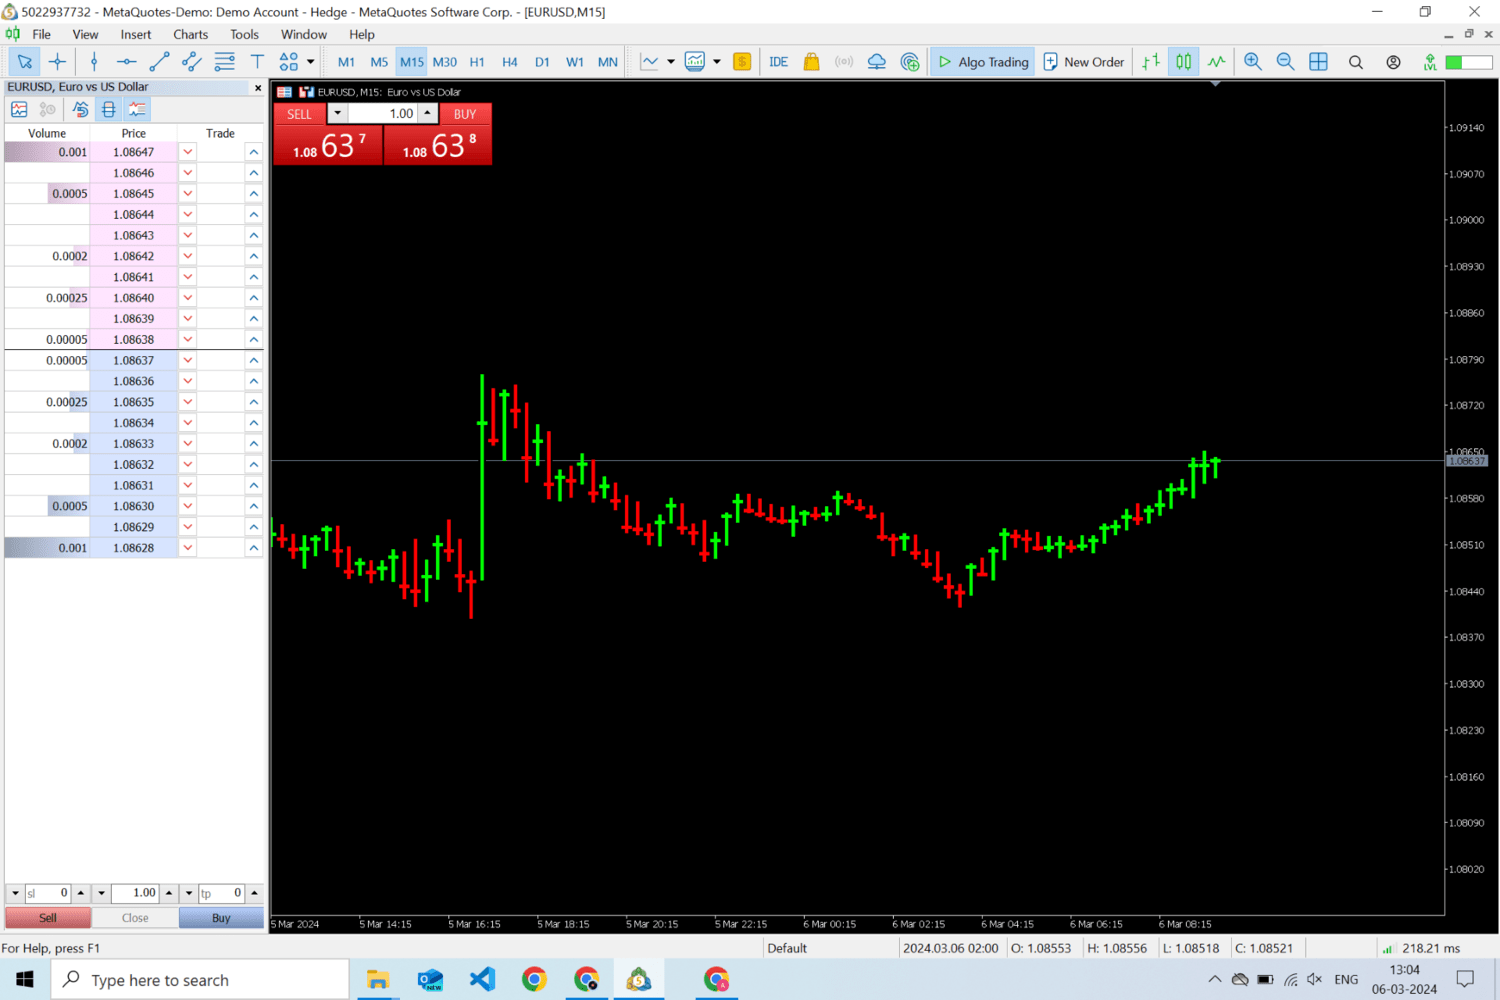
High Low Close chart with thick wicks
- Indicators
- Amin Alisher Shaikh
- Version: 1.0
- Activations: 5
Note - you have to hide your existing chart type, you can do that by changing colors of the chart, if you don't know how to do it, check this video - https://youtu.be/-4H6Z5Z4fKo
or contact me at priceaction9@outlook.com
This is a type of chart that will be shown in place of your chart, and it only shows the High, low and close, and it has thick wicks. It helps you to understand each candle better by reducing the noise introduced by open prices on each candle.
For example on the scale of 1 to 10 if candle opens at 5 and closes at 8, and makes low of 1 then it forms a body of 3 points and will have wicks for rest of the points, and hence sometimes it is difficult to make sense of it.
In this chart if same scenario happens, then closing point will shown at 8 and by looking at it you will get immediate idea, that it rallied from 1 to 8 in positive direction and from 10 to 8 in negative direction and hence you know it is a bullish candle.
If you have any questions let me know here priceaction9@outlook.com