Stochastic Divergence Level
- Indicators
- Vladimir Karputov
- Version: 1.15
- Updated: 7 March 2024
- Activations: 5
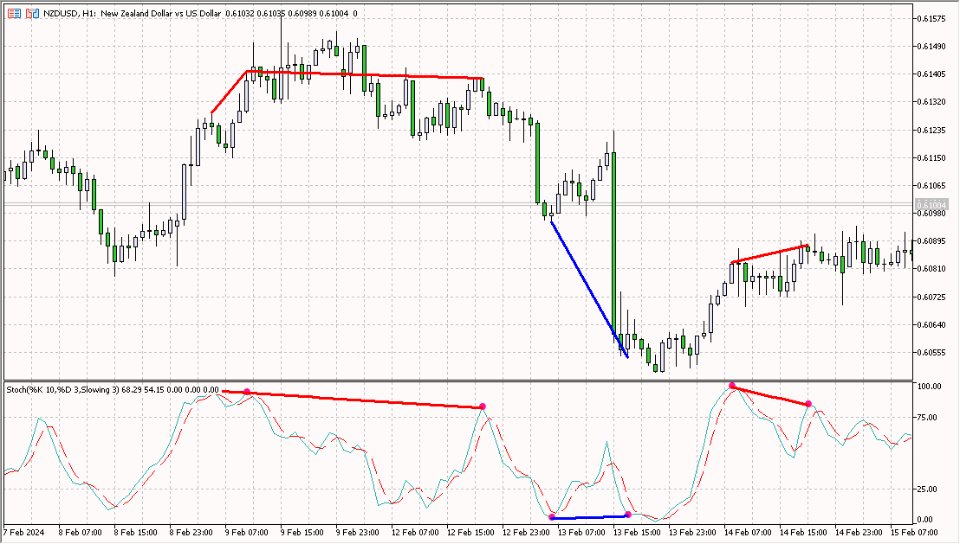
The indicator shows bullish and bearish divergence. The indicator itself (like regular stochastic) is displayed in a subwindow.
Graphical interface :
In the main window, graphical objects “trend line” are created - produced from the “Low” price to the “Low” price (for bullish divergence) and produced from the “High” price to the “High” price (for bearish divergence). The indicator draws in its window exclusively using graphic buffers: “Main”, “Signal”, “Dot”, “Buy” and “Sell”. The "Buy" and "Sell" buffers display divergence - since these are real indicator buffers, they can all be read from the EA.
The Dot buffer is used to visualize divergence points more clearly.
Options :
"Strict signals" - if you set this parameter to "true", then the bullish divergence will only be for the values "main" <= "Value Level #1" (default is '25'), and the bearish divergence will only be for the values "main" > = "Value Level #2" (default is '75').
1.15 "Max bars" now limits the number of bars for drawing - this also increased the speed of launching the indicator.










Simple and accurate - very good support from a knowledgeable developer.