Trend On Close
- Indicators
- David Ben Svaiter
- Version: 3.92
- Updated: 16 February 2024
- Activations: 5
TrendOnClose is a sophisticated indicator designed for Binary market investors, focusing on statistical analysis of trends and counter-trends within specific candle cycles.
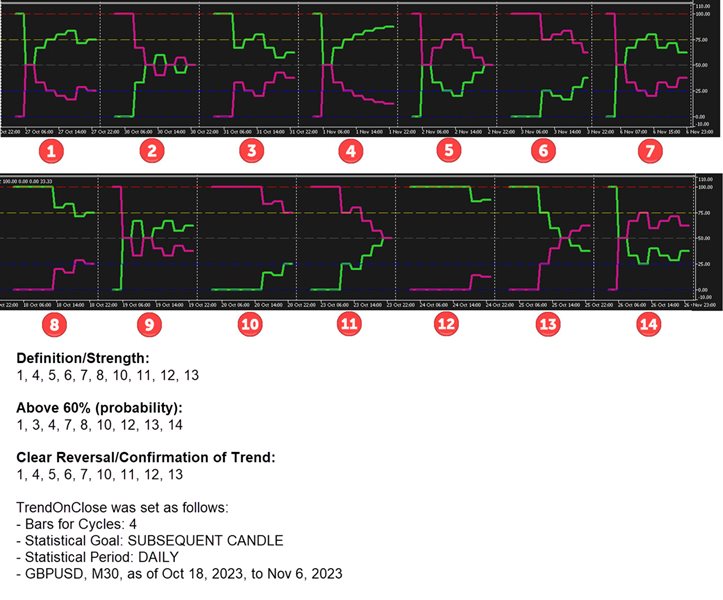
Each cycle is defined by the candle CLOSE price, establishing the trend direction (UP/DOWN - BULL/BEAR) for subsequent statistical analysis until the start of the next cycle. The statistical analysis operates with two configurations:
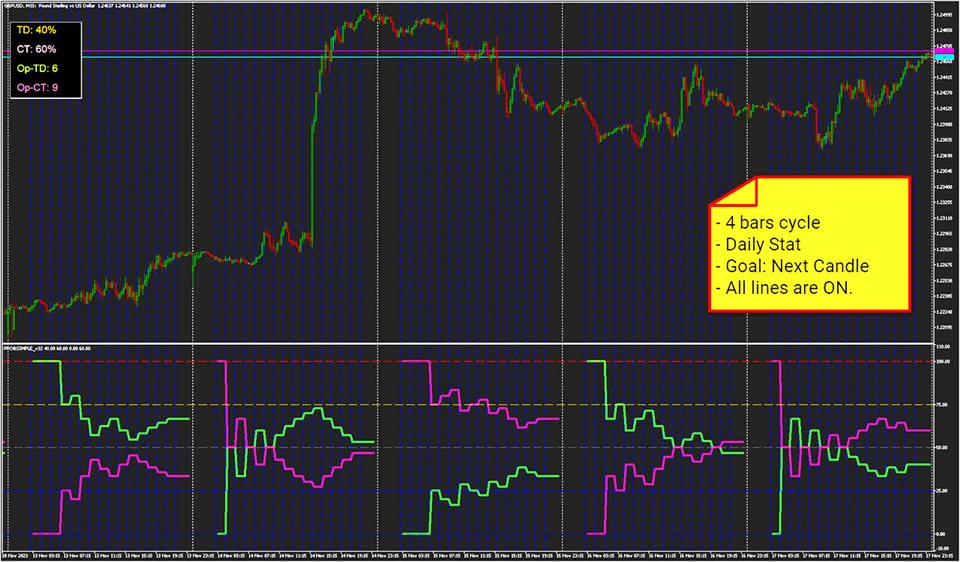
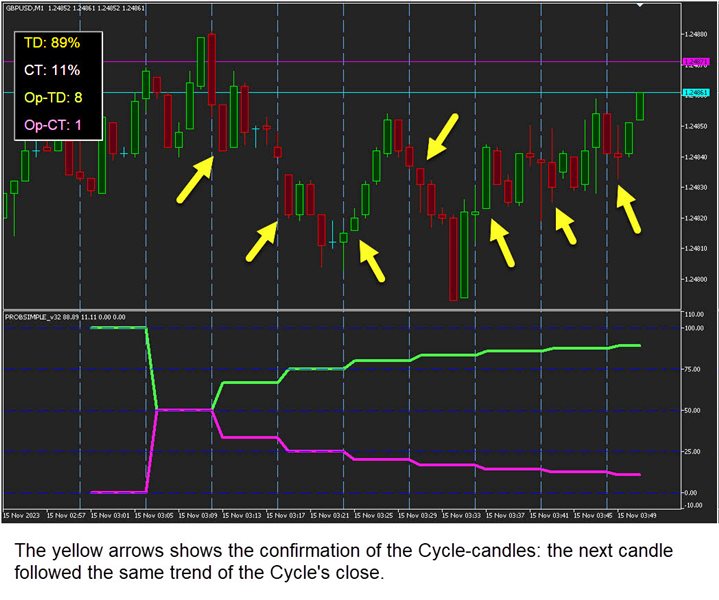
⦁ Statistical Goal as SUBSEQUENT CANDLE: The algorithm focuses on the subsequent candle within the cycle.
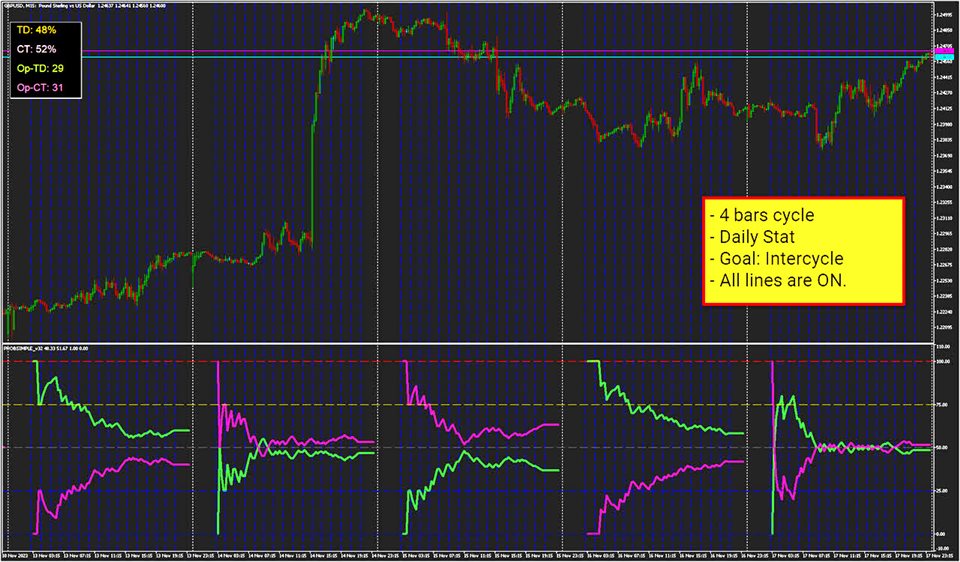
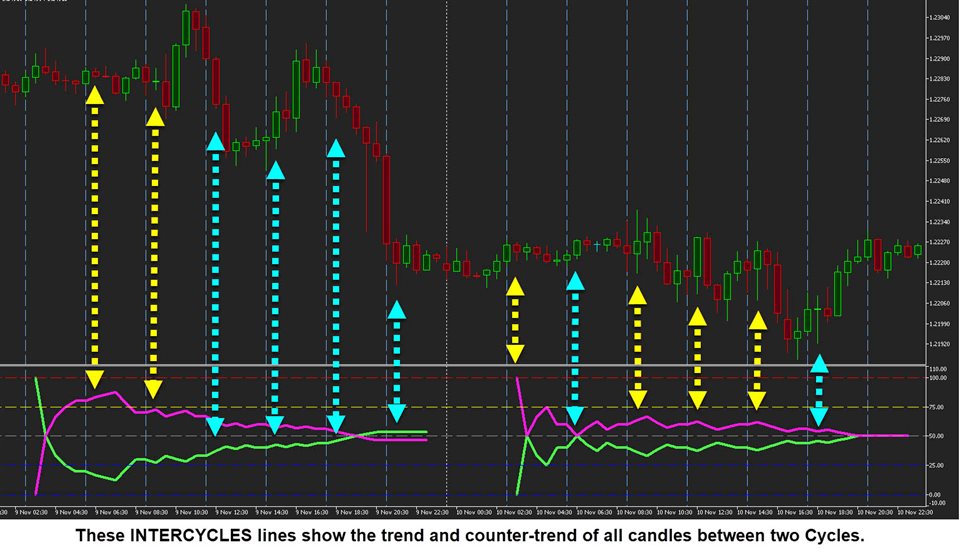
⦁ Statistical Goal as INTERCYCLES: The algorithm considers all candles between each cycle.
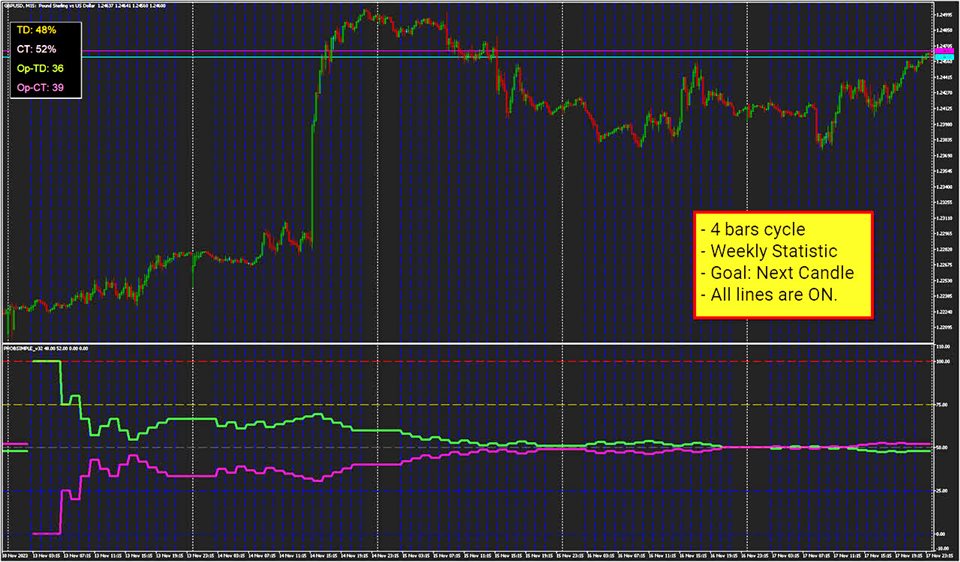
Based on the selected Statistical Goal, each candle's trend is compared to the trend of the CYCLE candle, resulting in an increase in TREND-Percent (TD) and Trend-Occurrences (N-TD) for identical directions, or in COUNTER-TREND (CT and N-CT) for diverging trends. Additionally, the indicator provides a statistical sum for Daily, Weekly, or Monthly periods, revealing the number of candles following the "trend" or "counter-trend" of each CYCLE during these periods. At the end of each predefined period, statistics reset for the subsequent cycle.
Features
⦁ No-Repaint Statistical Info: Optimize the analysis of trends and counter-trends in specific cycles/times, evaluating the probability of repetitions (and divergences) based on the CANDLE SUBSEQUENT TO THE CYCLE or INTERCYCLES CANDLES.
⦁ Intuitive: Displays the count and percentage of trends/counter-trends in both text and graphic modes. Additionally, it shows CYCLE lines and TREND/COUNTER-TREND lines that can be fully configured and even suppressed.
⦁ Easily and quickly configure START/END TIME, CYCLES, GOAL, and PERIODS. The START/END times work in a smart mode, adapting to the selected TIMEFRAME in case of incompatibility (e.g., even hours in odd TIMEFRAMES like M3, M15, etc).
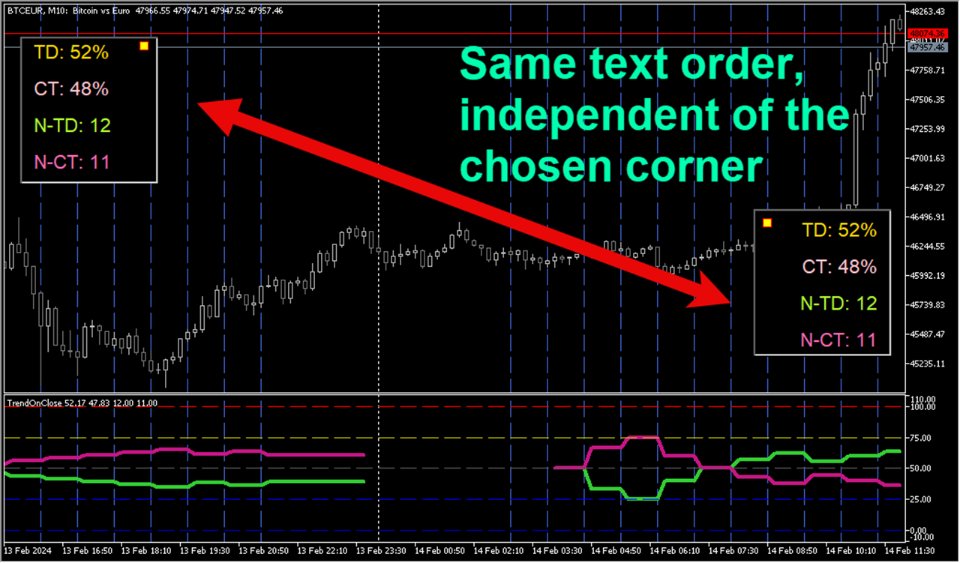
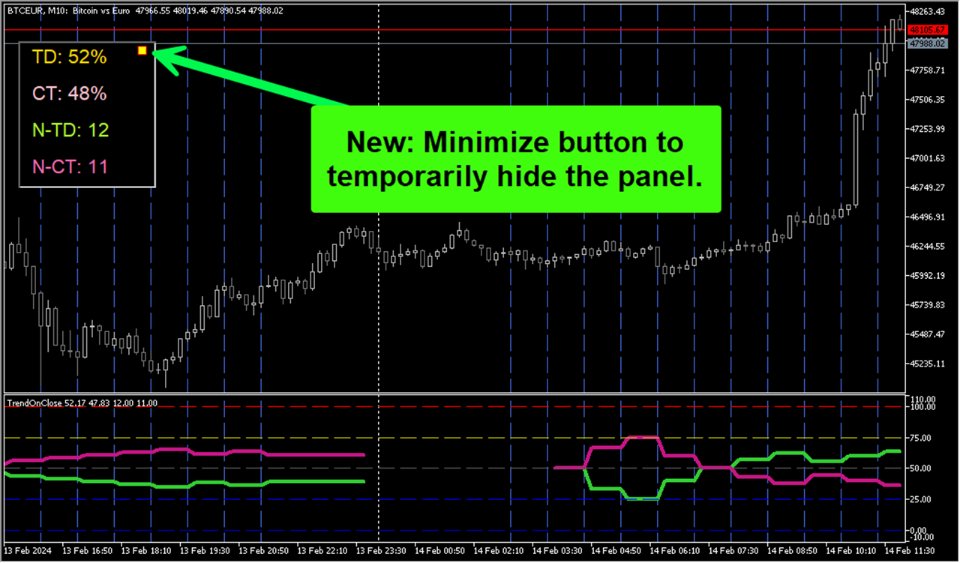
⦁ A PANEL for quick access to statistical information in text mode. The panel can be minimized or moved to any of the four quadrants of the main CHART, with many layout options.

