Trend Angle 45
- Indicators
- Ivan Stefanov
- Version: 1.0
- Activations: 5
In the trading world, a trend that follows a 45-degree angle is considered sustainable.
However, accurately measuring this critical angle remains a challenge as there is no clear method described. Traders can only guess how it is calculated, how many candle counts there should be, and what the appropriate chart zoom is.
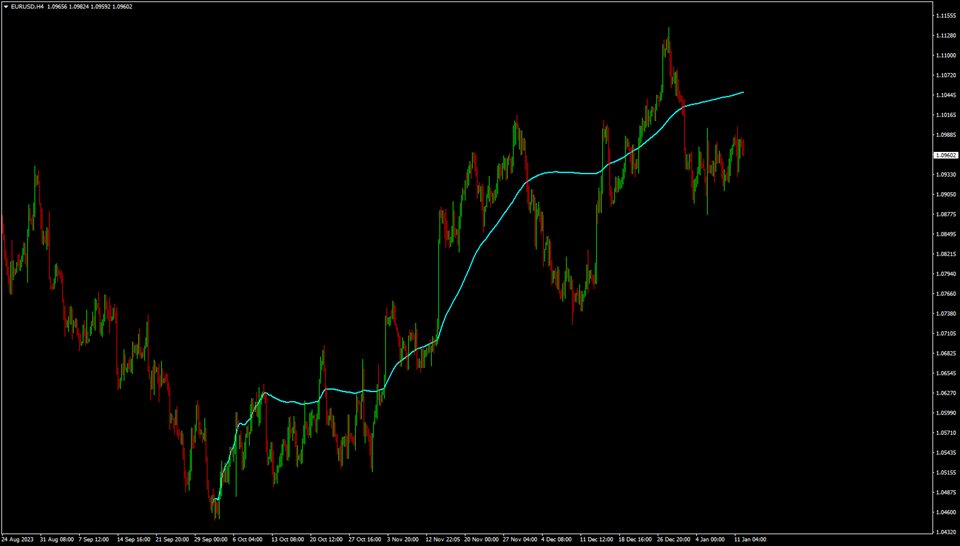
We have solved this problem and defined all the conditions logically, and now presenting you Trend Angle 45. It is a tool that visualizes the 45-degree trend line based on a complex analysis of various market factors, such as support, target, and overall movement. Fractal calculations are performed.
Although the 45-degree line is often regarded as a trading myth, Trend Angle 45 is now a valuable tool in our trading arsenal and it works. Its ability to reflect the nuances of the trend and anticipate changes at the beginning
and end of a trend makes it good for evaluation.
You will face a deep and accurate analysis of different market trends.
During the market cycle, the price can move above or below the 45-degree line, indicating different stages of the cycle.
At the beginning of a trend, the price moves below the line. During the trend, it may move along the line, and at the end, it may even have extreme values above the line. The order can vary except the initial trend stage.
How to use it?
In the indicator, simply enter the date/time when your trend starts. If the trend is sustanable just join it, it will proceed further. There are options for bullish and bearish trends, line widths and colours.
A useful tool for evaluating trends in Forex, stocks, and indices, especially for long-term trends where assessing movement strength can be challenging.
Join us!

