Chart Logic
- Utilities
- D Armond Lee Speers
- Version: 1.5
- Updated: 10 May 2024
- Activations: 10
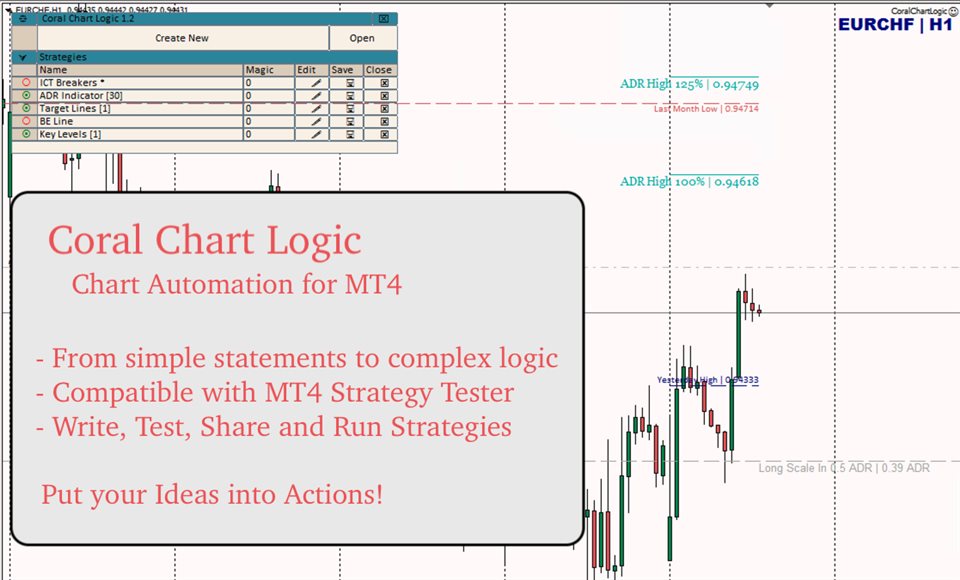
Chart Logic is here! Chart automation for MT4: put your Ideas into Actions!
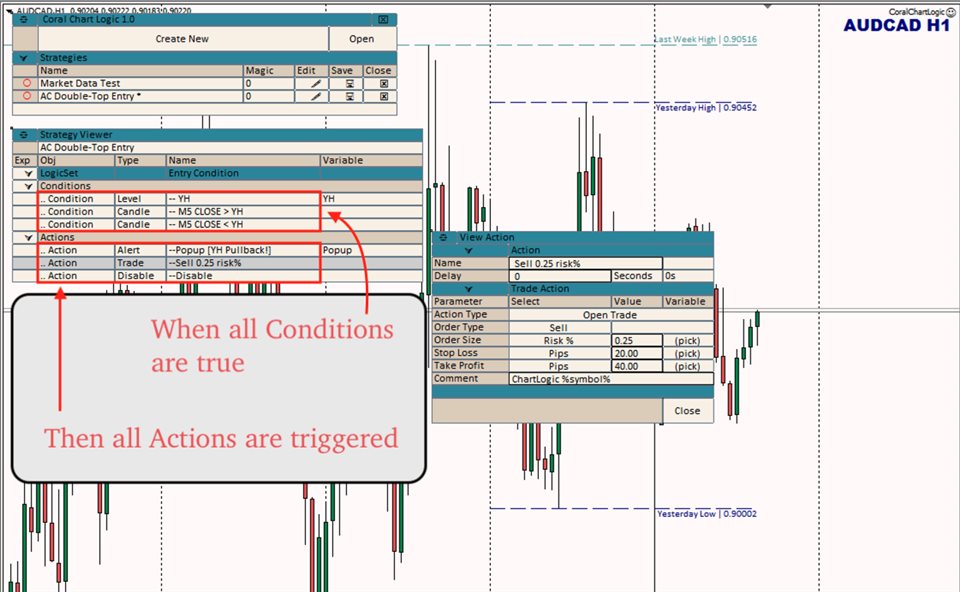
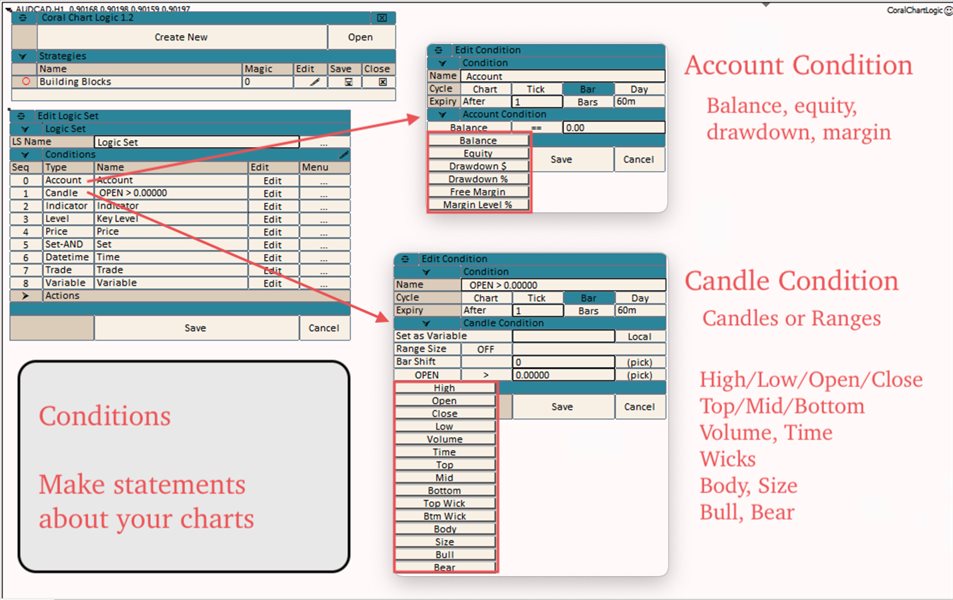
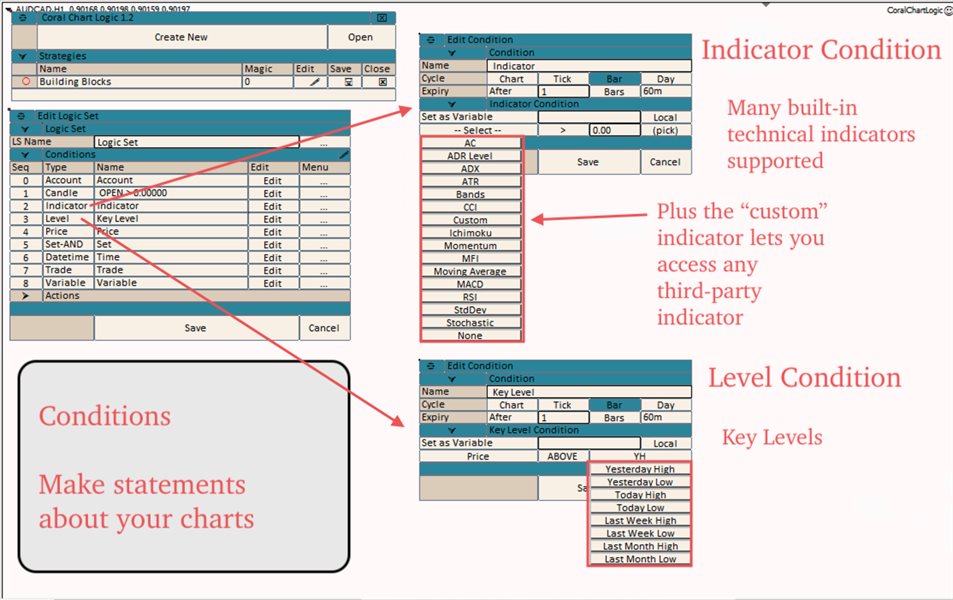
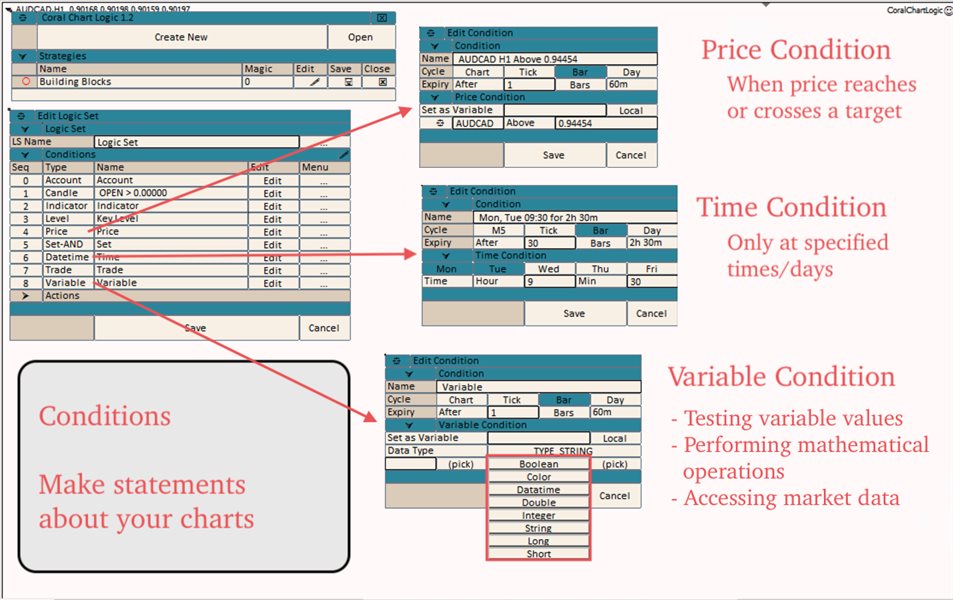
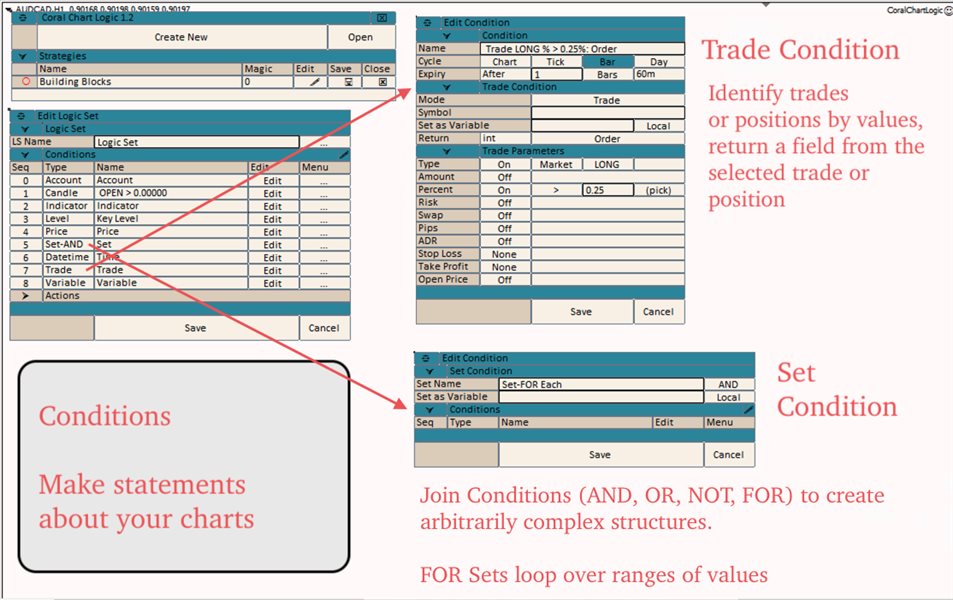
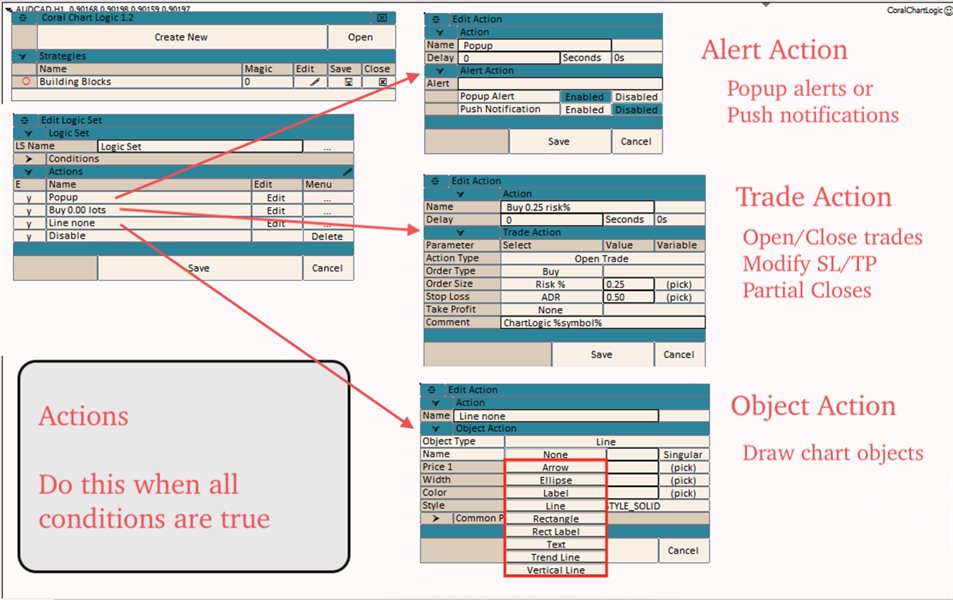
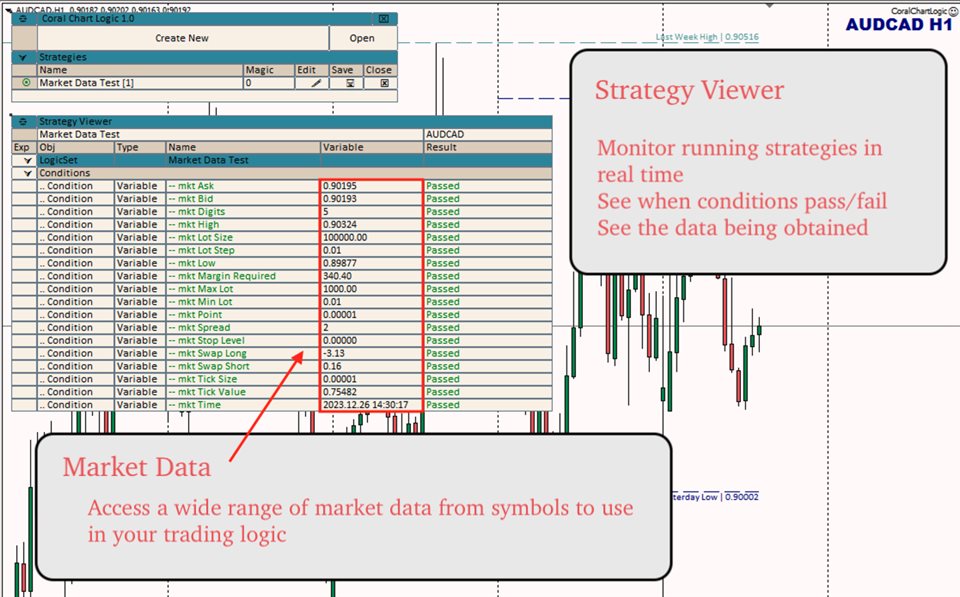
Chart Logic is an EA for MT4 that lets you automate actions on your charts. You define "conditions" and 'actions"; when all the conditions are true, then all the actions are triggered. Conditions can refer to a wide range of observations, about account information, candle data, technical indicators, key levels, price, time, market data, trades and so on. And actions can send alerts/notifications, open/close/modify trades, and draw chart objects (lines, text, etc.). You can use Chart Logic to define very simple "If A then B" kinds of statements; and you can build complete sophisticated trading strategies with arbitrarily complex logic. You can run Chart Logic strategies in the MT4 strategy tester, save and load Chart Logic files and even share them with other Chart Logic users. Using Chart Logic you can program your own EA logic: develop, test, run and share strategies like never before! Chart Logic could be the last EA you ever need to buy.
Technical Indicators / Use Third Party Indicators
There are a number of built-in technical indicators supported, but you can also add any custom indicator as a Chart Logic condition. As long as the indicator exposes its buffers and you know what inputs it expects, you can program it in Chart Logic. If you have an indicator you love but it is missing some feature (like sending notifications, or using it as an entry condition for trading), before Chart Logic the only way to use it was either to trade manually while watching it on your charts, or to write your own EA. Now you can access the thousands and thousands of available MT4 indicators and integrate them with your own automation, without writing a single line of code. (There is a limit on the number of input parameters supported, but other than that, data from any well-behaved third-party indicator can be accessed.)
Get a Head Start
We are developing a number of test / starter strategies and sample files to demonstrate how things are done in Chart Logic. And we encourage Chart Logic users to share their own strategy files to the community and discuss with other traders to really expand the knowledge base of what is possible with Chart Logic. This is just getting started, but it will grow over time. Come learn from other traders, and/or share your best trading ideas with the community! There is also a library of training videos available for free from the website. Chart Logic started as a very simple idea, but over time it has grown in its capabilities. Chart Logic provides the building blocks (conditions and actions) and rules for how they are put together, and following these rules the possibilities are almost endless. What will you automate with Chart Logic?
Backtest your Strategies
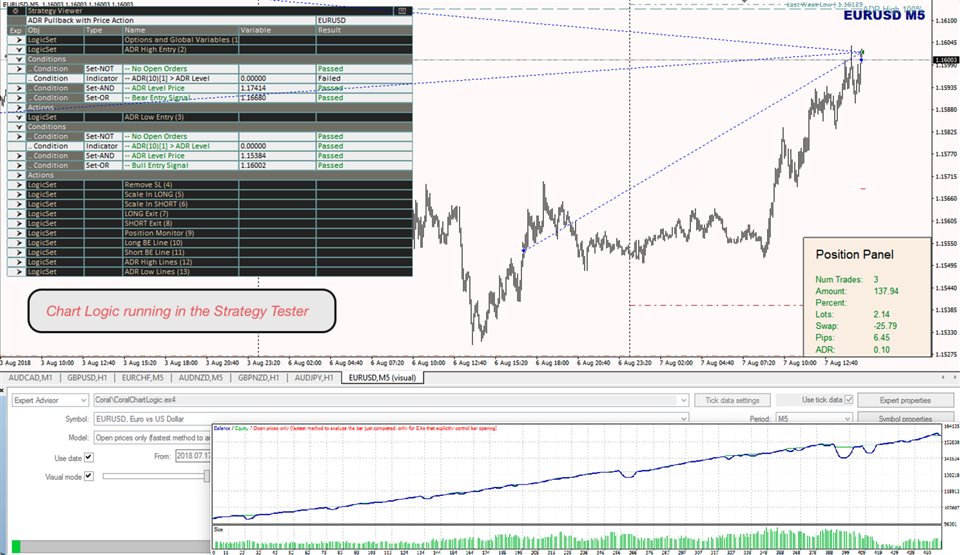
Chart Logic strategies can be run in the MT4 Strategy Tester to verify and improve your strategies. Note that, when you run Chart Logic in the strategy tester you have to give it a strategy file to run, configured in the inputs. There are some differences with how it behaves in the tester versus on a regular chart, since there are some limitations in MT4 with how charts work in the tester. If you want to download the demo to try out Chart Logic in the tester first, try downloading one of the strategy files from the Chart Logic Files section of the website (here) and running that. You won't be able to develop strategy files via the UI in the tester.
New Dashboard View!
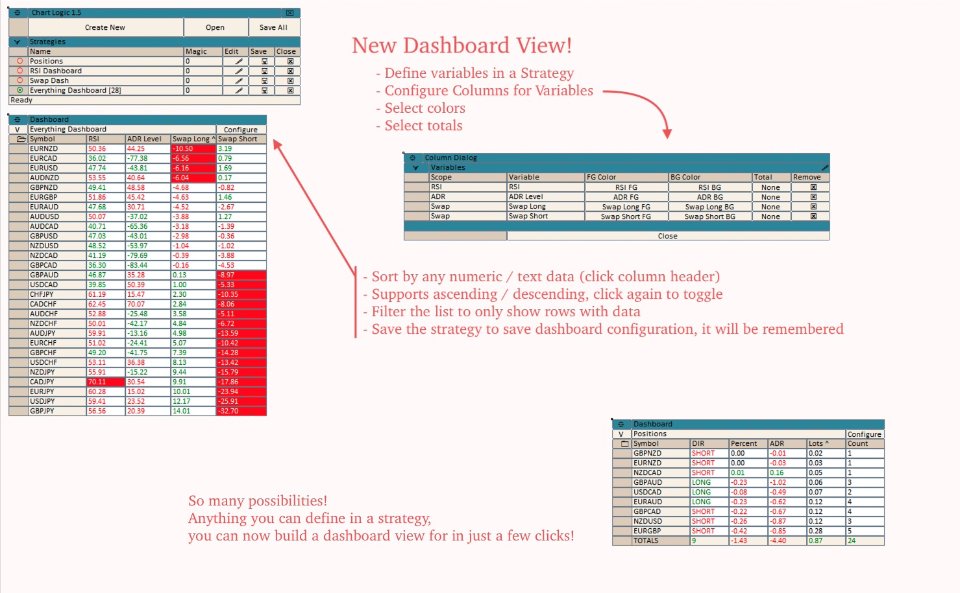
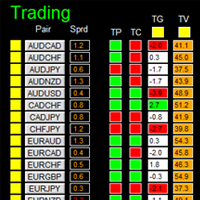
Now you can automatically build dashboards to display data for all running symbols in a single table.
- Define variables in a strategy
- In the Strategy Viewer, configure the columns to display in the dashboard (which variables, optionally with custom colors)
- Activate the strategy, turn on the Strategy Viewer to display the Dashboard
- All columns (numeric, text) are sortable, both ascending and descending. Click the column header to enable, click again to toggle direction
- Filter the list of rows in the table to only show rows with data (e.g., when building a dashboard to see all open trades)
- Optionally include a Totals row, select for each variable/column whether it is totaled as a sum or a count (or not at all)
- Save the strategy to save your dashboard settings

