Trend and Swaps BBF
- Experts
- Etsushi Ishizuka
- Version: 2.0
- Activations: 5
--EA Concept--.
This EA is developed to take advantage of trends and swaps to generate low-risk, lasting profits.
Based on the idea that automated trading is unearned income, the objective is to generate income without the hassle of chart monitoring and settings.
This EA can be used as your first choice for asset management as a hassle-free unearned income and as a money machine for the future.
--Reliability of EA
This EA has been back-tested for a total of 112 years on five currency pairs, demonstrating stable profits and low-risk operation.
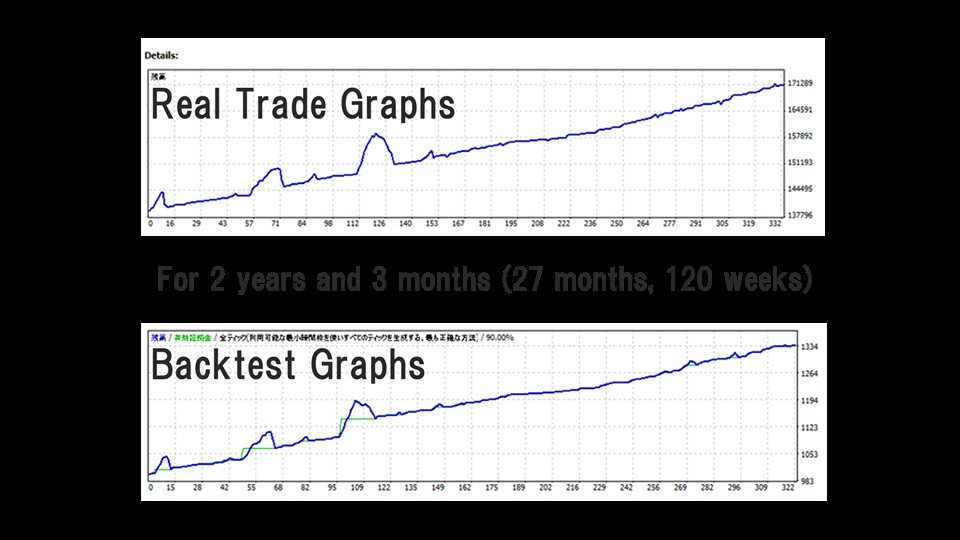
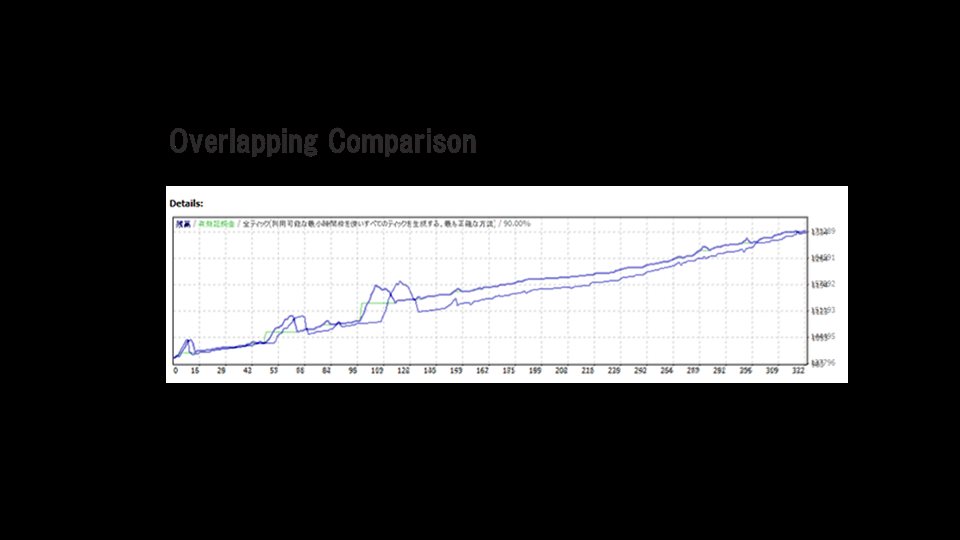
In addition, the results of real trades conducted on a yearly basis have proven consistency with the back-tests.
This proves the fact that EAs are not only tested, but also have the same results in actual trading.
--About the operation of EA--.
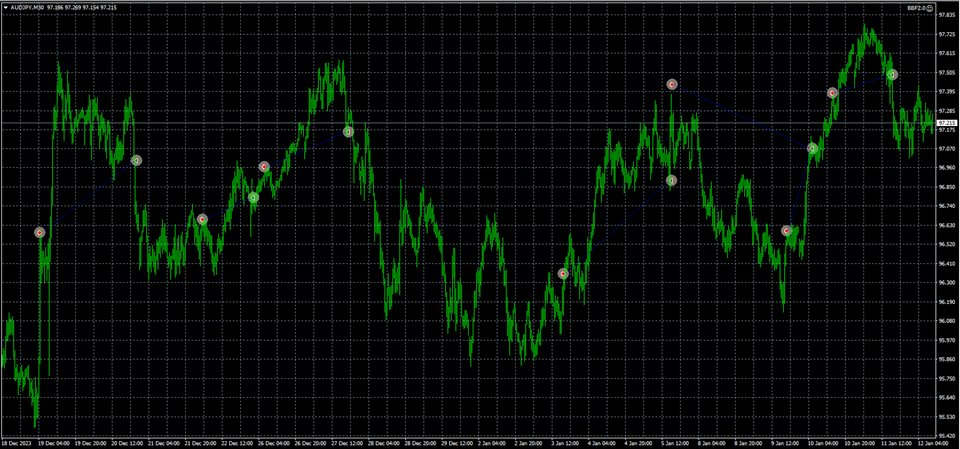
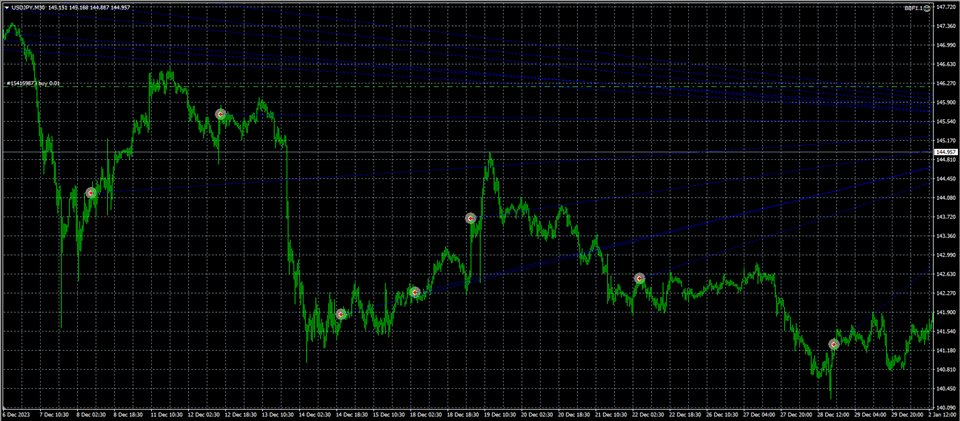
It trades normally on USDJPY, EURJPY, GBPJPY, AUDJPY, and CADJPY. Performance is not expected on the dollar straight.
It works normally only on M30.
Performance is not expected on any other time frames.
Profit average = 212.5USD/year
Average of DD = 247.19USD/year
Average of PF = 3.63/year
Features
Stable profits
Low risk and no worries about account failure
No account failure with 112 years of back testing
No need to set parameters, everyone gets the same results
Little difference between real trade and back-test results
Diversified operations with multiple currency pairs
No use of martingales and grids
Trading decisions are based on chart analysis
May temporarily be both sides of a trade
Decide the trading lot
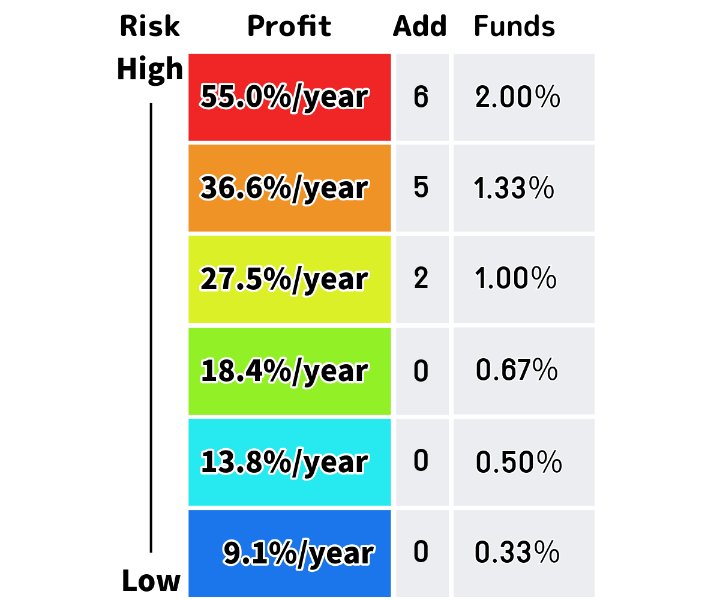
0.01LOT/500USD = profit margin of 42.5%/year (middle-risk middle-return)
0.01LOT/1,000USD = profit margin of 21.2%/year (low-risk low return)
0.01LOT/2,000USD = profit margin 10.6%/year (no-risk low return)
Refer to the back-test results below to see the magnitude and frequency of drawdowns.
If you are operating with 1,000USD, the frequency of money management will be once every few years.
For 2,000USD operation, money management will be almost unnecessary, and you will be able to operate almost without any management.
The 500USD operation can be expected to return more than 40% per year, but fund management is a must.
How to use
Trading is possible with USDJPY, EURJPY, GBPJPY, AUDJPY, and CADJPY (due to high swap points)
(1) Set to chart (2) Enter trading lot (3) Start trading
BBF requires no settings; EA parameter settings are the source of curve fit. It is a truly profitable EA, so no settings are required.
Diversified operation from 5 currency pairs is also recommended. In this case, it will be easier to manage if you separate accounts for each currency pair.
Back Test
Important] How to deal with the bug that the graph becomes negative in the back test.
If the graph of the trading result is negative, please manually enter the initial margin currency as "JPY" in the expert settings.
You can backtest with the Strategy Tester.
You can test freely, but we publish back-test results for all five currency pairs that we recommend trading.
Backtesting takes a bit of time, so you can save time by referring to this page.
| USDJPY | Profit | PF | Win rate | Max DD |
|---|---|---|---|---|
| 2000 | 286.26 | 2.41 | 74.77% | 551.48 |
| 2001 | 342.63 | 3.04 | 76.32% | 48.5 |
| 2002 | 288.36 | 1.98 | 70.59% | 461.4 |
| 2003 | 174.71 | 2.21 | 71.00% | 71.04 |
| 2004 | 242.71 | 2.19 | 69.00% | 218.95 |
| 2005 | 215.47 | 3.07 | 75.73% | 92.11 |
| 2006 | 217.36 | 2.22 | 77.27% | 179.63 |
| 2007 | 322.39 | 1.83 | 70.80% | 762.99 |
| 2008 | 171.38 | 1.27 | 64.71% | 558.94 |
| 2009 | 338.95 | 2.75 | 70.10% | 45.98 |
| 2010 | 220.75 | 2.78 | 74.39% | 48.59 |
| 2011 | 966.21 | 15.67 | 83.33% | 870.34 |
| 2012 | 243.97 | 7.85 | 86.36% | 5.78 |
| 2013 | 410.51 | 3.81 | 78.26% | 134.85 |
| 2014 | 225.31 | 5.23 | 78.18% | 114.3 |
| 2015 | 198.07 | 2.62 | 75.64% | 104.8 |
| 2016 | 311.81 | 2.06 | 72.45% | 181.77 |
| 2017 | 245.66 | 2.21 | 76.34% | 421.28 |
| 2018 | 231.23 | 2.3 | 74.44% | 287.7 |
| 2019 | 137.65 | 3.13 | 79.37% | 41.68 |
| 2020 | 138.5 | 1.85 | 71.43% | 540.39 |
| 2021 | 174.97 | 8.69 | 83.02% | 13.19 |
| 2022 | 280.87 | 3.43 | 78.00% | 1.87 |
| 2023 | 225.72 | 2.47 | 76.67% | 174.93 |
| Ave | 275.48 | 3.63 | 75.3% | 247.19 |
| EURJPY | Profit | PF | Win rate | Max DD |
|---|---|---|---|---|
| 2000 | 190.17 | 2.22 | 81.43% | 113.42 |
| 2001 | 204.18 | 2.22 | 74.36% | 71.43 |
| 2002 | 149.79 | 2.58 | 76.92% | 47.48 |
| 2003 | 211.6 | 2.59 | 82.93% | 39.04 |
| 2004 | 204.87 | 2.58 | 81.51% | 65.46 |
| 2005 | 158.03 | 2 | 80.77% | 219.68 |
| 2006 | 178.78 | 5.18 | 82.08% | 28.09 |
| 2007 | 202.99 | 2.35 | 78.95% | 160.83 |
| 2008 | 240.35 | 1.07 | 75.32% | 455.01 |
| 2009 | 256.46 | 2.14 | 76.32% | 82.01 |
| 2010 | 162.11 | 1.23 | 61.03% | 532.13 |
| 2011 | 174.12 | 2.32 | 74.51% | 62.15 |
| 2012 | 327 | 1.7 | 62.70% | 1003.89 |
| 2013 | 301.67 | 3.09 | 75.70% | 6.34 |
| 2014 | 135.99 | 1.14 | 58.71% | 788.36 |
| 2015 | 216.01 | 1.83 | 76.64% | 479.16 |
| 2016 | 161 | 1.85 | 72.12% | 213.98 |
| 2017 | 368.32 | 6.1 | 74.04% | 176.86 |
| 2018 | 146.92 | 1.79 | 70.64% | 153.01 |
| 2019 | 126.53 | 1.86 | 69.86% | 150.09 |
| 2020 | 174.14 | 2.66 | 69.89% | 82.78 |
| 2021 | 133.86 | 2.8 | 75.00% | 19.3 |
| 2022 | 224.34 | 2.47 | 73.53% | 76.42 |
| 2023 | 198.01 | 24.71 | 70.00% | 24.71 |
| Ave | 201.97 | 3.35 | 74.0% | 210.48 |
| GBPJPY | Profit | PF | Win rate | Max DD |
|---|---|---|---|---|
| 2000 | 312.06 | 1.44 | 70.06% | 247.63 |
| 2001 | 314.61 | 2.42 | 75.37% | 54.22 |
| 2002 | 237.26 | 2.7 | 80.33% | 158.01 |
| 2003 | 216.8 | 1.34 | 71.83% | 283.49 |
| 2004 | 325.03 | 2.2 | 73.79% | 65.72 |
| 2005 | 262.94 | 1.62 | 73.86% | 373.47 |
| 2006 | 319.12 | 4.16 | 81.43% | 31.99 |
| 2007 | 289.98 | 1.1 | 68.94% | 1180.23 |
| 2008 | -181.54 | 0.97 | 74.50% | 1794.85 |
| 2009 | 401.73 | 2.39 | 75.93% | 54.6 |
| 2010 | 137.51 | 1.16 | 66.32% | 1362.86 |
| 2011 | 253.81 | 1.87 | 70.80% | 232.73 |
| 2012 | 258.6 | 2.77 | 77.67% | 188.75 |
| 2013 | 221.96 | 2.61 | 75.45% | 63.05 |
| 2014 | 274.18 | 2.98 | 74.76% | 80.32 |
| 2015 | 200.81 | 1.24 | 63.33% | 350.86 |
| 2016 | 293.21 | 1.47 | 70.23% | 892.17 |
| 2017 | 275.4 | 2.13 | 69.11% | 290.38 |
| 2018 | 233.53 | 1.49 | 71.74% | 1050.12 |
| 2019 | 205.53 | 2.56 | 68.42% | 32.12 |
| 2020 | 123.77 | 1.14 | 61.84% | 846.79 |
| 2021 | 251.32 | 4.16 | 79.17% | 4.16 |
| 2022 | 171.3 | 1.15 | 75.19% | 485.56 |
| 2023 | 219.94 | 3.34 | 72.63% | 48.15 |
| Ave | 234.12 | 2.10 | 72.6% | 423.84 |
| AUDJPY | Profit | PF | Win rate | Max DD |
|---|---|---|---|---|
| 2000 | 219.07 | 1.93 | 68.91% | 702.49 |
| 2001 | 202.01 | 2.18 | 71.43% | 302.19 |
| 2002 | 152.73 | 2.44 | 77.42% | 178.21 |
| 2003 | 144.49 | 2.69 | 81.98% | 16.6 |
| 2004 | 135.44 | 2.2 | 75.81% | 67.88 |
| 2005 | 125.47 | 2.61 | 84.27% | 49.38 |
| 2006 | 137.93 | 5.04 | 82.50% | 5.95 |
| 2007 | 205.05 | 2.81 | 81.11% | 53.55 |
| 2008 | -69.44 | 0.99 | 72.00% | 1292.68 |
| 2009 | 223.67 | 2.43 | 74.04% | 63.35 |
| 2010 | 146.69 | 1.67 | 71.55% | 304.34 |
| 2011 | 154.97 | 1.96 | 72.12% | 196.75 |
| 2012 | 171.44 | 2.18 | 71.84% | 285.18 |
| 2013 | 165.88 | 1.22 | 51.04% | 1082.83 |
| 2014 | 132.5 | 2.51 | 75.00% | 54.77 |
| 2015 | 130.97 | 1.62 | 73.00% | 198.64 |
| 2016 | 154.11 | 1.86 | 73.27% | 159.41 |
| 2017 | 134.09 | 2.5 | 79.76% | 91.32 |
| 2018 | 126.12 | 1.77 | 74.68% | 338.18 |
| 2019 | 131.73 | 2.18 | 77.36% | 372.64 |
| 2020 | 142.99 | 1.7 | 70.79% | 686.54 |
| 2021 | 115.37 | 2.03 | 71.23% | 160.44 |
| 2022 | 182.46 | 3.55 | 79.55% | 5.81 |
| 2023 | 137.15 | 2.39 | 76.32 | 230.62 |
| Ave | 145.95 | 2.27 | 74.4% | 287.49 |
| CADJPY | Profit | PF | Win rate | Max DD |
|---|---|---|---|---|
| 2008 | 213.35 | 1.21 | 67.19% | 306.79 |
| 2009 | 271.57 | 2.56 | 77.78% | 152.23 |
| 2010 | 150.42 | 2.07 | 74.55% | 64.36 |
| 2011 | 201.18 | 2.06 | 69.81% | 379.93 |
| 2012 | 144.47 | 2.73 | 81.33% | 154.17 |
| 2013 | 215.35 | 2.51 | 71.00% | 240.33 |
| 2014 | 153.89 | 3.07 | 79.71% | 159.64 |
| 2015 | 141.42 | 1.58 | 68.69% | 668.79 |
| 2016 | 172.38 | 2.4 | 73.56% | 144.22 |
| 2017 | 142.76 | 2.19 | 72.41% | 259.4 |
| 2018 | 198.21 | 1.92 | 74.42% | 786.29 |
| 2019 | 105.04 | 2.99 | 79.66% | 64.48 |
| 2020 | 145.06 | 1.88 | 73.85% | 357 |
| 2021 | 151.85 | 3.56 | 76.00% | 42.72 |
| 2022 | 278.39 | 1.6 | 60.82% | 461.34 |
| 2023 | 183.57 | 2.79 | 79.79 | 136.13 |
| Ave | 179.31 | 2.32 | 73.79% | 273.61 |

