Cobra Pivots with Alerts
- Indicators
- Rajesh Kumar Nait
- Version: 1.3
- Updated: 18 December 2023
- Activations: 5
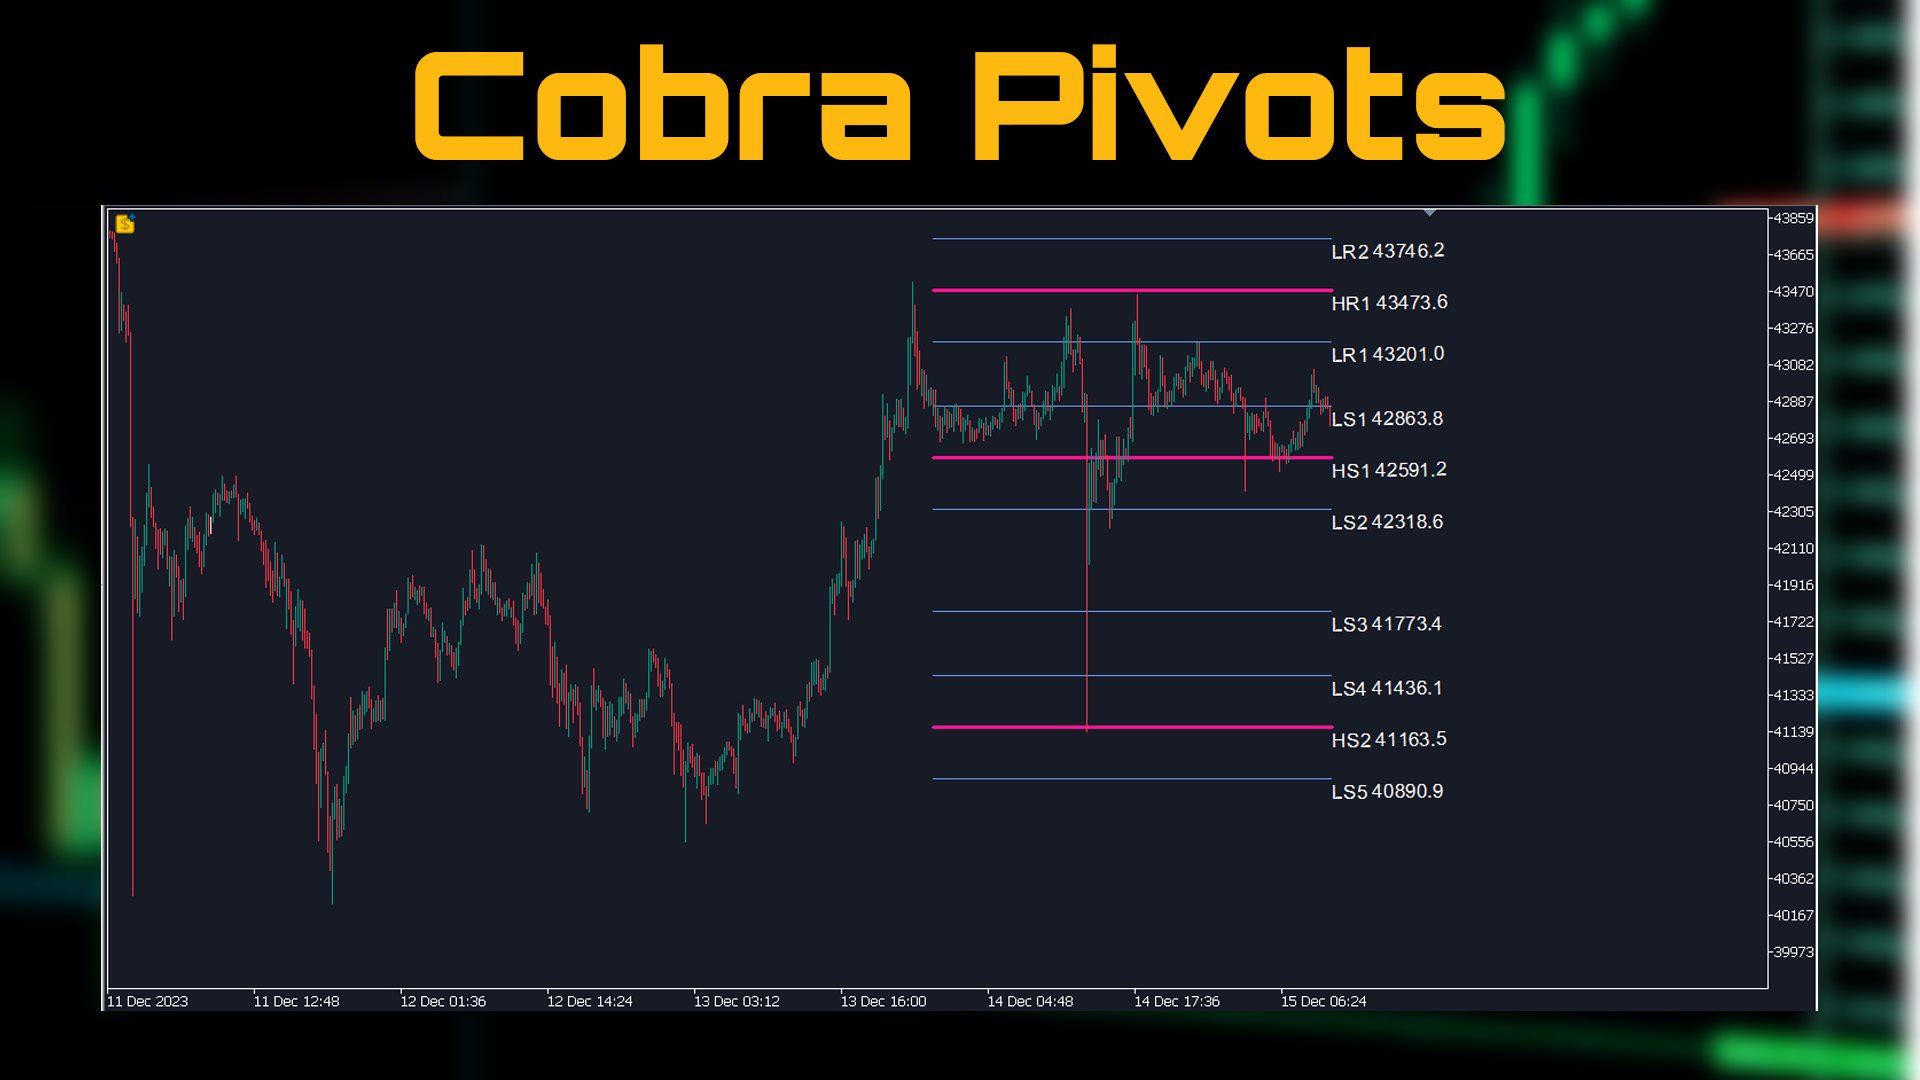
Cobra Pivot Points is an indicator for plotting best optimized pivot points support and resistance levels which you can backtest yourself by downloading the DEMO.
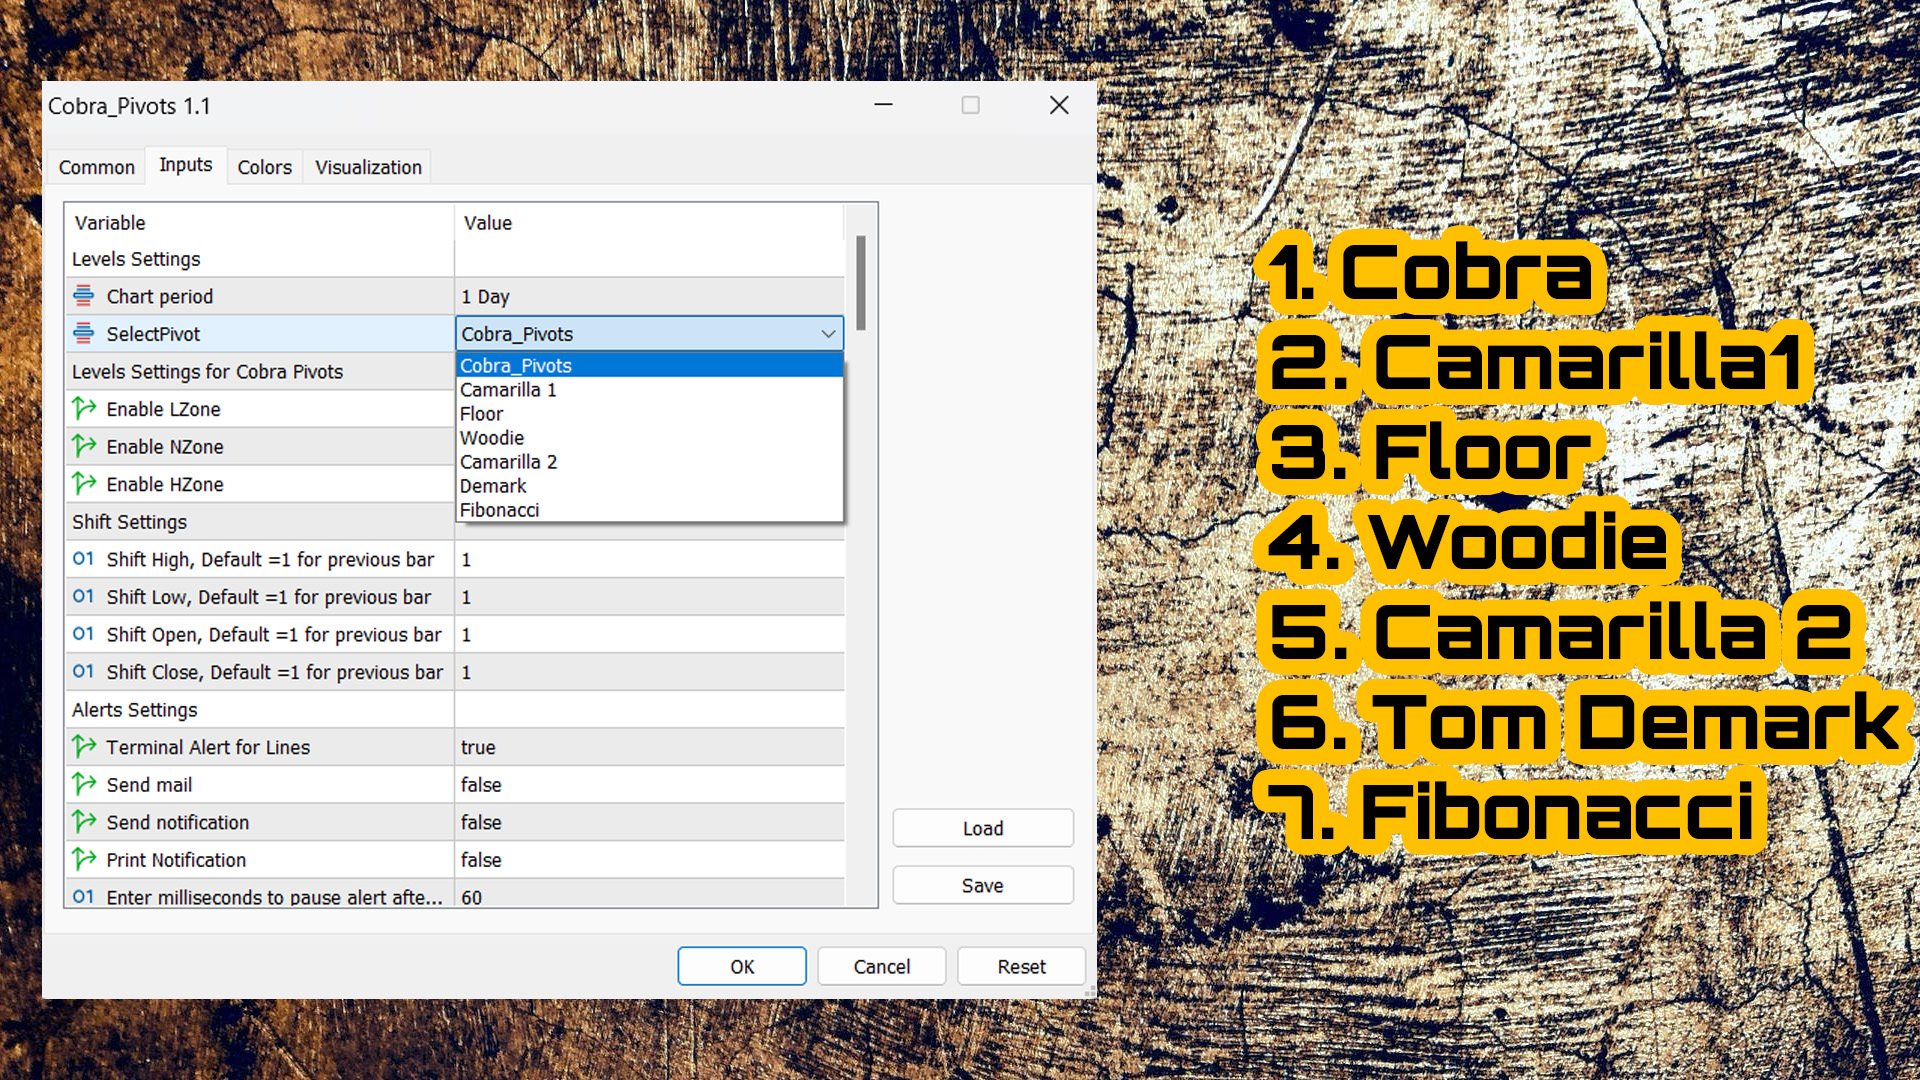
1. Select 7 type of Pivot Mode : Cobra, Camarilla 1, Camarilla 2, Floor, Woodie, Demark and Fibonacci pivots
2. You can use any time frame to find pivot points support and resistance
3. You can play with Previous day High Low Close value with Shift parameter. 1 = Previous Bar, 2 = Bar before Previous bar and so on.. These parameter will help you in research and development on pivots.
4. Alert, Email or Push Notification once on levels touch. Once level is touched, pivot level is considered mitigated so it wont alert you again. If you want alert again, so you need to change time frames to reset alerts.
5. Completely customize Line Color, Line Style, Line Width, Text Color and Font.
Cobra Pivots are separated in three zones : LZone (very nearby levels for scalping), NZone (when market is consolidating) and HZone (Level with a little bit of distance best for positional trading) which can be shown/hidden from indicator settings.
Cobra Pivot Formula : Custom
Floor Pivot Formula is:
Pivot (P) = (H + L + C) / 3
Resistance (R1) = (2 x P) - L
R2 = P + H - L
R3 = H + 2 x (P - L)
Support (S1) = (2 x P) - H
S2 = P - H + L
S3 = L - 2 x (H - P)
Woodie Pivot Formula is:
Pivot (P) = (H + L + 2 x C) / 4
Resistance (R1) = (2 x P) - L
R2 = P + H - L
Support (S1) = (2 x P) - H
S2 = P - H + L
Camrilla1 Pivot Formula is :
   LS1 = PREVIOS DAY CLOSE- ((PREVIOUS DAY HIGH-PREVIOUS DAY LOW)*0.50);
   LS2 = PREVIOUS DAY CLOSE- ((PREVIOUS DAY HIGH-PREVIOUS DAY LOW)*0.75);
   LS3 = PREVIOUS DAY CLOSE- ((PREVIOUS DAY HIGH-PREVIOUS DAY LOW));
   LS4 = PREVIOUS DAY CLOSE- ((PREVIOUS DAY HIGH-PREVIOUS DAY LOW)*1.25);


   HS1 = PREVIOUS DAY CLOSE+ ((PREVIOUS DAY HIGH-PREVIOUS DAY LOW)*0.5);
   HS2 = PREVIOUS DAY CLOSE+ ((PREVIOUS DAY HIGH-PREVIOUS DAY LOW)*0.75);
   HS3 = PREVIOUS DAY CLOSE+ ((PREVIOUS DAY HIGH-PREVIOUS DAY LOW));
   HS4 = PREVIOUS DAY CLOSE+ ((PREVIOUS DAY HIGH-PREVIOUS DAY LOW)*1.25);
Camarilla2 Pivot Formula is:
R4 = (H - L) x 1.1 / 2 + C
R3 = (H - L) x 1.1 / 4 + C
R2 = (H - L) x 1.1 / 6 + C
R1 = (H - L) x 1.1 / 12 + C
S1 = C - (H - L) x 1.1 / 12
S2 = C - (H - L) x 1.1 / 6
S3 = C - (H - L) x 1.1 / 4
S4 = C - (H - L) x 1.1 / 2
Tom Demark's Pivot Formula is:
If Close < Open: X = H + (2 x L) + C
If Close > Open: X = (2 x H) + L + C
If Close = Open: X = H + L + (2 x C)
R1 = (X / 2) - L
S1 = (X / 2) - H
Fibonacci Pivot Formula is
R3 = PP + ((High - Low) x 1.000)
R2 = PP + ((High - Low) x 0.618)
R1 = PP + ((High - Low) x 0.382)
PP = (H + L + C) / 3
S1 = PP - ((High - Low) x 0.382)
S2 = PP - ((High - Low) x 0.618)
S3 = PP - ((High - Low) x 1.000)