MACD Color Indicator
- Indicators
- Adrian Hernandez Castellanos
- Version: 1.9
- Updated: 29 February 2024
- Activations: 20
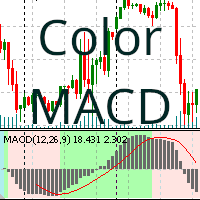
MACD Indicator with color background based on buy or sell trend
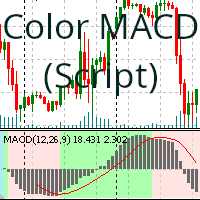
This indicator colors the background based on the value of the MACD (Moving Average Convergence Divergence) indicator, depending on its buying or selling tendency. The background color is determined based on the stochastic oscillator parameters, painting only the last 400 bars (see notes) and is used to measure the strength of a trend and the probability of a reversal.
The parameters you can modify are the same as those provided by the Metatrader MACD indicator and additionally those needed to edit the colors you decide are the most suitable for you. The following are the parameters you can modify:
- Fast EMA: Period for the fast exponential moving average.
- Slow EMA: Period for the slow exponential moving average.
- MACD SMA: Simple moving average to calculate the MACD signal line.
- Apply To: (Close price, Open price, High price, Low price, Median price, Typical price, Weighted price).
- Color Positive Trend: Background color for an uptrend.
- Color Negative Trend: Background color for a downtrend.
- Color Neutral Trend: Background color for a neutral trend.
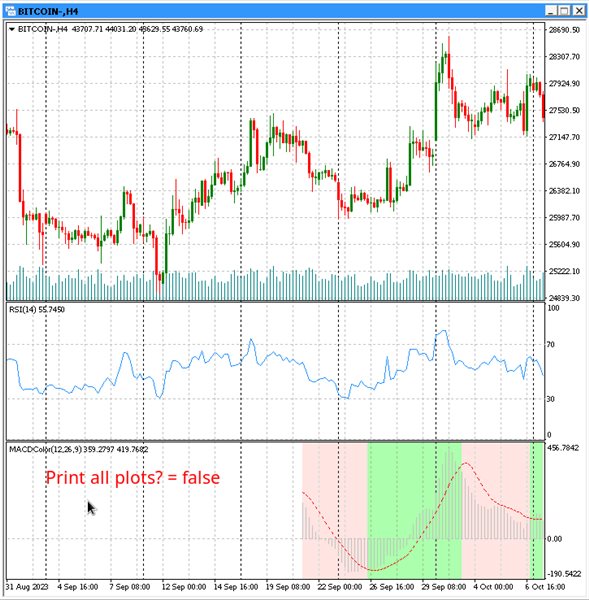
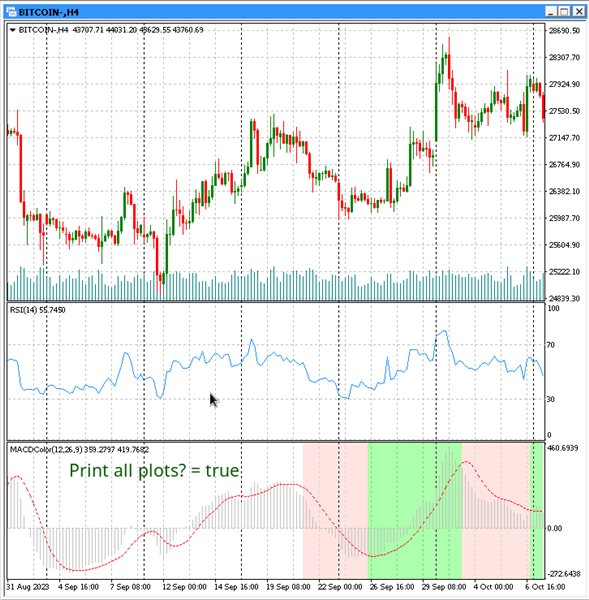
- Print all plots?: By default, only the indicator values for up to two weeks are drawn. If you want more values, from the beginning of the bars, you will need to use the "true" value (see notes).
How to use the indicator
It works like any other Metatrader indicator that is dragged and dropped onto the chart.
Conclusion
This indicator is a useful tool for traders who use the MACD indicator. It makes it easy to identify bullish, bearish, and neutral trends in real time.
Notes
- If you are a market analyst or your trading uses different timeframes, it is recommended to use the free tool: https://www.mql5.com/en/market/product/109511
- Due to high resource consumption and fast execution, it is recommended to use the parameter "Print all plots? = false". This will limit the values obtained by the indicator to a maximum of two weeks (or the bars defined in your Metatrader Options).
- The restriction to 400 bars is because a market trader usually needs quick visual data, hence this limitation. (Please leave any comments on this matter in the corresponding section). In any case, if you want to overcome this limitation momentarily, you can also use the free tool mentioned in the first note to use it from the bars where you are interested to the current time, both tools were developed to be compatible.
