Effort and Result
- Indicators
- Pavel Milicka
- Version: 1.5
- Updated: 13 December 2023
- Activations: 5
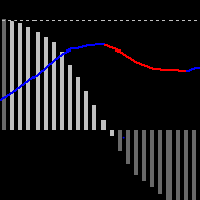
This indicator shows the MACD line and the difference WMACD - MACD to it. that is, the divergence between price and weighted acceleration. Divergence is shown with a histogram. It took a bit of math to get a readable result.
What does the histogram say?
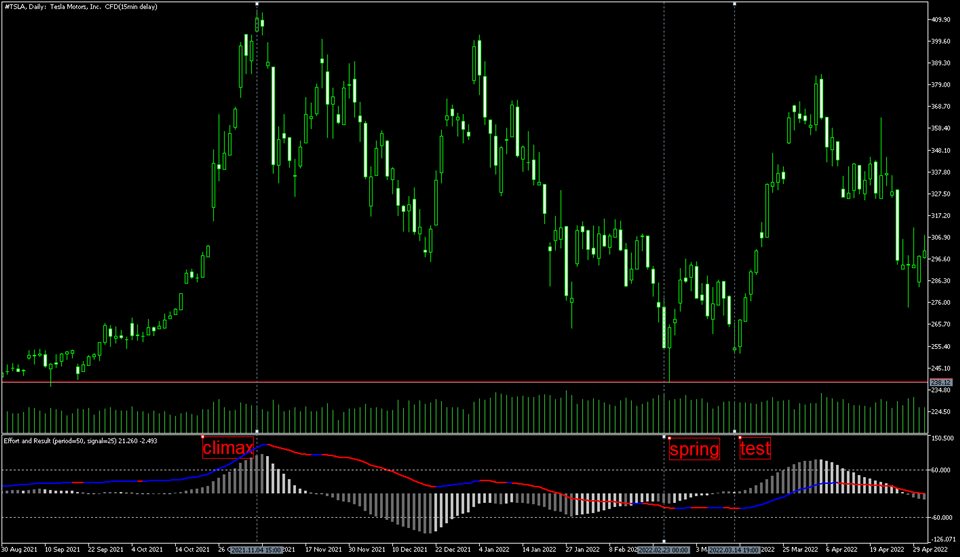
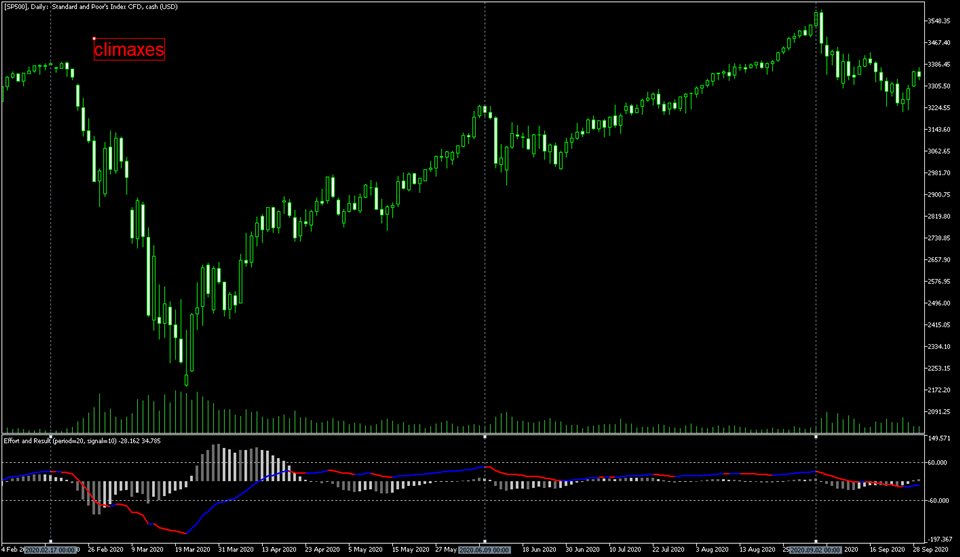
If the course is consistent with the price movement, then the price is driven by volumes. It is passing through an area of higher liquidity, the market is being manipulated by strong money. Within Wyckoff's theory, these are typically climax and spring.
If the line and the histogram move in the opposite direction, it means that this is an area of lower liquidity. You can wait for burnout and turnover. Sometimes this burnout is preceded by a high volume climax.
MACD is normalized using ATR.
Parameters:
1) EMA period,
2) signal line period as a percentage of the first period are entered as parameters. It's better to work with robots.
3) ratio MACD/histogram. Please, set it individually for symbol and timeframe.
4) applied volume.
FREE JPY DEMO: https://www.mql5.com/en/market/product/109842


