• Overview
  • Reviews
  • Comments (6)
  • What's new

Rule Plotter Scanner

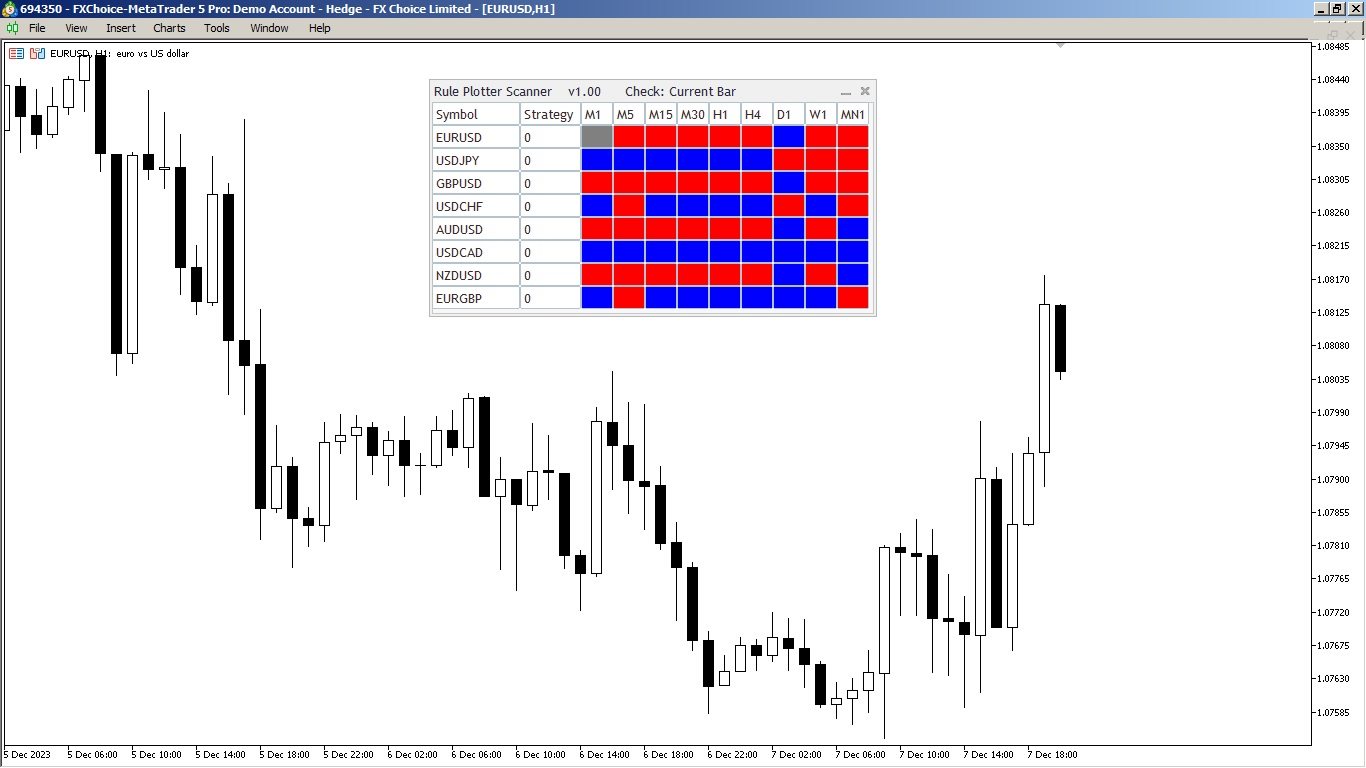
Have you ever thought about having a scanner that scans all strategies and shows the buy and sell points for all timeframes of that asset, all at the same time?

That's exactly what this scanner does. This scanner is designed to display the buy and sell signals you created in the Rule Plotter: strategy creator without programming and run them within this scanner on various assets and different timeframes.

The default strategy for Rule Plotter is only bullish and bearish candles. This means that if you don't draw any strategies within Rule Plotter, this scanner will show you the color of the selected asset's candle on all timeframes, red if the candle is negative, and green if the candle is positive.

Create as many strategies as you want

Don't limit yourself to the default strategy; use your creativity to your advantage and build traditional strategies with all the indicators available in Metatrader.

Or build custom strategies using your favorite indicators.

This scanner is just the tip of the iceberg of what Rule Plotter has to offer; it's just an assistant to Rule Plotter.

However, the real magic isn't in these tools, as they are just tools for you to explore your creativity.

With this scanner, you'll have a broad view of how your strategies are performing on all timeframes of the assets you've chosen.

Looking at all your indicators giving signals at the same time will give you great confidence to enter your operation because you'll have a comprehensive view of what other market players are seeing, and thus, your chances of misjudging the market direction will decrease significantly.

And it doesn't stop there; we are developing a feature so that you can also integrate this scanner into Rule Plotter. This way, you'll have even more creative power because, for the first time, you'll have a scanner as a strategy indicator to execute your trades fully automatically with Rule Plotter Expert.

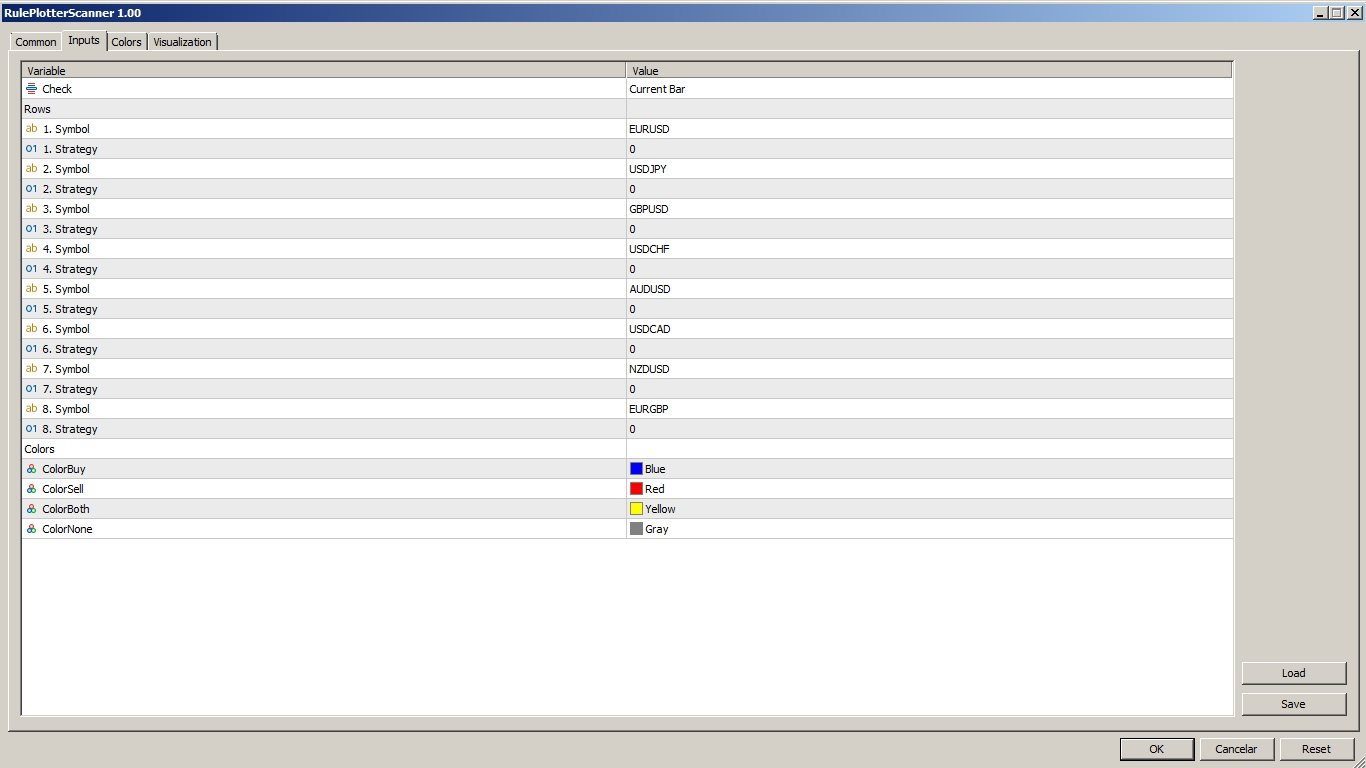
Currently, we have 8 lines for you to operate, but this is not your limit since you have the ability to insert as many instances of this scanner as you want. This means that by inserting the first instance, you'll have 8 lines within the scanner; by inserting the second instance, you'll have another 8 lines, the same for the third instance, fourth, and so on until you think it's enough.

Save and Load Inputs in Metatrader

Save your input settings by using the save button on the input tab of the indicator. This button will generate a .set file, which you can use to load the settings 100% natively in Metatrader. This is how it works for all Metatrader indicators, and with this scanner, it's no different.

To load the settings, simply click on the load button on the same input tab of your indicator and choose the file you saved before, and you'll have all the input settings back.

Save Analysis Time with this Scanner

Use this scanner to your advantage, create traditional strategies, or your strategies and let this scanner scan them for you on all timeframes with the combination of an asset or all the assets you prefer.

This free version doesn't have alerts. If you want to help in the development of this product line and think alerts are important to you, you may consider purchasing the paid version of this Strategy Scanner with Alerts.

Recommended products
Cybertrade Keltner Channels
Emanuel Andriato
4.75 (4)
Cybertrade Keltner Channels - MT5 Created by Chester Keltner, this is a volatility indicator used by technical analysis. It is possible to follow the trend of financial asset prices and generate support and resistance patterns. In addition, envelopes are a way of tracking volatility in order to identify opportunities to buy and sell these assets. It works on periods longer than the period visible on the chart. All values ​​are available in the form of buffers to simplify possible automations.
FREE
QuantumAlert Stoch Navigator is a free indicator available for MT4/MT5 platforms, its work is to provide "alerts" when the market is inside "overbought and oversold" regions in the form of "buy or sell" signals. This indicator comes with many customization options mentioned in the parameter section below, user can customise these parameters as needful. Join our   MQL5 group , where we share important news and updates. You are also welcome to join our private channel as well, contact me for the p
FREE
BOS CHoCH and FVG
Saksham Solanki
4 (2)
Contact me for any queries or custom orders, if you want to use this in an EA. Key Features: Pattern Recognition : Identifies Fair Value Gaps (FVGs) Spots Break of Structure (BOS) points Detects Change of Character (CHoCH) patterns Versatile Application : Optimized for candlestick charts Compatible with any chart type and financial instrument Real-Time and Historical Analysis : Works seamlessly with both real-time and historical data Allows for backtesting strategies and live market analysis Vis
FREE
Girassol Sunflower MT5 Indicator
Saullo De Oliveira Pacheco
4.33 (6)
This is the famous Sunflower indicator for Metatrader5. This indicator marks possible tops and bottoms on price charts. The indicator identifies tops and bottoms in the asset's price history, keep in mind that the current sunflower of the last candle repaints, as it is not possible to identify a top until the market reverses and it is also not possible to identify a bottom without the market stop falling and start rising. If you are looking for a professional programmer for Metatrader5, please
FREE
The   Haven FVG   indicator is a market analysis tool that highlights inefficiency areas (Fair Value Gaps, FVG) on the chart, providing traders with key levels for price analysis and decision-making. Other products ->  HERE Main Features: Customizable color settings: Color for Bullish FVG   (Bullish FVG Color). Color for Bearish FVG   (Bearish FVG Color). Flexible FVG visualization: Maximum number of candles for FVG detection. Additional extension of FVG zones by a specified number of bars. Opt
FREE
This Mt5 Indicator Signals when there is two opposite direction bars engulfed by current bar.  has a recent Exponential Moving Average Cross and past bar was oversold/bought Expert Advisor Available in Comments  Free Version Here : https://www.mql5.com/en/market/product/110114?source=Site&nbsp ; Full Alerts for mt5 terminal , phone , email, print to file, print to journal  Buy Signal ( blue line ) Past ema cross ( set at 30 bars back ) Past bar rsi is oversold ( level 40  ) Engulfing bar closes
FREE
Value Chart Candlesticks
Flavio Javier Jarabeck
4.73 (11)
The idea of a Value Chart indicator was presented in the very good book I read back in 2020 , " Dynamic Trading Indicators: Winning with Value Charts and Price Action Profile ", from the authors Mark Helweg and David Stendahl. The idea is simple and the result is pure genius: Present candlestick Price analysis in a detrended way! HOW TO READ THIS INDICATOR Look for Overbought and Oversold levels. Of course, you will need to test the settings a lot to find the "correct" one for your approach. It
FREE
Coral Indi
Dinh Duong Luong
Coral trend is   a trend-following indicator that is widely popular among FOREX traders . It is usually used as a confluence with other indicators. It uses combinations of moving averages with complex smoothing formulas! It has two configurable parameters: Coefficient   - smoothing ratio (*) Applied price Calculation: Coral = (-0.064) * B6 + 0.672 * B5 - 2.352 * B4 + 2.744 * B3
FREE
Bounce Zone MT5
Nguyen Thanh Cong
4.43 (7)
Introduction The Bounce Zone indicator is a cutting-edge non-repainting technical tool built to identify key areas on the price chart where market sentiment is likely to cause a significant price reversal. Using advanced algorithms and historical price data analysis, this indicator pinpoints potential bounce zones. Combined with other entry signal, this indicator can help forex traders place the best trades possible Signal A possible buy signal is generated when price is in the green zone an
FREE
Necessary for traders: tools and indicators Waves automatically calculate indicators, channel trend trading Perfect trend-wave automatic calculation channel calculation , MT4 Perfect trend-wave automatic calculation channel calculation , MT5 Local Trading copying Easy And Fast Copy , MT4 Easy And Fast Copy , MT5 Local Trading copying For DEMO Easy And Fast Copy , MT4 DEMO Easy And Fast Copy , MT5 DEMO The homeopathic indicator is also called the CCI indicator. The CCI indicator was proposed
FREE
Donchian Pro
Paulo Henrique Faquineli Garcia
5 (3)
The Donchian Channel Channels are among the most popular tools of technical analysis, as they visually convey to the analyst the limits within which most price movement tends to occur. Channel users know that valuable information can be obtained at any time, whether prices are in the central region of a band or close to one of the border lines. One of the best known techniques to explore these concepts is Bollinger Bands. However, John Bollinger was not the only one to research the application
FREE
Bar Color Trend
Germano Chagas
4.38 (8)
Combining the best of Price Action , Directional Movement , and Divergence/Convergence analysis, Candle Color Trend is a easy and reliable way to identify trend direction. The indicator automatically paints the candles according to the assumption that an uptrend is defined by prices that form a series of higher highs and higher lows. In contrast, a downtrend is defined by prices that form a series of lower highs and lower lows. Additionally, ADX Wilder indicator is used to measure trend weakness
FREE
Are you tired of drawing trendlines every time you're analyzing charts? Or perhaps you would like more consistency in your technical analysis. Then this is for you. This indicator will draw trend lines automatically when dropped on a chart. How it works Works similar to standard deviation channel found on mt4 and mt5. It has 2 parameters: 1. Starting Bar 2. Number of bars for calculation The   starting bar   is the bar which drawing of the trend lines will begin, while the   number of bars for c
FREE
Santa Donchian
Marco Aurelio Cestari
4.5 (2)
Santa Donchian Indicator  is an efficient way to detect support, resistence and break outs in any market. The Donchian channel measures the high and the low of a previously defined range.  Typically, a trader would look for a well-defined range and then wait for the price to break out to either one side for a trade entry trigger. Advantages Never repaints, never backpaints, never recalculates. Works in all symbols and all timeframes. Perfect trend filter for any strategy or expert advisor. Full
FREE
The   Three White Soldiers candlestick pattern   is formed by three candles. Here’s how to identify the Three White Soldiers candlestick pattern: Three consecutive bullish candles The bodies should be big The wicks should be small or non-existent This 3-candle bullish candlestick pattern is a reversal pattern, meaning that it’s used to find bottoms. For this reason, we want to see this pattern after a move to the downside, showing that bulls are starting to take control. When a Three White Soldi
FREE
Free automatic Fibonacci is an indicator that automatically plots a Fibonacci retracement based on the number of bars you select on the BarsToScan setting in the indicator. The Fibonacci is automatically updated in real time as new highest and lowest values appears amongst the selected bars. You can select which level values to be displayed in the indicator settings. You can also select the color of the levels thus enabling the trader to be able to attach the indicator several times with differe
FREE
The indicator highlights the points that a professional trader sees in ordinary indicators. VisualVol visually displays different volatility indicators on a single scale and a common align. Highlights the excess of volume indicators in color. At the same time, Tick and Real Volume, Actual range, ATR, candle size and return (open-close difference) can be displayed. Thanks to VisualVol, you will see the market periods and the right time for different trading operations. This version is intended f
FREE
Super Trend Alert Indicator for MT5 is a powerful tool designed to help traders identify and follow market trends with precision. This indicator uses a proprietary algorithm to analyze price movements and provide clear trend signals, making it suitable for traders across all experience levels. You can find the MT4 version here Key features of the Super Trend Indicator include: Advanced trend analysis with real-time market scanning to detect potential trend directions. Real-time alerts that not
FREE
QuantumAlert RSI Navigator is a free indicator available for MT4/MT5 platforms, its work is to provide "alerts" when the market is inside "overbought and oversold" regions in the form of "buy or sell" signals. This indicator comes with many customization options mentioned in the parameter section below, user can customise these parameters as needful. Join our MQL5 group , where we share important news and updates. You are also welcome to join our private channel as well, contact me for the priva
FREE
Wave Box Market Frenquency
Jean Jacques Huve Ribeiro
4.75 (4)
Totally linked to the result of a movement and the duration he had. Its height records how many ticks the asset walked during a given movement, its width shows us the duration that movement had. Its configuration must be in line with the Weis Wave Indicator configuration to observe the movement force and can indicate a possible accumulation or distribution of the movement;
FREE
Virtual Targets MT5
Hoang Van Dien
4.57 (7)
This indicator is very useful for day traders or short term traders. (MT5 version) No need to calculate the number of pips manually, just look at the chart and you will see the Virtual Take Profit / Virtual Stop Loss target line and evaluate whether the entry point is feasible to reach the intended target or not. Enter the intended   Take Profit / Stop Loss   pips for your trade. The indicator will display   Virtual Take Profit / Virtual Stop Loss   lines for you to easily see if the target is
FREE
Follow The Line MT5
Oliver Gideon Amofa Appiah
4.55 (31)
This indicator obeys the popular maxim that: "THE TREND IS YOUR FRIEND" It paints a GREEN line for BUY and also paints a RED line for SELL. (you can change the colors). It gives alarms and alerts of all kinds. IT DOES NOT REPAINT and can be used for all currency pairs and timeframes. Yes, as easy and simple as that. Even a newbie can use it to make great and reliable trades. NB: For best results, get my other premium indicators for more powerful and reliable signals. Get them here: https://www.m
FREE
Super Trend eu
Emin Ulucanli
4.75 (4)
SUPERTREND; It is a trend following indicator based on the SuperTrend ATR created by Olivier Seban. It can be used to detect changes in trend direction and locate stops. When the price falls below the indicator curve, it turns red and indicates a downtrend. Conversely, when the price moves above the curve, the indicator turns green, indicating an uptrend. Like other indicators, it works well on SuperTrend when used in conjunction with other indicators such as MACD, parabolik SAR, Bollinger Band
FREE
Pivot Point Fibo RSJ is an indicator that traces the support and resistance lines of the day using Fibonacci rates. This spectacular indicator creates up to 7 levels of support and resistance through Pivot Point using Fibonacci rates. It is fantastic how the prices respect each level of this support and resistance, where it is possible to perceive possible entry/exit points of an operation. Features Up to 7 levels of support and 7 levels of resistance Set the colors of the levels individually
FREE
The indicator   "Haven Key Levels PDH PDL"   helps traders visualize key levels on the chart. It automatically marks the following levels: DO (Daily Open)   — the daily open level. NYM (New York Midnight)   — the New York midnight level. PDH (Previous Day High)   — the previous day's high. PDL (Previous Day Low)   — the previous day's low. WO (Weekly Open)   — the weekly open level. MO (Monthly Open)   — the monthly open level. PWH (Previous Week High)   — the previous week's high. PWL (Previou
FREE
Forex Indicator Arrows
NGUYEN NGHIEM DUY
1 (1)
Forex Indicator Arrows is an arrow Indicator used as an assistant tool for your trading strategy. The indicator analyzes the standard deviation of bar close for a given period and generates a buy or sell signals if the deviation increases. It good to combo with Martingale EA to follow Trend and Sellect Buy Only/Sell Only for EA work Semi-Automatic. You can use this  Indicator with any EAs in my Products.
FREE
Indicator and Expert Adviser  EA Available in the comments section of this product. Download with Indicator must have indicator installed for EA to work. Mt5 indicator alerts for bollinger band and envelope extremes occurring at the same time. Buy signal alerts occur when A bullish candle has formed below both the lower bollinger band and the lower envelope  Bar must open and close below both these indicators. Sell signal occur when A bear bar is formed above the upper bollinger band and upper
FREE
Tabajara V5
Flavio Javier Jarabeck
4.85 (33)
Metatrader 5 version of the famous Andre Machado's Tabajara indicator. If you don't know Andre Machado's Technical Analysis work you don't need this indicator... For those who need it and for those several friend traders who asked this porting from other platforms, here it is... FEATURES 8-period Moving Average 20-period Moving Average 50-period Moving Average 200-period Moving Average Colored candles according to the inflexion of the 20-period MA SETTINGS You can change the Period of all MA's
FREE
The 3 Bar Break
Stephen Reynolds
Three Bar Break is based on one of Linda Bradford Raschke's trading methods that I have noticed is good at spotting potential future price volatility. It looks for when the 1st bar's High is less than the 3rd bar's High as well as the 1st bar's Low to be higher than the 3rd bar's Low. This then predicts the market might breakout to new levels within 2-3 of the next coming bars. It should be used mainly on the daily chart to help spot potential moves in the coming days. Features : A simple meth
FREE
Moving line
Jun Chao Jiang
The one minute chart has a bug, but the one-day chart can still be used after deleting the bug and reloading the indicators, This indicator can be used to determine how far the indicator goes up to place an order to buy, how far it goes down to place an order to sell, and not placing an order until it reaches this distance, which is considered oscillation, open an account gift index
FREE
Buyers of this product also purchase
Trend Screener Pro MT5
STE S.S.COMPANY
4.89 (72)
Unlock the Power of Trends Trading with the Trend Screener Indicator: Your Ultimate Trend Trading Solution powered by Fuzzy Logic and Multi-Currencies System! Elevate your trading game with the Trend Screener, the revolutionary trend indicator designed to transform your Metatrader into a powerful Trend Analyzer. This comprehensive tool leverages fuzzy logic and integrates over 13 premium features and three trading strategies, offering unmatched precision and versatility. LIMITED TIME OFFER : Tre
FX Volume MT5
Daniel Stein
4.72 (18)
FX Volume: Experience Genuine Market Sentiment from a Broker’s Perspective Quick Overview Looking to elevate your trading approach? FX Volume provides real-time insights into how retail traders and brokers are positioned—long before delayed reports like the COT. Whether you’re aiming for consistent gains or simply want a deeper edge in the markets, FX Volume helps you spot major imbalances, confirm breakouts, and refine your risk management. Get started now and see how genuine volume data can
Golden Trend Indicator MT5
Noha Mohamed Fathy Younes Badr
4.86 (14)
Golden Trend indicator  is The best indicator for predicting trend movement this indicator never lags and never repaints and never back paints    and give  arrow buy and sell    before the candle appear  and it will help you and  will make your trading decisions clearer its work on all currencies and  gold and crypto and all time frame This unique  indicator uses very secret algorithms to catch the  trends, so you can trade using this indicator and see the trend clear on charts  manual guide and
FX Power MT5 NG
Daniel Stein
5 (10)
FX Power: Analyze Currency Strength for Smarter Trading Decisions Overview FX Power is your go-to tool for understanding the real strength of currencies and Gold in any market condition. By identifying strong currencies to buy and weak ones to sell, FX Power simplifies trading decisions and uncovers high-probability opportunities. Whether you’re looking to follow trends or anticipate reversals using extreme delta values, this tool adapts seamlessly to your trading style. Don’t just trade—trade
IX Power MT5
Daniel Stein
4.83 (6)
IX Power: Unlock Market Insights for Indices, Commodities, Cryptos, and Forex Overview IX Power is a versatile tool designed to analyze the strength of indices, commodities, cryptocurrencies, and forex symbols. While FX Power offers the highest precision for forex pairs by leveraging all available currency pair data, IX Power focuses exclusively on the underlying symbol’s market data. This makes IX Power an excellent choice for non-forex markets and a reliable option for forex charts when deta
FX Levels MT5
Daniel Stein
5 (2)
FX Levels: Exceptionally Accurate Support & Resistance for All Markets Quick Overview Looking for a reliable way to pinpoint support and resistance levels across any market—currencies, indices, stocks, or commodities? FX Levels merges our traditional “Lighthouse” method with a forward-thinking dynamic approach, offering near-universal accuracy. By drawing from real-world broker experience and automated daily plus real-time updates, FX Levels helps you identify reversal points, set profit targe
TPSpro RFI Levels MT5
Roman Podpora
4.53 (19)
A key element in trading is zones or levels from which decisions to buy or sell a trading instrument are made. Despite attempts by major players to conceal their presence in the market, they inevitably leave traces. Our task was to learn how to identify these traces and interpret them correctly. ИНСТРУКЦИЯ RUS         INSTRUCTIONS  ENG         R ecommended to use with an indicator   -   TPSpro  TREND PRO -  Version MT4 Bonus: 6 months of  "RFI SIGNALS"  subscription with your purchase! Main
TPSproTREND PrO MT5
Roman Podpora
4.47 (17)
TPSpro TREND PRO  - is a trend indicator that automatically analyzes the market and provides information about the trend and each of its changes, as well as giving signals for entering trades without redrawing! The indicator uses each candle, analyzing them separately. referring to different impulses - up or down impulse. Exact entry points into transactions for currencies, crypto, metals, stocks, indices!  ИНСТРУКЦИЯ RUS         INSTRUCTIONS  ENG       R ecommended to use with an indicator   -
Quantum TrendPulse
Bogdan Ion Puscasu
5 (12)
Introducing Quantum TrendPulse , the ultimate trading tool that combines the power of SuperTrend , RSI , and Stochastic into one comprehensive indicator to maximize your trading potential. Designed for traders who seek precision and efficiency, this indicator helps you identify market trends, momentum shifts, and optimal entry and exit points with confidence. Key Features: SuperTrend Integration: Easily follow the prevailing market trend and ride the wave of profitability. RSI Precision: Detect
Support And Resistance Screener Breakthrough unique Solution With All Important levels analyzer and Markets Structures Feature Built Inside One Tool ! Our indicator has been developed by traders for traders and with one Indicator you will find all Imporant market levels with one click. LIMITED TIME OFFER : Support and Resistance Screener Indicator is available for only 50 $ and lifetime. ( Original price 125$ ) (offer extended) The available tools ( Features ) in our Indicator are :  1. HH-LL S
RelicusRoad Pro MT5
Relicus LLC
4.78 (18)
How many times have you bought a trading indicator with great back-tests, live account performance proof with fantastic numbers and stats all over the place but after using it, you end up blowing your account? You shouldn't trust a signal by itself, you need to know why it appeared in the first place, and that's what RelicusRoad Pro does best! User Manual + Strategies + Training Videos + Private Group with VIP Access + Mobile Version Available A New Way To Look At The Market RelicusRoad is th
Gold Stuff mt5
Vasiliy Strukov
4.92 (173)
Gold Stuff mt5 is a trend indicator designed specifically for gold and can also be used on any financial instrument. The indicator does not redraw and does not lag. Recommended time frame H1. Contact me immediately after the purchase to get   personal bonus!  You can get a free copy of our Strong Support and Trend Scanner indicator, please pm. me! Settings  and manual   here  Please note that I do not sell my EA's or special sets on telegram, it is only available on Mql5 and my set files are on
Bill Williams Advanced
Siarhei Vashchylka
5 (10)
Bill Williams Advanced is designed for automatic chart analysis using Bill Williams' "Profitunity" system. The indicator analyzes four timeframes at once. Manual (Be sure to read before purchasing) Advantages 1. Automatically analyzes the chart using the "Profitunity" system of Bill Williams. The found signals are placed in a table in the corner of the screen. 2. Equipped with a trend filter based on the Alligator indicator. Most of the system signals are recommended to be used only according t
This dashboard shows the latest available   harmonic patterns   for the selected symbols, so you will save time and be more efficient /   MT4 version . Free Indicator:   Basic Harmonic Pattern Comparison of "Basic Harmonic Pattern" vs. "Basic Harmonic Patterns Dashboard" Indicators Feature Basic Harmonic Pattern Basic Harmonic Patterns Dashboard Functionality Detects and displays harmonic patterns on a single chart Searches multiple symbols and timeframes for harmonic patterns, displays res
Matrix Arrow Indicator MT5
Juvenille Emperor Limited
5 (13)
Matrix Arrow Indicator MT5  is a unique 10 in 1 trend following   100% non-repainting  multi-timeframe indicator that can be used on all symbols/instruments:   forex,   commodities,   cryptocurrencies,   indices,   stocks .  Matrix Arrow Indicator MT5  will determine the current trend at its early stages, gathering information and data from up to 10 standard indicators, which are: Average Directional Movement Index (ADX) Commodity Channel Index (CCI) Classic Heiken Ashi candles Moving Average
First of all Its worth emphasizing here that this Trading Tool is Non Repainting , Non Redrawing and Non Lagging Indicator , Which makes it ideal for professional trading . Online course, user manual and demo. The Smart Price Action Concepts Indicator is a very powerful tool for both new and experienced traders . It packs more than 20 useful indicators into one , combining advanced trading ideas like Inner Circle Trader Analysis and Smart Money Concepts Trading Strategies . This indicator focus
FX Dynamic: Track Volatility and Trends with Customized ATR Analysis Overview FX Dynamic is a powerful tool that leverages Average True Range (ATR) calculations to give traders unparalleled insights into daily and intraday volatility. By setting up clear volatility thresholds—such as 80%, 100%, and 130%—you can quickly identify potential profit opportunities or warnings when markets exceed typical ranges. FX Dynamic adapts to your broker’s time zone, helps you maintain a consistent measure of
Introducing   Quantum Breakout PRO , the groundbreaking MQL5 Indicator that's transforming the way you trade Breakout Zones! Developed by a team of experienced traders with trading experience of over 13 years,   Quantum Breakout PRO   is designed to propel your trading journey to new heights with its innovative and dynamic breakout zone strategy. Quantum Breakout Indicator will give you signal arrows on breakout zones with 5 profit target zones and stop loss suggestion based on the breakout b
Black Dragon indicator mt5
Ramil Minniakhmetov
4.83 (58)
The trend detection indicator will compliment any strategy and can also be used as an independent tool. Be careful i not sell EA or sets at telegram it scam. All settings free here at   blog .  IMPORTANT! Contact me immediately after the purchase to get instructions and a bonus!  Benefits  Easy to use; does not overload the graphic wih unnecessary information. The ability to use as filter for any strategy. Contains bult -in dynamic levels of cupport and resistange,  which can be used both, for p
Top indicator for MT5   providing accurate signals to enter a trade without repainting! It can be applied to any financial assets:   forex, cryptocurrencies, metals, stocks, indices .  Watch  the video  (6:22) with an example of processing only one signal that paid off the indicator! MT4 version is here It will provide pretty accurate trading signals and tell you when it's best to open a trade and close it. Most traders improve their trading results during the first trading week with the help of
First of all Its worth emphasizing here that this Trading System is Non-Repainting   , Non Redrawing and Non Lagging Indicator Which makes it ideal from both manual and robot trading .  Online course, manual and download presets. The Smart Trend Trading System MT5 is a comprehensive trading solution tailored for new and experienced traders . It combines over 10 premium indicators and features more than 7 robust trading strategies , making it a versatile choice for diverse market conditions . Tre
Easy Breakout MT5
Mohamed Hassan
5 (3)
After your purchase, feel free to contact me for more details on how to receive a bonus indicator called VFI, which pairs perfectly with Easy Breakout for enhanced confluence!     Easy Breakout MT5   is a powerful price action trading system built on one of the most popular and widely trusted strategies among traders: the   Breakout strategy ! This indicator delivers crystal-clear Buy and Sell signals based on breakouts from key support and resistance zones. Unlike typical breakout indicators
Gartley Hunter Multi
Siarhei Vashchylka
5 (10)
Gartley Hunter Multi - An indicator for searching for harmonic patterns simultaneously on dozens of trading instruments and on all possible timeframes. Manual (Be sure to read before purchasing) | Version for MT4 Advantages 1. Patterns: Gartley, Butterfly, Shark, Crab. Bat, Alternate Bat, Deep Crab, Cypher 2. Simultaneous search for patterns on dozens of trading instruments and on all possible timeframes 3. Search for patterns of all possible sizes. From the smallest to the largest 4. All fou
Trend Line Map Pro MT5
STE S.S.COMPANY
4.09 (11)
Trend Line Map indicator is an addons for   Trend Screener Indicator . It's working as a scanner for all signals generated by Trend screener ( Trend Line Signals ) . It's a Trend Line Scanner based on Trend Screener Indicator.  If you don't have Trend Screener Pro Indicator,   the Trend Line Map Pro will not work.     LIMITED TIME OFFER : Trend Line Map Indicator is available for only 50 $ and lifetime. ( Original price 125$ ) By accessing to our MQL5 Blog,  you can find all our premium indicat
Trade smarter, not harder: Empower your trading with Harmonacci Patterns Special Offer: Purchase now to receive free bonuses worth $165! (Read more for details) This is arguably the most complete harmonic price formation auto-recognition indicator you can find for the MetaTrader Platform. It detects 19 different patterns, takes fibonacci projections as seriously as you do, displays the Potential Reversal Zone (PRZ) and finds suitable stop-loss and take-profit levels. [ Installation Guide | Upd
This dashboard discovers and displays the  Supply  and  Demand  zones on the chart, both in scalping and long term mode, depending on your trading strategy for the selected symbols. In addition, the scanner mode of the dashboard helps you to check all desired symbols at a glance and not to miss any suitable positions /   MT4 version Free indicator:   Basic Supply Demand Features Allows you to view trading opportunities on   multiple currency pairs , giving you a clear and concise view of all p
QM Pattern Scanner MT5
Reza Aghajanpour
5 (3)
Contact me  to send you instruction and add you in group. QM (Quasimodo) Pattern is based on Read The Market(RTM) concepts. The purpose of this model is to face the big players of the market (financial institutions and banks), As you know in financial markets, big traders try to fool small traders, but RTM prevent traders from getting trapped. This style is formed in terms of price candles and presented according to market supply and demand areas and no price oscillator is used in it. RTM conc
Volumatic VIDyA MT5
Duc Hoan Nguyen
5 (1)
Special offer : ALL TOOLS , just $35 each! New tools   will be   $30   for the   first week   or the   first 3 purchases !  Trading Tools Channel on MQL5 : Join my MQL5 channel to update the latest news from me Volumatic VIDYA (Variable Index Dynamic Average) is an advanced indicator designed to track trends and analyze buy-sell pressure within each phase of a trend. By utilizing the Variable Index Dynamic Average as a core dynamic smoothing technique, this tool provides critical insights into
Auto Order Block with break of structure based on ICT and Smart Money Concepts (SMC) Futures Break of Structure ( BoS )             Order block ( OB )            Higher time frame Order block / Point of Interest ( POI )    shown on current chart           Fair value Gap ( FVG ) / Imbalance   -  MTF      ( Multi Time Frame )    HH/LL/HL/LH  -  MTF      ( Multi Time Frame )  Choch  MTF      ( Multi Time Frame )  Volume Imbalance     ,  MTF          vIMB Gap’s Power of 3 Equal High / Low’s  
Dark Absolute Trend   is an Indicator for intraday trading. This Indicator is based on   Trend Following  strategy but use also candlestick patterns and Volatility. We can enter in good price with this Indicator, in order to follow the main trend on the current instrument. It is advised to use low spread ECN brokers. This Indicator does   Not repaint   and   N ot lag . Recommended timeframes are M5, M15 and H1. Recommended working pairs: All. I nstallation and  Update Guide   -  Troubleshooting
More from author
Supports And Resistances Lines
Francisco Gomes Da Silva
4.76 (37)
Support and Resistance zones Indicator MT5 this indicator knows how to identify tops and bottoms automaticly. This support and resistance indicator creates support lines and resistance lines based on tops and bottoms. how to make support and resistance lines. this is an indicator to make automatic support and resistance lines. how to find support level with indicator. this indicator finds tops and bottoms automaticly. The Indicator automatically creates support lines every time “Fractals” create
FREE
Sweet VWAP Aux
Francisco Gomes Da Silva
4.4 (5)
Save time and make more informed decisions with Sweet VWAP Aux If you haven't already downloaded our free VWAP indicator for Metatrader 4 , do it now and experience its incredible capabilities for visualizing anchored vwap. Then come back here and get to know Sweet VWAP Aux - the perfect extension for your Sweet VWAP indicator. With just one click, Sweet VWAP allows you to anchor the VWAP indicator at the point of your choice, saving time and eliminating the need to set it up manually. In additi
Sweet VWAP Anchored MT5
Francisco Gomes Da Silva
5 (6)
Save time and make more accurate decisions with Anchored VWAPs If you want to test the power of this tool, you can download the free Anchored VWAPs indicator for MT5 . In addition to this indicator working independently, it is also an extension for the free Sweet VWAP version. This is because when you click in the free version, the VWAP you see at the mouse pointer will be anchored. And for better understanding, what will be anchored there is this indicator, with all its functionalities. This in
Auto Anchored VWAPs MT4
Francisco Gomes Da Silva
Unveil Trading Insights with Auto Anchored VWAPs: Auto Anchored VWAPs serve as your guiding companion in the world of trading. These indicators pinpoint crucial market turning points and illustrate them on your chart using VWAP lines. This is a game-changer for traders who employ anchored VWAP strategies. How Does It Work? Identifying High Points: If the highest price of the current candle is lower than the highest price of the previous one, And the previous high is higher than the one before it
VWAP With Alerts
Francisco Gomes Da Silva
5 (4)
This VWAP is a simple VWAP, but we have added alerts to let you know when the price touches the simple VWAP or when the price crosses the VWAP. This indicator is a traditional VWAP indicator for MetaTrader 5 (MT5). The default parameters are those of the normal VWAP, but you have the ability to use new calculations and the best part: When the price touches or crosses the VWAP, you will be notified through alerts, mobile notifications, email, or sound events. Free anchored VWAP indicator for MT5
FREE
Paula Bollinger Bands
Francisco Gomes Da Silva
4.17 (6)
Transform your investment strategy with the Expert Advisor for MetaTrader investor robot. Based on the powerful Bollinger Bands strategy, created by Joe Ross and dubbed Paula by renowned Brazilian trader Rodrigo Cohen, you will have access to advanced technology that will maximize your profits and minimize your risks. Don't waste any more time with old and inefficient strategies. With our investor robot, you will have access to a highly accurate algorithm that combines technical analysis of ma
FREE
Bar Number
Francisco Gomes Da Silva
5 (5)
Candle counter This indicator counts and identifies candles based on a longer time frame Bigger Timeframe You can choose the daily timeframe as " Bigger Timeframe ", and run it within any smaller chart. that it will count the bars based on the daily chart . If you pass as a parameter the timeframe " H1 " then the indicator will know how to count the bars inside the H1 chart you just need to run it on smaller charts. The main parameter is the " Bigger Timeframe " which is a larger timeframe than
FREE
Rule Plotter Expert
Francisco Gomes Da Silva
5 (5)
This Expert Advisor has been designed to test and execute your strategies created within the Rule Plotter indicator. How to use: Download the indicator Rule Plotter - a tool for creating trading systems without the need for programming . Next, develop your strategies within the Rule Plotter indicator. Finally, execute your created strategies using this Expert Advisor. Parameters: Strategy: Your trading system created within the Rule Plotter indicator, allowing you to test and execute your custom
FREE
Supports And Resistances Lines MTF MT4
Francisco Gomes Da Silva
4.88 (8)
Supports and Resistances, was created to help you identify tops and bottoms automatically on several different timeframes and thus plot these tops and bottoms on the current chart. Let's go to the explanation of the creation of resistances There is a rule field, which you can define what is a top and bottom the top rule is set by default like this: H[ 0 ]<=H[ 1 ] and H[ 1 ]=>H[ 2 ] Where: Element Description H  means   High [0]  means   current   candle [1]  means   previous   candle <=  mean
FREE
Rule Plotter
Francisco Gomes Da Silva
5 (6)
Build Your Strategy Yourself This tool allows you to develop your strategies using all the indicators available natively in MetaTrader and any indicators downloaded from the internet that use buffers to display data on the screen. This tool is another reason for you to consider MetaTrader to automate your trading strategies. With it, you can create your own strategy signals in a simple and intuitive way, using any MetaTrader indicator. How Do I Know If My Internet-Downloaded Indicator Uses Buffe
FREE
VWAP With Alerts MT4
Francisco Gomes Da Silva
5 (2)
This VWAP is a simple VWAP, but we've incorporated notifications that inform you when the price hits or crosses the VWAP line. This indicator is a traditional VWAP indicator for MetaTrader 4 (MT4). The default parameters are those of the normal VWAP, but you have the ability to modify the VWAP calculation, and the best part: When the price touches or crosses the VWAP, you will be notified through alerts, mobile notifications, email, or sound events. Anchored VWAP indicator for MT4 . Parameters:
FREE
OHLC Shifted
Francisco Gomes Da Silva
4.67 (3)
Previous Day's Close and Bar Shift Indicator for MetaTrader! The Previous Day's Close and Bar Shift Indicator is a tool designed to enhance technical analysis and decision-making in trading. With this indicator, you will have access to detailed information about the opening, high, low, and closing levels of any bar, allowing for precise and comprehensive analysis of market movements. Imagine having the ability to nest one timeframe within another, enabling detailed analysis of each bar across di
FREE
My Candle
Francisco Gomes Da Silva
5 (1)
Define your own candlestick pattern and this indicator will show on the screen when this pattern appears You can test it for free in the Strategy Tester and see how many times your candlestick pattern appears on the asset of your choice You can also paint all candles of your pattern or just one This indicator is useful for candlestick analysis, for you to use in price action and with naked trade strategies. It is an indicator that shows the movement you choose How to Use the Indicators: AC AC[1
FREE
Bar Counter MT4
Francisco Gomes Da Silva
5 (5)
candlestick counter indicator this indicator counts candles that are on the chart of any timeframe a free bar counter for you to download on mt4 the candlestick counter counts how many candles there are inside a larger chart with this candle counter you can do the automatic candlestick count free candlestick count indicator for you to download and count bars automatically bar counter to count the bars count candle counter indicator mt4 count candle bar counter for MT5 If you are interested in th
FREE
Fibonacci on ZigZag
Francisco Gomes Da Silva
4.91 (11)
Mouse You can draw fibonaccis moving the mouse over the zigzag indicator Pin them You can click on fibonacci with this option and it will no longer be deleted unless you click on it again :) Precision The tuned fibonacci gets the precise point in lower timeframes Enjoy it You can ask me for add more features, so please comment and leave your ranting for me to be happy, thank you :)
FREE
OHLC Shifted MT4
Francisco Gomes Da Silva
5 (2)
Previous Day's Close and Bar Shift Indicator for MetaTrader! The Previous Day's Close and Bar Shift Indicator is a tool designed to enhance technical analysis and decision-making in trading. With this indicator, you will have access to detailed information about the opening, high, low, and closing levels of any bar, allowing for precise and comprehensive analysis of market movements. Imagine having the ability to nest one timeframe within another, enabling detailed analysis of each bar across di
FREE
Rule Plotter Expert MT4
Francisco Gomes Da Silva
5 (1)
Trading Your Strategies Created with Rule Plotter Indicator with Rule Plotter Expert: Now that you have created your custom strategies using the Rule Plotter Indicator and visualized the arrows indicating entry and exit points on the chart, it's time to bring these strategies to life in the financial markets. With the Rule Plotter Expert, you can trade autonomously and accurately based on these arrows, making the most of the potential of your strategies Turning Arrows into Actions: The arrows ge
FREE
First Bar
Francisco Gomes Da Silva
Trade System You choose a bar on the day to trade, when this bar closes the robot will send two orders a at the high other at the low of the candle, which gets again the other will be canceled Stop the stop will be one tick under the low on case of the buy, or one tick above the high on case of the sell Take The take can be setted how much you wants of the stop range, it can be costumized in the strategy otimization Otimization This robot have the input to get risck return, so you can run int in
FREE
Rule Plotter MT4
Francisco Gomes Da Silva
4 (3)
How to Create an Automated Trading Robot Have you ever wondered how powerful it would be to automate your trading strategies with just a few clicks of the mouse? Imagine having the freedom to create and test different trading strategies without the need to dive into complicated code. With Rule Plotter, this vision becomes a reality. Here we will explore how you can create your own custom trading robot using Rule Plotter, a trade-system creation tool that simplifies the entire process. What is Ru
FREE
Paula Bollinger Bands Strategy
Francisco Gomes Da Silva
4 (2)
Bollinger bands out/in strategy A strategy created by Joe Ross, and very useful for finding trades when the market is overloaded. Indicator You don't need to find where there are entries on the chart, this indicator shows them for you. The entrance The trade is confirmed when the price closes outside the bollinger bands on a candle and the candle after the price closes inside the bands. comment I want to improve this indicator, so you can help me sending me your reviews and comments, thanks :).
FREE
My Candle Patterns
Francisco Gomes Da Silva
5 (1)
This indicator is a demo version of the complete My candle, which can be downloaded here: Candle Patterns Creator With the full version, you can create your own candle rules and modify a traditional candle pattern to be more accurate according to your strategy. The indicator includes several example candle rules, but here I will demonstrate only a few: Pattern Rule Candle Green C > O Candle Red C < O Doji C = O Hammer (C > O and (C-O) *2 < O-L and (C-O) *0.5 > H-C) or (C < O and (O-C) *2 < C-L a
FREE
Hide Scale
Francisco Gomes Da Silva
Hide Scale - Tool for Traders Who Want More Screen Space Instructions Press "T" to hide the time scale and "P" to hide the price scale. You can customize these keys by clicking the corresponding button and typing a new key on your keyboard. To hide both scales at the same time, you can assign the same key to both options. To show the scales again, simply press the corresponding key again. Why We Created This Tool We created this Hide Scale tool to help traders who use our Sweet VWAP indicator to
FREE
TrendPlator
Francisco Gomes Da Silva
TrendPlator: Empower Your Trading Strategies with an Advanced Trend Projection Indicator Explore the potential of our innovative indicator! With the ability to analyze and project trend lines from larger timeframes directly onto your current timeframe, it provides strategic support that catches the attention of traders across the board. These points become strategic levels of support or resistance for your trades, strengthening your trading strategy. Visualize the opportunity to add an indicator
Pattern Wizard
Francisco Gomes Da Silva
Patterns Wizard is a tool for creating candlestick patterns. With it, you can create various patterns and add as many instances of this indicator as you want on your chart, each with a different pattern. To better understand how creation formulas work, you can refer to the examples of the My Candle indicator, which has over 70 examples of candlestick patterns The main difference with this indicator is that it has 30 rule parameters , meaning you can set a different rule for each of the last 30 c
FREE
Pattern Wizard MT4
Francisco Gomes Da Silva
Patterns Wizard is a tool for creating candlestick patterns. With it, you can create various patterns and add as many instances of this indicator as you want on your chart, each with a different pattern. To better understand how creation formulas work, you can refer to the examples of the My Candle indicator, which has over 70 examples of candlestick patterns The main difference with this indicator is that it has 30 rule parameters , meaning you can set a different rule for each of the last 30 c
FREE
Hide Scale MT4
Francisco Gomes Da Silva
5 (4)
Hide Scale - The ideal tool for traders who want to maximize chart space How to use Hide Scale Press "T" to hide the time scale and "P" to hide the price scale. You can customize the keyboard shortcuts by clicking on the corresponding buttons and choosing a new key for each function. If you want to hide both scales at the same time, you can assign the same key to both options. To display the scales again, simply press the corresponding key again. The reason behind creating this tool We developed
FREE
Discover the Power of Risk Management with Price Action to Position Your Stop Loss! Have you ever experienced the situation where you know exactly when to enter a trade, but you're unsure about the right time to exit? Don't worry, you're not alone! Many traders face this challenge on a daily basis. The good news is that our price action-based risk management tool is here to solve this problem. While you focus on identifying the optimal entry points, our tool takes control and handles the trade e
Trailing on Last Top Bottom
Francisco Gomes Da Silva
5 (1)
This tool places stops on your positions Quickly test by Metatrade Strategy Tester. Your stop will be at the last bottom in case of a long position Or your stop will be at the last top in case of a short position Furthermore, this tool manages the trailing of your open positions. always place your stop at the last high formed or the last formed bottom to create the tops and bottoms I use the free indicator "Supports and Resistances Lines" which is available for download at this link: download
Trend Plator
Francisco Gomes Da Silva
TrendPlator: A Powerful Trend Projection Indicator for Optimized Trading Strategies Discover the power of our new indicator! With the ability to calculate trend lines from larger timeframes and project them directly onto your current timeframe, it provides strategic support that captures the attention of traders. These points become powerful support or resistance levels for your trades, boosting your trading strategy. Imagine having access to an indicator that seamlessly complements your collect
Auto Anchored VWAPs
Francisco Gomes Da Silva
Unveil Trading Insights with Auto Anchored VWAPs: Auto Anchored VWAPs serve as your guiding companion in the world of trading. These indicators pinpoint crucial market turning points and illustrate them on your chart using VWAP lines. This is a game-changer for traders who employ anchored VWAP strategies. How Does It Work? Identifying High Points: If the highest price of the current candle is lower than the highest price of the previous one, And the previous high is higher than the one before it
Filter:
No reviews
Reply to review
Version 1.25 2025.01.23
+ Auto Organize Panels
Version 1.24 2025.01.22
+ Allow more than one scanner on the chart.
- Fix critical bug when there is no symbol and no timeframe.
Version 1.23 2025.01.21
+ Do not show unused lines.
+ Fix critical error when the user disables all timeframes.
Version 1.22 2025.01.18
Seconds Parameter to Update the Panel
Version 1.21 2025.01.13
- Fixed bug in Windows 11 when switching charts
- Parameters for optimization in the strategy tester of robots created from this indicator
- Alerts allowed only when the line is completely in one color
- Alerts allowed only when the entire scanner is in a single color
Version 1.20 2024.08.22
+ Added Alerts, Notifications, and Sounds for the Scanner
+ Added the First() function in the Rule Plotter language
Version 1.14 2024.07.15
+ Fixed the bug that removed spaces from the names of indicators involved in logical operations using parentheses in AND/OR operations
Version 1.10 2024.07.06
When the timeframe box is clicked, we open a new chart for you to see where the Rule Plotter is marking the arrows.
Version 1.9 2024.03.10
- Prevent strategy zero from being filled with the default value
Version 1.7 2024.02.19
Compatibility with more indicators
Version 1.6 2023.12.15
+ Load timeframes for assets completely
Version 1.5 2023.12.12
+ Timeframes list
Version 1.4 2023.12.11
+ If you remove the symbls, this will save space on the panel.
Version 1.3 2023.12.10
+ Strategy using indicators
Version 1.2 2023.12.09
+ Red strategies if not yet created by the "Rule Plotter" indicator
Version 1.1 2023.12.08
Support for multi-strategies for the asset has been added via parameters.