Extremum levels
- Indicators
- VLADISLAV AKINDINOV
- Version: 2.0
- Updated: 12 January 2024
- Activations: 5
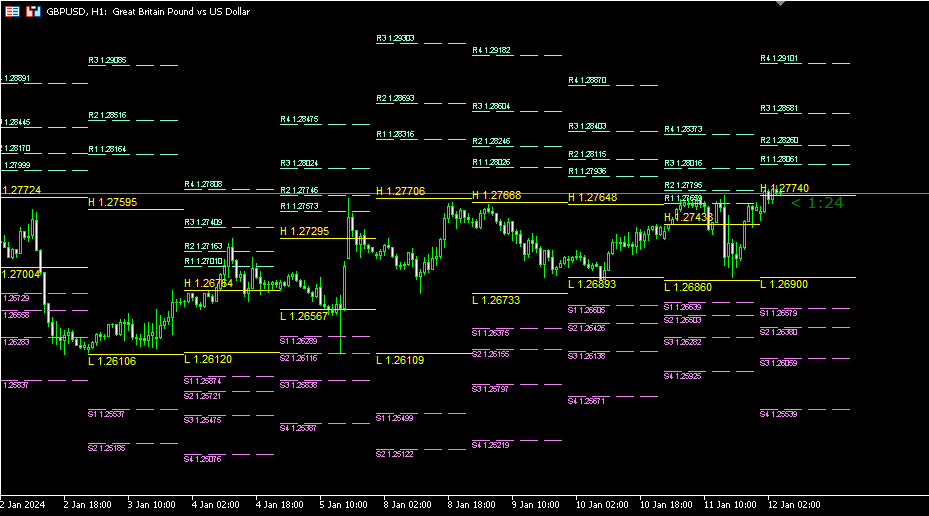
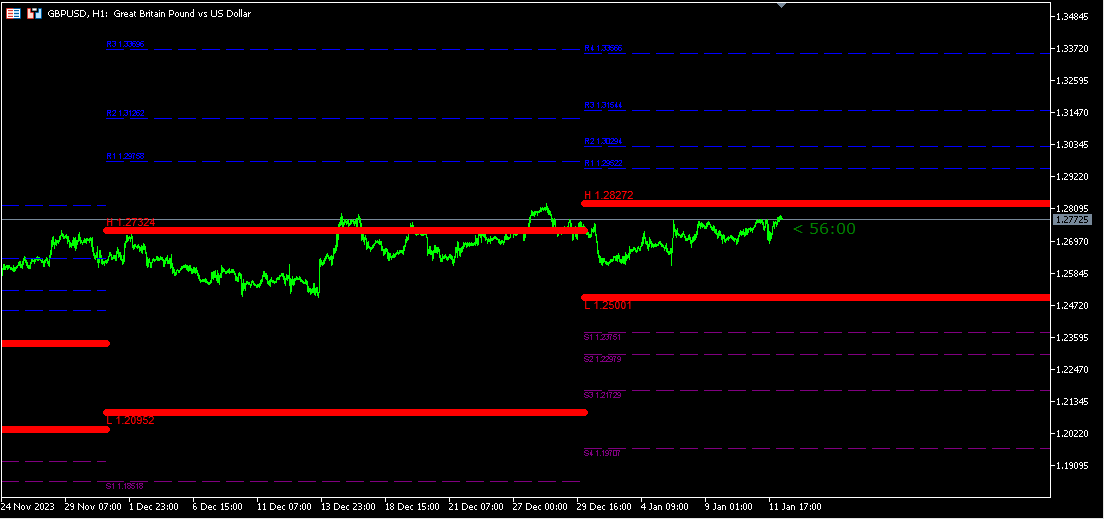
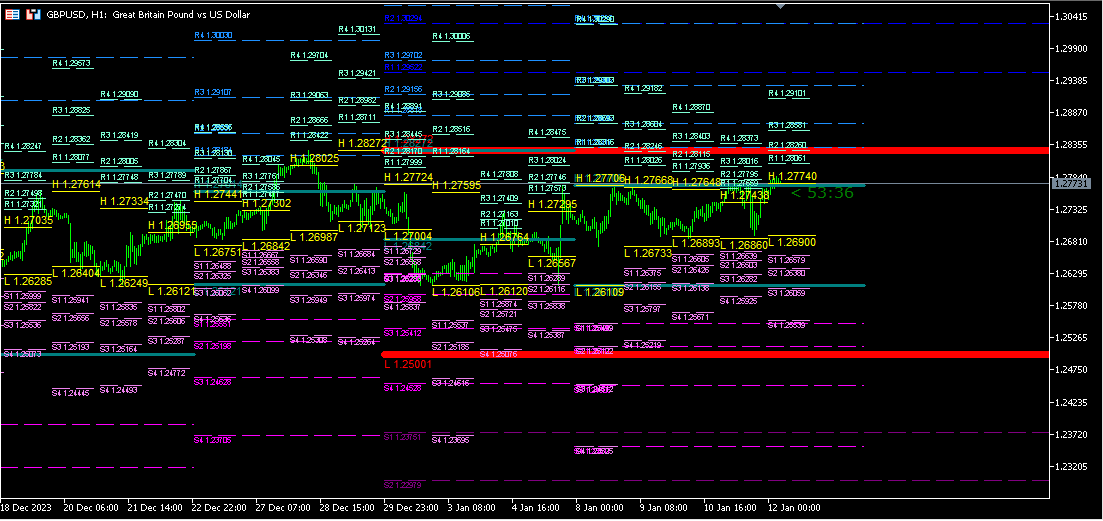
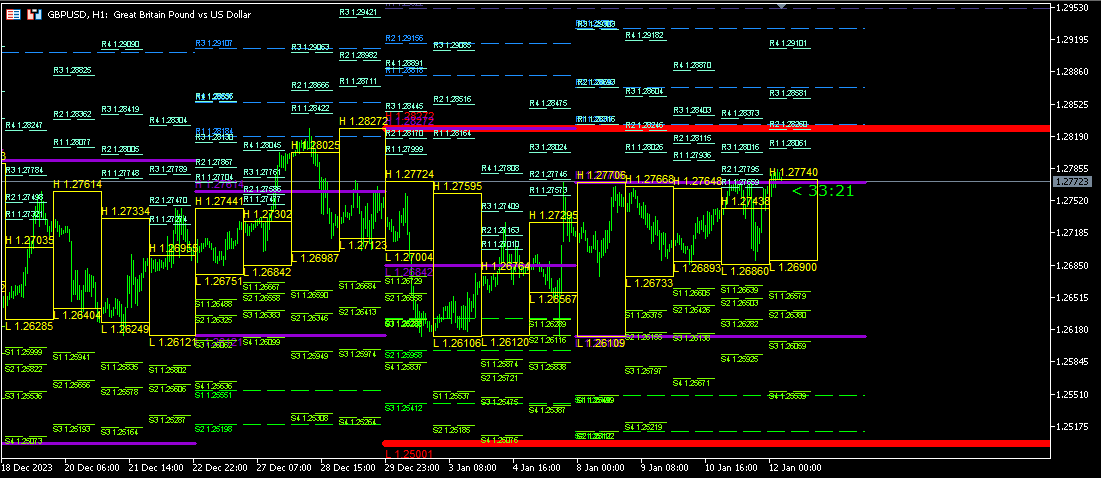
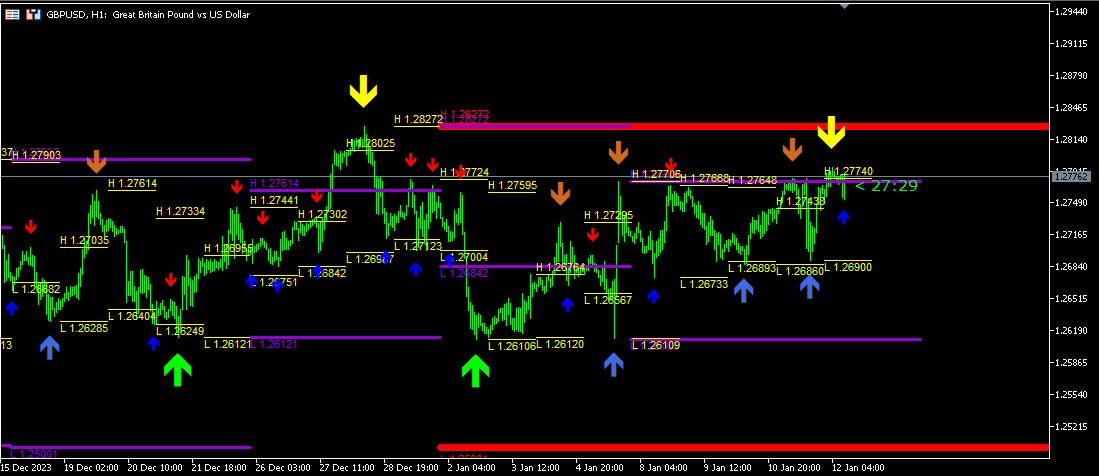
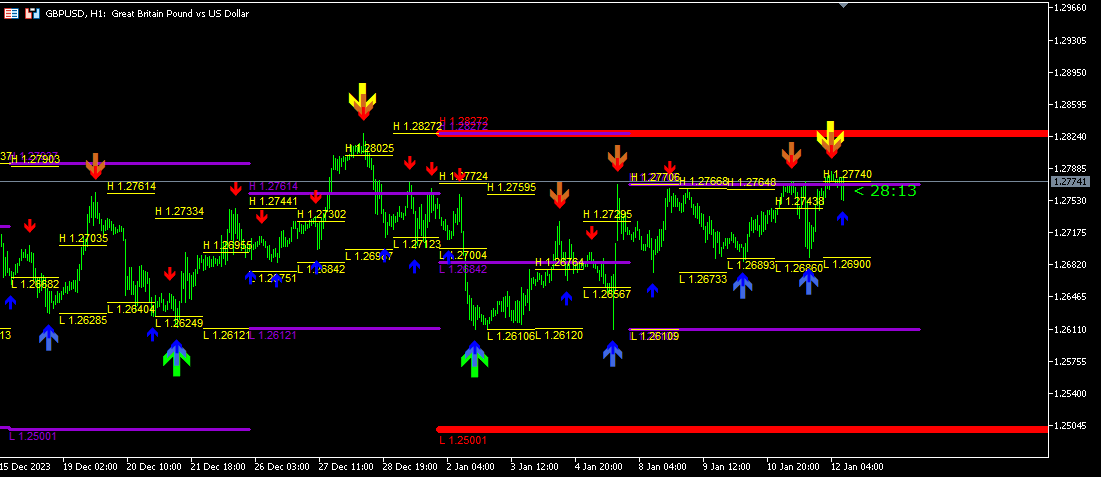
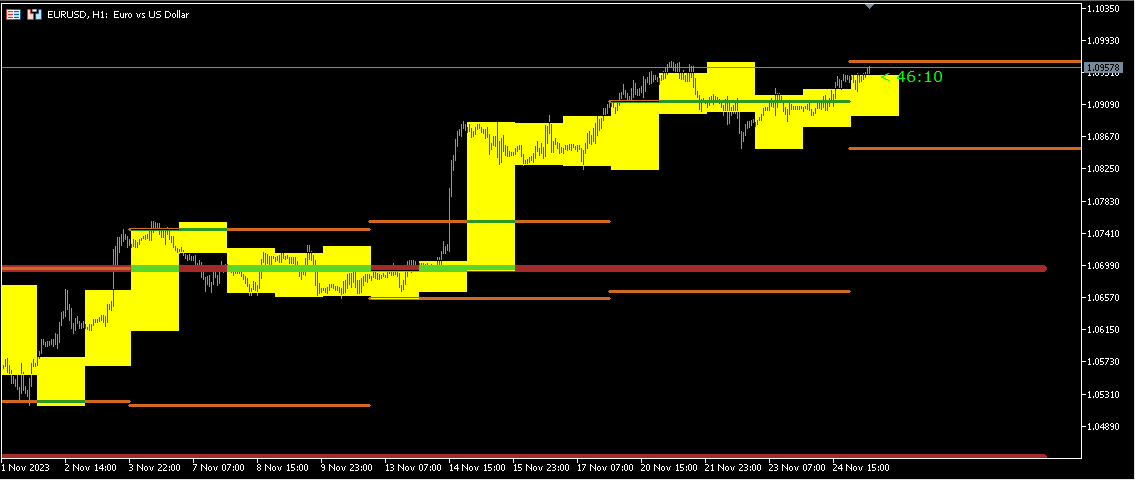
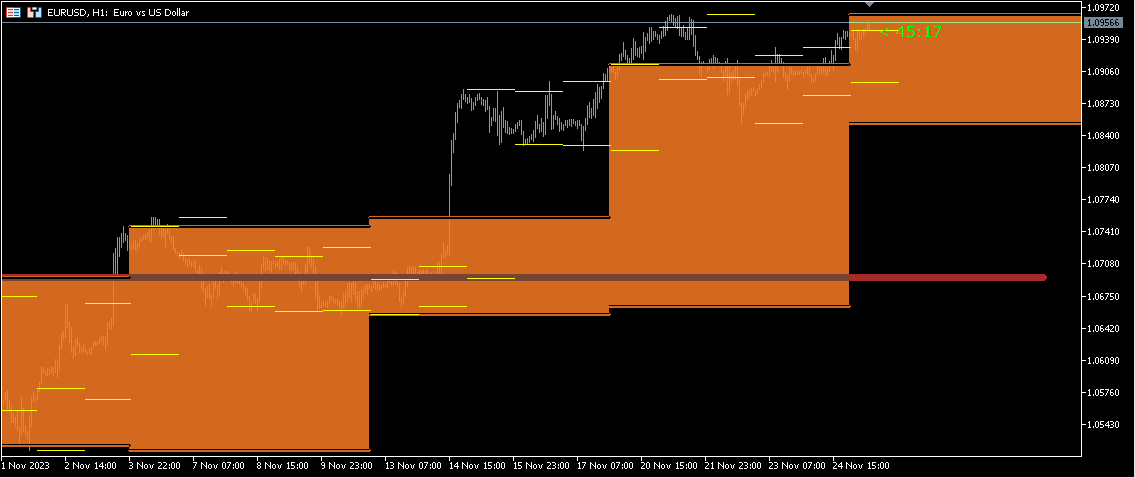
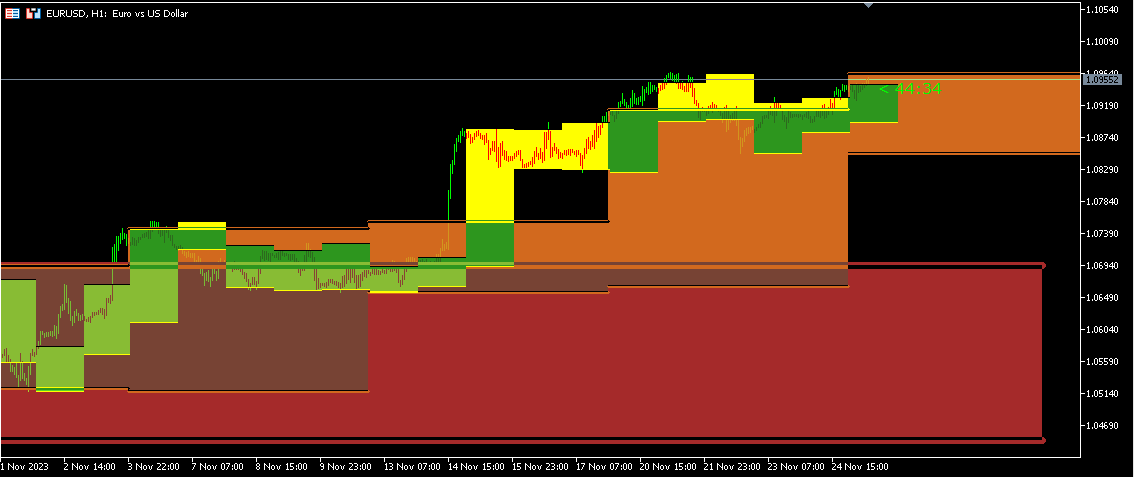
The indicator displays the High and Low levels of the previous day, week and month. Designed to determine the breakout of extreme points and determine the direction of entry into trading. To more accurately determine reversal levels, you can display Fibonacci levels. It is also possible to paint over the space between High and Low to more clearly display price movements for the previous billing period. There is an indication of the time until the current candle (bar) closes.
Version 2.0 added signals of 3 levels of reversal on a zigzag with alerts for each level.