Extender
- Indicators
- Petr Plechac
- Version: 1.3
- Updated: 22 November 2021
- Activations: 5
Extender represents a multifunctional indicator which can be used for own investing strategy or can be easily adopted as a part your own investing strategy. After installation as a secondary indicator you can see a multiframe visualization of selected timeframes of analyzed underlying asset. The multiframe visualization has a few modifications which can be selected in section Indicator Setup.
Input parameters
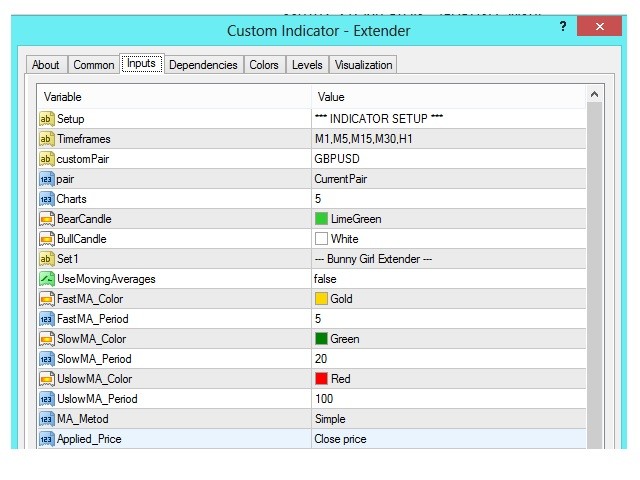
Indicator setup
- Timeframes – definition of selected timeframes for visualization, e.g. M5, M15,H1
- CustomPair – selected underlying asset (pair, stock, index), e.g. GBPUSD
- Pair – there are two selections custom pair or current pair
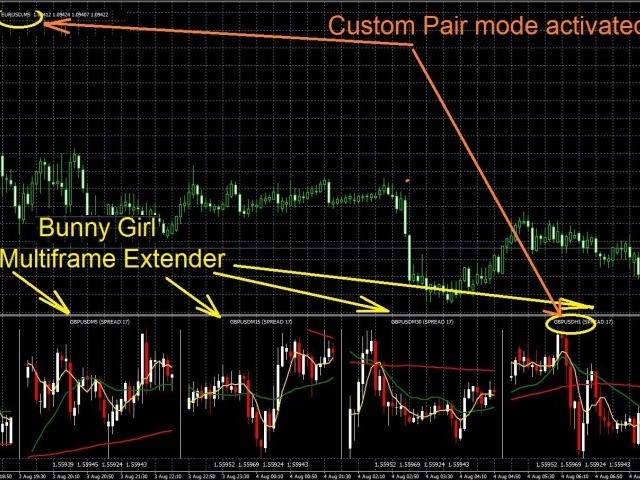
- Custom Pair – you can see multiframe visualization on defined underlying asset in secondary part of graph. Primary part of graph can be used for analyzation of different underlying asset, e.g. primary graph shows GBPUSD and secondary graph show multiframe visualization of EURUSD.
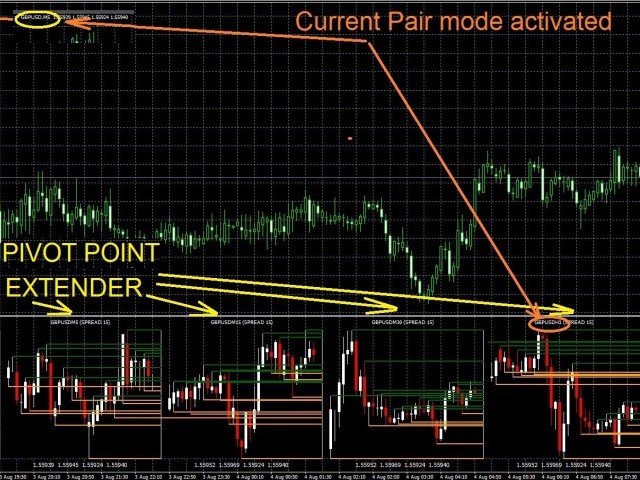
- Current Pair – you can see multiframe visualization automatically on current selected underlying asset defined underlying asset in secondary part of graph. Primary part of graph can be used for analyzation of different underlying asset, e.g. primary graph shows GBPUSD and secondary graph show multiframe visualization of GBPUSD.
- Charts – you can select the number of displayed graphs from 1 to 5.
Bunny Girl Extender
Multiframe visualization of 3 selected Moving Averages (MA) especially suitable for the strategies based on MA monitoring like Bunny Girl strategy.
- UseMovingAverages – activation/deactivation of MA visualization
- FastMA, SlowMA, UslowMA – variable period for MA
- MA_Method – select the mode of averaging, e.g. simple, exponential, weighted
- Applied_Price- select the mode for price calculation, e.g. open Price, close Price
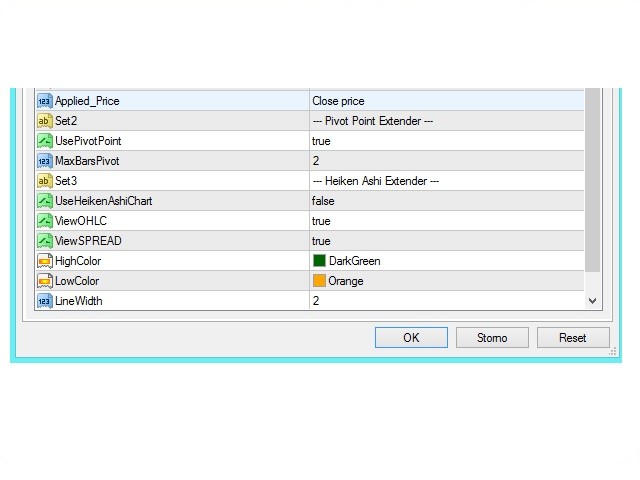
Pivot Point Extender
Pivot Point visualization for a unique opportunity to trace the actual support and resistence on multiframe visualization. You can clearly seen at the same time short time or/and long time investment opportunities.
- UsePivotPoint – activation/deactivation of pivot point visualization
- MaxBarsPivot – pivot point visualization adjustment
Heiken-Ashi Extender
- UseHeikenAshiChart – activation/deactivation of Heiken-Ashi multiframe visualization
Extra
- ShowOHLC – current parameters of open, high, low and close of candles on each selected timeframe
- ShowSPREAD – actual spread between buy and sell price on each selected timeframe