• Overview
  • Reviews (2)
  • Comments (1)

Rsi DA

5

Что такое RSI? 

Индикатор RSI (Relative Strength Index, индекс относительной силы) — это индикатор, который измеряет соотношение восходящих и нисходящих движений. Расчет ведётся таким образом, что индекс выражается в диапазоне от 0 до 100.

Как понять RSI?

Если значение RSI находится равно 70 и больше, считается, что инструмент находится в состоянии перекупленности (ситуация, когда цены выросли выше, нежели того ожидал рынок). Значение RSI на уровне 30 и ниже считается сигналом о том, что инструмент находится в состоянии перепроданности (ситуация, когда цены упали ниже, чем того ожидал рынок). 

Как рассчитывается индикатор RSI?

 
Формула для индикатора RSI состоит из двух уравнений. 
Первое уравнение нужно для получения начального значения относительной силы (RS), которое представляет собой отношение среднего значения цен закрытия при восходящем движении  к среднему значению цен закрытия при нисходящем движении  за период N. 

  • Уравнение 1:     RS = Средняя цена закрытия Up за период N / Средняя цена закрытия Down за период N

  • Уравнение 2:     RSI = 100 - 100 / (1 + RS)


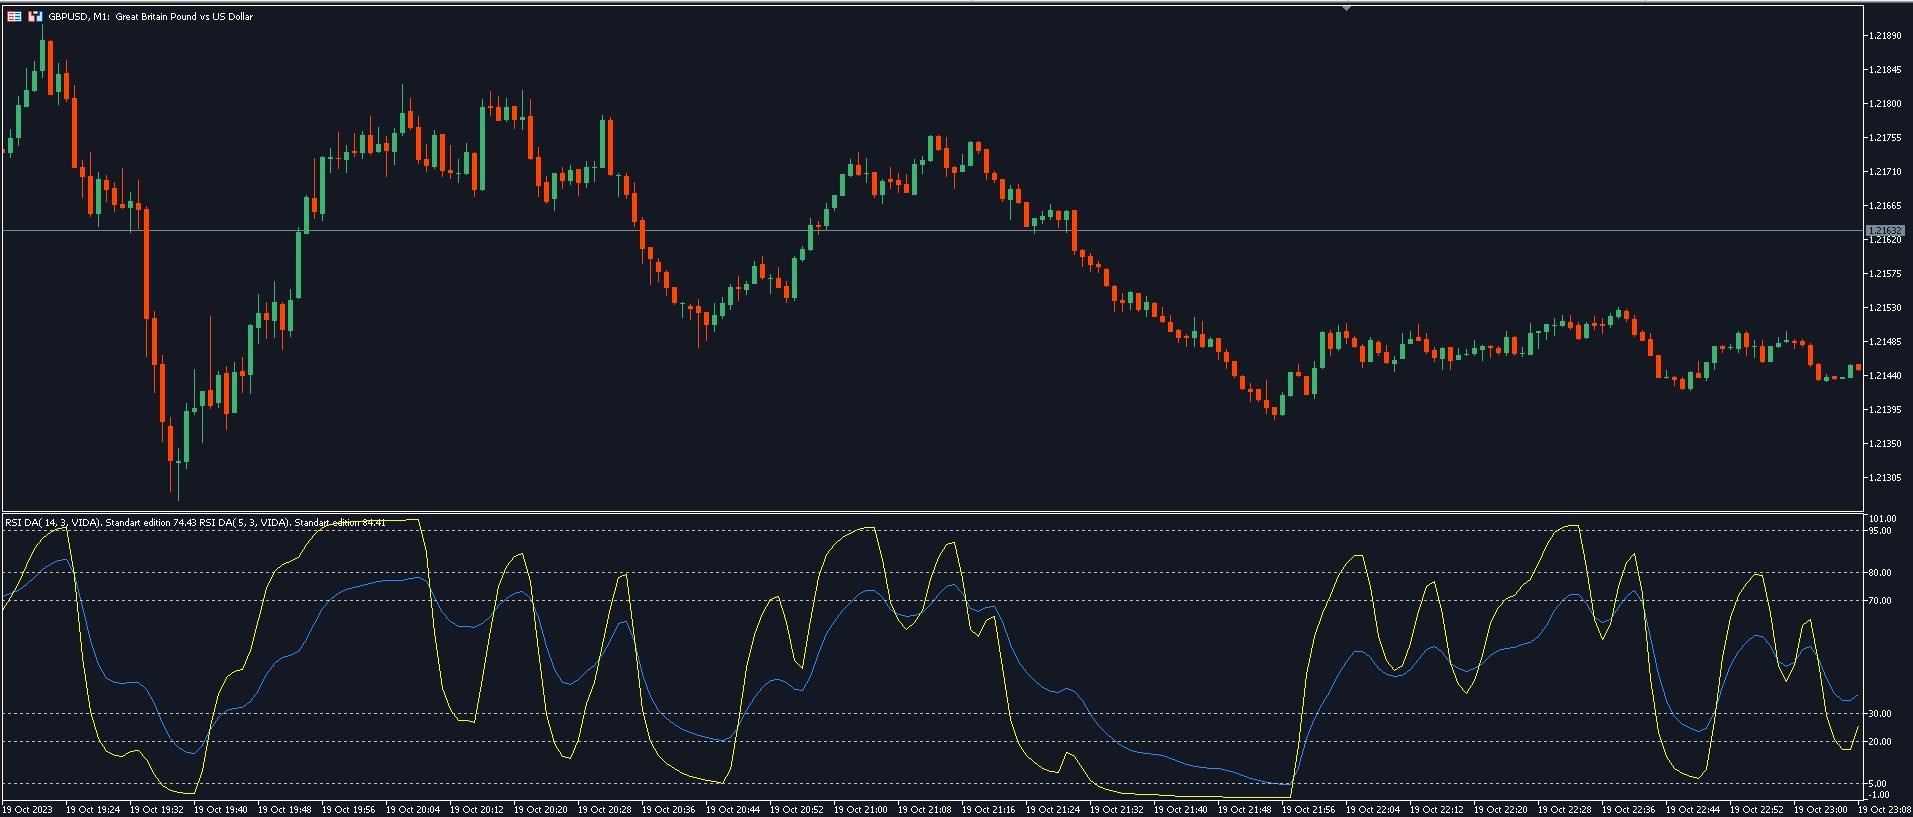
Отличие RSI DA от RSI

При расчете индикатора RSI DA цены пропускаются предварительно через фильтр. Только после этого рассчитываются как простой индикатор RSI.   


Как использовать RSI DA?

ДЛя внутридневной торговли можно использовать RSI DA с короткими периодами в диапазоне 9-11.  При среднесрочной торговле можно использовать периода 14.  Для долгосрочной торговли можно использовать более долгий период (диапазоне 20-30).  Какие настройки выбрать при использовании индикатора RSI DA, зависит от вашей торговой стратегии. 


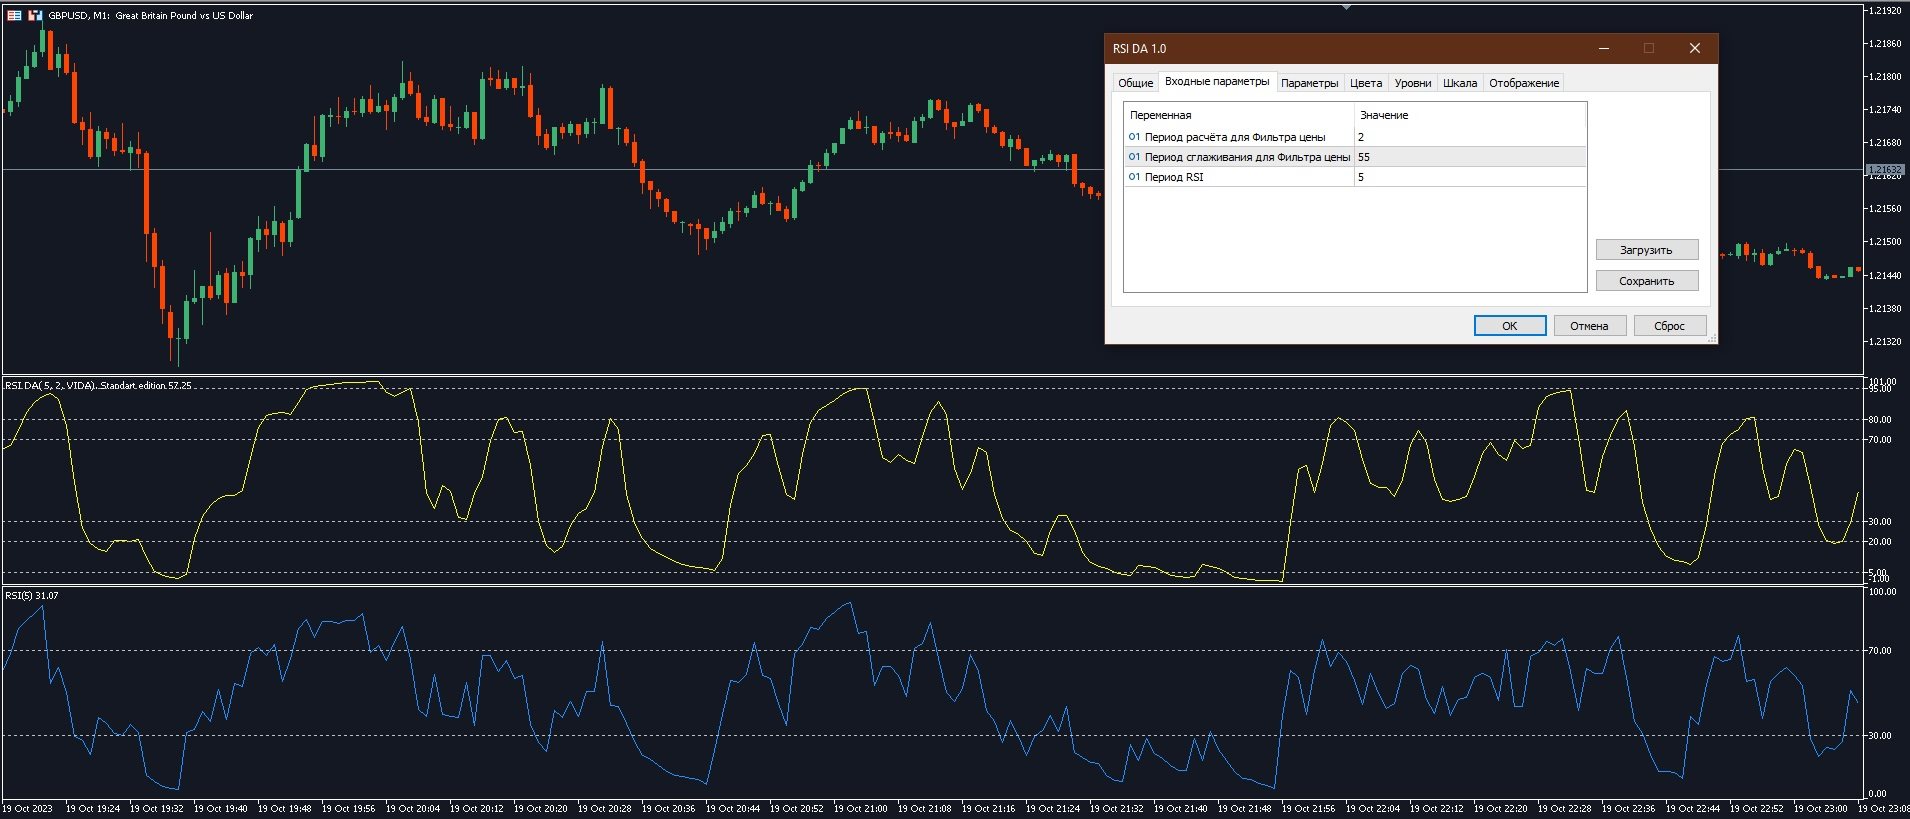
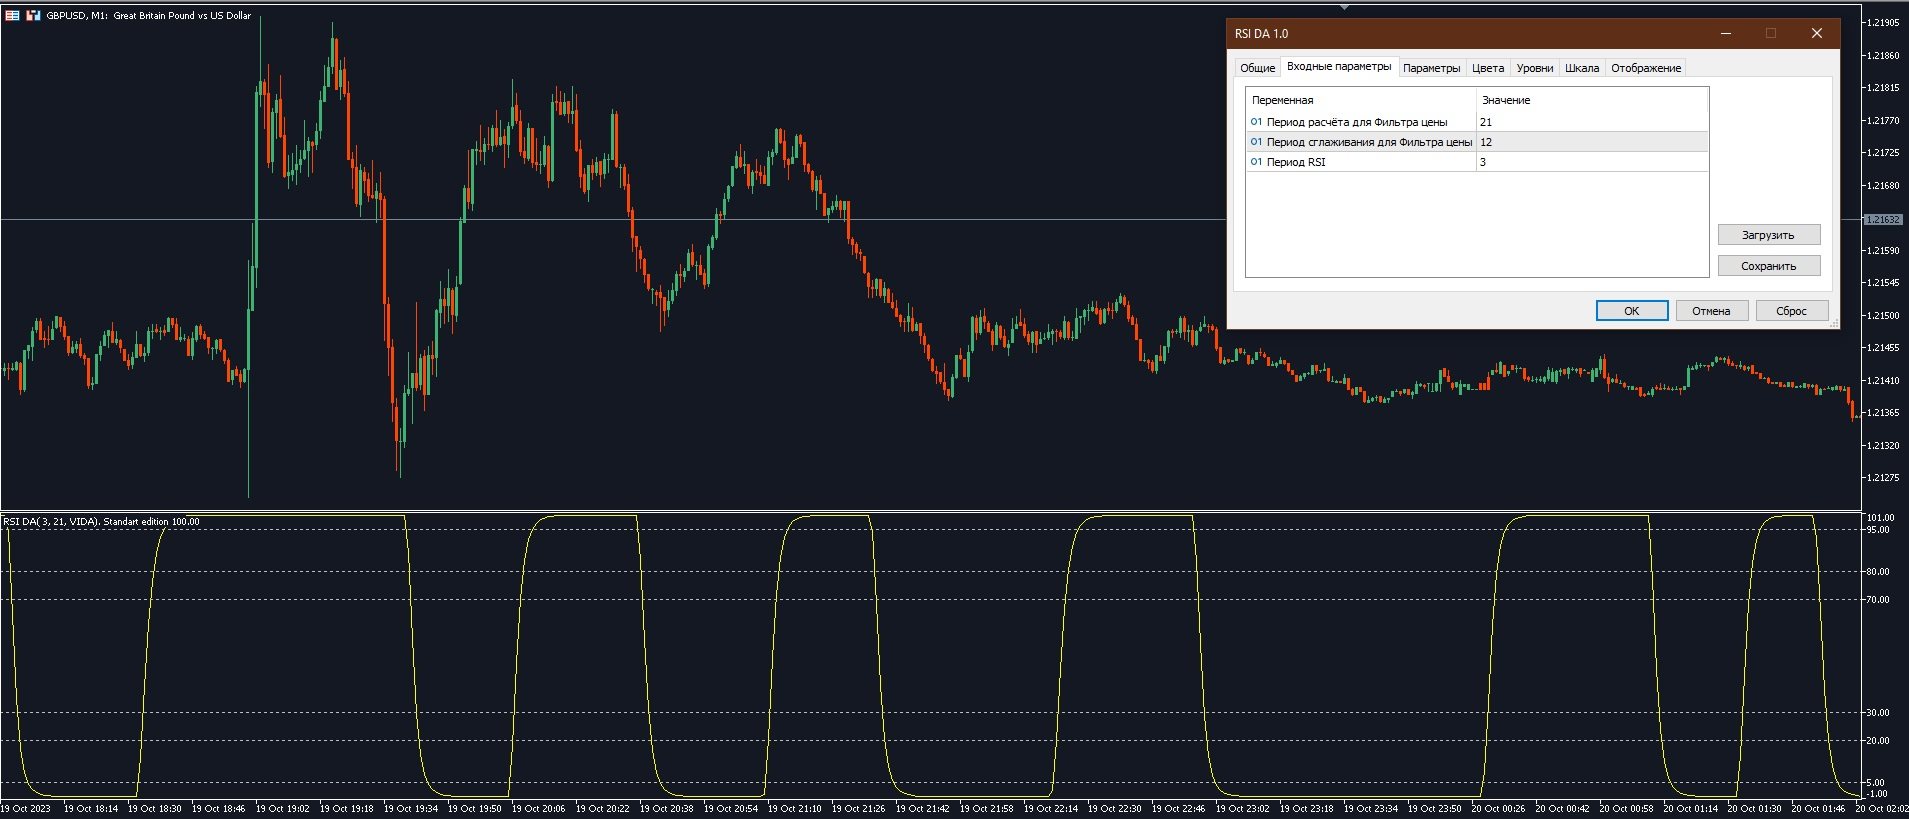
Настройки индикатора:

  • Период расчёта для фильтра цены - это количество баров, участвующих в фильтрации текущего значения индикатора
  • Период сглаживания для фильтра цены - это количество баров, участвующих в сглаживании отфильтрованного значения индикатора
  • Период RSI - это количество баров, участвующих непосредственно в расчете индикатора RSI DA


Reviews 2
Findolin
975
Findolin 2024.03.15 13:20 
 

Ja, ich schließe mich der Bewertung meines Vorredners an. Es macht echt Freude, mit diesem Indikator zu arbeiten, weil er wirklich effizient und deshalb nützlich ist.

Detleff Böhmer
2625
Detleff Böhmer 2024.01.30 16:08 
 

Besser als der alte RSI, gute Arbeit, DANKE!!

Recommended products
Necessary for traders: tools and indicators Waves automatically calculate indicators, channel trend trading Perfect trend-wave automatic calculation channel calculation , MT4 Perfect trend-wave automatic calculation channel calculation , MT5 Local Trading copying Easy And Fast Copy , MT4 Easy And Fast Copy , MT5 Local Trading copying For DEMO Easy And Fast Copy , MT4 DEMO Easy And Fast Copy , MT5 DEMO 砖图 Renko PRO->>>   The display of the brick map on the main map. The Renko chart ideal
FREE
MACD divergence indicator finds divergences between price chart and MACD indicator and informs you with alerts (popup, mobile notification or email) . Its main use is to find trend reversals in the chart. Always use the divergence indicators with other technical assets like support resistance zones, candlestick patterns and price action to have a higher possibility to find trend reversals. Three confirmation type for MACD divergences: MACD line cross zero level Price returns to previous H/L Crea
FREE
AdaptiveCCiMt5
Francis Dube
4 (4)
The Commodity Channel Index computes the deviation of the typical price of each bar from the average price over a particular time period. Multiplying the median deviation by 0.015 facilitates normalization, which makes all deviations below the first standard deviation less than  -100, and all deviations above the first standard deviation more than 100. This adaptive version is based on the indicator described by John Ehlers, in the book Rocket Science for traders. The indicator uses the homodyne
FREE
Returns MT5
Fabrizio Malavasi
This indicator shows the value of returns in the selected time frame They are calculated as logarithm of returns , rather than price or raw returns. For small returns, arithmetic and logarithmic returns will be similar. The benefit of using returns, versus prices, is normalization. It is possible measures all variables in a comparable metric despite originating from price series of unequal values Inputs You can display data both as a Histogram  or a   Line It's also possible to display  the
FREE
MWC COX 5
Joerg Hamann
3.75 (4)
The MWC COX indicator shows the extreme zones of net short/long positions of the Commitments of Traders Report released by the CFTC once a week for four periods of time. Default settings are periods of 12, 26, 52 and 156 weeks. Additional Features Displays the sum of all 4 periods in one line MA, MOM and RSI indicators are integrated ( not in the MQL5 Version 1.0 ) Please make sure that you download the MWC_Demo.zip file and unpack it into   [...]/MQL5/Files   folder.  ->  www.myweeklycot.com/
FREE
FractalEfficiencyIndicator   A ratio between 0 and 1 with the higher values representing a more efficient or trending market,  It is used in the calculation of Perry J. Kaufman Adaptive Moving Average (KAMA), dividing the price change over a period by the absolute sum of the price movements that occurred to achieve that change. The Fractal Efficiency or also known as Efficiency Ratio was first published by Perry J. Kaufman in his book   ‘Smarter Trading‘. This is mostly considered a filter for v
FREE
OsMA DA
Vitaly Dodonov
Что такое OsMA DA?   Индикатор OsMA DA – это осциллятор, который построен на показаниях другого осциллятора – MACD. OsMA DA показывает расхождение между сигнальной линией MACD и его гистограммой. Момент пересечения гистограммы и линии – это нулевая отметка OsMA.   Если гистограмма MACD поднимается выше линии, то гистограмма самого OsMA DA поднимается выше нулевой отметки. В обратной ситуации OsMA DA демонстрирует отрицательные значения.   OsMA DA более узконаправленный индикатор, чем MACD. OsMA
FREE
ZamanCyclesPOC
Mahmoud Sabry Mohamed Youssef
5 (5)
Everyone knows how to analyze the market , which level to buy / sell  this is an easy job , which leads to unusual horrible loses , very little few people knows WHEN then enter the market , time is Money , this is the key!!! This version is a Proof of concept limited version of ZamanCYcles founded here: https://www.mql5.com/en/market/product/81883?source=Site +Market+Product+Page This works Only on 3 Minutes Time frame for 45 Candles Get rest of planets and more than 10 other algorithms to pre
FREE
PZ The Zone MT5
PZ TRADING SLU
5 (1)
This indicator displays buy or sell signals according to Bill Williams' definition of the Trading Zone. [ Installation Guide | Update Guide | Troubleshooting | FAQ | All Products ] Easy to use and understand Avoid trading flat markets Deterministic indicator with clear rules The indicator is non-repainting It implements alerts of all kinds It has straightforward trading implications. A blue arrow is a buy signal A red arrow is a sell signal According to Bill Williams trading in the zone helps t
FREE
Что такое CCI индикатор?    Стандартный Индикатор CCI (Commodity Channel Index) – это осциллятор, который измеряет силу, стоящую за тем или иным движением цены. Он помогает определить, кто находятся у руля: быки или медведи.  Как и многие осцилляторы импульса, CCI работает, сравнивая текущую цену с предыдущими показателями, и на основе этого сравнения он решает, насколько сильное движение цены вверх/вниз.  Как рассчитать CCI? Метод расчета стандартного индикатора представляет собой оригинальн
FREE
An improved version of the standard Standard Deviation indicator. It is now a responsive and smoothed line. The setup is not straightforward - but I hope you can do it. It is very easy to understand the readings of this indicator, the meaning is the same as that of the usual Standard Deviation. //////////////////////////////////////////////// /////////////////////////////////// I hope this indicator will be very useful to you in successful trading. Good luck.
FREE
SSACD - Singular Spectrum Average Convergence/Divergence This is an analogue of the MACD indicator based on the Caterpillar-SSA ( Singular Spectrum Analysis ) method. Limited version of the SSACD Forecast indicator. Limitations include the set of parameters and their range. Specificity of the method The Caterpillar-SSA is an effective method to handle non-stationary time series with unknown internal structure. The method allows to find the previously unknown periodicities of the series and mak
FREE
AdaptiveRSiMt5
Francis Dube
3.67 (3)
The Relative strength index is an oscillator that follows price, it was introduced by Welles Wilder, who went on to recommend the 14 period RSI. This adaptive version is based on the indicator described by John Ehlers, in the book 'Rocket Science for Traders'. The indicator uses the homodyne descriminator to compute the dominant cycle. To apply the homodyne descriminator, real and imaginary parts have to be calculated from the Inphase and Quadrature components. (Inphase and Quadrature components
FREE
This indicator is designed according to the combination of WPR and Stoch indicators, when WPR goes up and Stoc goes up quickly too, the price may meet strong resistance, many times short order will take profit, but if the price  break through it,  Long positions are more likely to be profitable,  and   the   reverse   held   true   as   well. You can adjust the parameters of WPR and Stoc to Adapt the symbol you operate. Click here to look the advanced edition: https://www.mql5.com/en/market/pro
FREE
MWC Ratio 5
Joerg Hamann
3.5 (6)
The Commitments of Traders Ratio Indicator is one of these things you never thought about it before you really see the magic behind it. The indicator shows the Ratio of long/short positions released by the CFTC once a week. If you have a look on the Sreenshot you can see two (three) zones of interest. Important note: MAs are not available in version 1.0. Zone 1: The Switches (Red -> Green, Green -> Red) Zone 2: MA cross Zone 3: If you combine this with the COX indicator an additional zone will
FREE
Necessary for traders: tools and indicators Waves automatically calculate indicators, channel trend trading Perfect trend-wave automatic calculation channel calculation , MT4 Perfect trend-wave automatic calculation channel calculation , MT5 Local Trading copying Easy And Fast Copy , MT4 Easy And Fast Copy , MT5 Local Trading copying For DEMO Easy And Fast Copy , MT4 DEMO Easy And Fast Copy , MT5 DEMO The homeopathic indicator is also called the CCI indicator. The CCI indicator was propos
FREE
A professional tool for trading - the divergence indicator between the MACD and the price, which allows you to receive a signal about a trend reversal in a timely manner or catch price pullback movements (depending on the settings). The indicator settings allow you to adjust the strength of the divergence due to the angle of the MACD peaks and the percentage change in price, which makes it possible to fine-tune the signal strength. The indicator code is optimized and is tested very quickly as p
FREE
ACI Bollinger Bands
Marat Sultanov
4.17 (6)
Tired of adjusting the indicator settings losing precious time? Tired of the uncertainty regarding their efficiency? Afraid of the uncertainty in their profitability? Then the indicator ACI (automatically calibrateable indicator) is designed exactly for you. Launching it, you can easily solve these three issues just performing the simplest action: clicking a single Calibrate button. To achieve the highest efficiency, you should perform another additional action: move the power slider to the maxi
FREE
SSA Stochastic Limited Edition
Roman Korotchenko
4.25 (4)
An analogue of the Stochastic oscillator based on algorithms of singular spectrum analysis (SSA) SSA is an effective method to handle non-stationary time series with unknown internal structure. It is used for determining the main components (trend, seasonal and wave fluctuations), smoothing and noise reduction. The method allows finding previously unknown series periods and make forecasts on the basis of the detected periodic patterns. Indicator signals are identical to signals of the original i
FREE
Laguerre Filter
Fernando Lahude Ritter
5 (1)
Laguerre Indicator with Gamma Input Overview: The Laguerre Indicator is a sophisticated financial analysis tool designed to provide traders and investors with a dynamic and responsive method to track market trends. Its core functionality is centered around a unique algorithm that adapts to market volatility, offering clearer insights compared to traditional indicators. Key Feature - Gamma Input: Gamma: The sole input for the Laguerre Indicator, 'gamma,' plays a pivotal role in calibrating the i
FREE
MiniMACD
Kiyoshi Mizu Miyabi Nori
4.6 (5)
This is just a MACD with multi symbols, multi timeframes, and multi colors. features. different symbols and timeframes from the main chart. draw main line, signal line, and histogram. each line can be erased. the ascent and descent can be distinguished.  Due to the above features, this MACD is suitable for multiple lineups in a single chart. This can be used in the same way as MiniCandles.  
FREE
The indicator detects and displays М. Gartley's Butterfly pattern. The pattern is plotted by the extreme values of the ZigZag indicator (included in the resources, no need to install). After detecting the pattern, the indicator notifies of that by the pop-up window, a mobile notification and an email. The pattern and wave parameters are displayed on the screenshots. The default parameters are used for demonstration purposes only in order to increase the amount of detected patterns. Parameters
Follow The Line MT5
Oliver Gideon Amofa Appiah
4.42 (31)
This indicator obeys the popular maxim that: "THE TREND IS YOUR FRIEND" It paints a GREEN line for BUY and also paints a RED line for SELL. (you can change the colors). It gives alarms and alerts of all kinds. IT DOES NOT REPAINT and can be used for all currency pairs and timeframes. Yes, as easy and simple as that. Even a newbie can use it to make great and reliable trades. NB: For best results, get my other premium indicators for more powerful and reliable signals. Get them here: https://www.m
FREE
RVi Oscillator Breakout
Mohamed Hassan Mohamed Hassan Alsherbiny
5 (1)
Probability emerges to record higher prices when RVi breaks out oscillator historical resistance level. It's strongly encouraged to confirm price breakout with oscillator breakout since they have comparable effects to price breaking support and resistance levels; surely, short trades will have the same perception. As advantage, a lot of times oscillator breakout precedes price breakout as early alert to upcoming event as illustrated by last screenshot. Furthermore, divergence   is confirmed in
FREE
RVi Oscillator Breakout SW
Mohamed Hassan Mohamed Hassan Alsherbiny
Probability emerges to record higher prices when RVi breaks out oscillator historical resistance level. It's strongly encouraged to confirm price breakout with oscillator breakout since they have comparable effects to price breaking support and resistance levels; surely, short trades will have the same perception. As advantage, a lot of times oscillator breakout precedes price breakout as early alert to upcoming event as illustrated by last screenshot. Furthermore, divergence   is confirmed in
FREE
RSI Divergence F
Andrey Dik
4.67 (6)
A professional tool for trading - the divergence indicator between the RSI and the price, which allows you to receive a signal about a trend reversal in a timely manner or catch price pullback movements (depending on the settings). The indicator settings allow you to adjust the strength of the divergence due to the angle of the RSI peaks and the percentage change in price, which makes it possible to fine-tune the signal strength. The indicator code is optimized and is tested very quickly as par
FREE
KeltnerChannelIndicatorMT5
Todd Terence Bates
3 (2)
The Keltner Channel is a volatility-based technical indicator composed of three separate lines. The middle line is an exponential moving average (EMA) of the price. Additional lines are placed above and below the EMA. The upper band is typically set two times the Average True Range (ATR) above the EMA, and the lower band is typically set two times the ATR below the EMA. The bands expand and contract as volatility (measured by ATR) expands and contracts. Since most price action will be encompasse
FREE
A professional tool for trading - the divergence indicator between the  MACD and the price, which allows you to receive a signal about a trend reversal in a timely manner or catch price pullback movements (depending on the settings). The indicator settings allow you to adjust the strength of the divergence due to the angle of the  MACD peaks and the percentage change in price, which makes it possible to fine-tune the signal strength. The indicator code is optimized and is tested very quickly as
FREE
Description by chatGPT: In the dance of flames, a candle transforms, From the close of old, a new light is born. A derivative of candles, changing forms, Unveiling secrets in the flickering morn. Like indicators, patterns do precede, On charts of price, where future paths are sown. The candle's dance, a signal to take heed, Foretelling tales in fiery lines shown. I trust the candlemakers to discern, Using indicators as their guiding light. In every flame, a lesson to be learned,
FREE
Это классический вариант реализации экспоненциальной скользящей средней с коррекций ошибки, какой используется в индикаторах DEMA и TEMA. Соответственно названию, глубина коррекции ошибки увеличена до 33. Индикатор оптимизирован. Потребляет минимально возможные ресурсы. Достаточно быстр, учитывая объёмность вычислений. Может накладываться на другие индикаторы. Как и обычные скользящие средние, nEma_33 не перерисовывается (за исключением нулевого бара). Требуется история > Период*33*33. Согласно
Buyers of this product also purchase
Atomic Analyst MT5
Issam Kassas
5 (15)
First of all Its worth emphasizing here that this Trading Indicator is   Non-Repainting   , Non Redrawing and Non Lagging Indicator   Indicator, Which makes it ideal from both manual and robot trading.  User manual: settings, inputs and strategy . The Atomic Analyst  is a PA Price Action Indicator that uses Strength and Momentum of the price to find a better edge in the market. Equipped with Advanced filters which help remove noises and false signals, and Increase Trading Potential. Using Mult
Quantum Trend Sniper
Bogdan Ion Puscasu
5 (46)
Introducing   Quantum Trend Sniper Indicator , the groundbreaking MQL5 Indicator that's transforming the way you identify and trade trend reversals! Developed by a team of experienced traders with trading experience of over 13 years,   Quantum Trend Sniper Indicator   is designed to propel your trading journey to new heights with its innovative way of identifying trend reversals with extremely high accuracy. ***Buy Quantum Trend Sniper Indicator and you could get Quantum Breakout Indicator fo
First of all Its worth emphasizing here that this Trading System is Non-Repainting   , Non Redrawing and Non Lagging Indicator Which makes it ideal from both manual and robot trading .  Online course, manual and download presets. The Smart Trend Trading System MT5 is a comprehensive trading solution tailored for new and experienced traders . It combines over 10 premium indicators and features more than 7 robust trading strategies , making it a versatile choice for diverse market conditions . Tre
Top indicator for MT5   providing accurate signals to enter a trade without repainting! It can be applied to any financial assets:   forex, cryptocurrencies, metals, stocks, indices .  Watch  the video  (6:22) with an example of processing only one signal that paid off the indicator! MT4 version is here It will provide pretty accurate trading signals and tell you when it's best to open a trade and close it. Most traders improve their trading results during the first trading week with the help of
Gold Stuff mt5
Vasiliy Strukov
4.9 (181)
Gold Stuff mt5 is a trend indicator designed specifically for gold and can also be used on any financial instrument. The indicator does not redraw and does not lag. Recommended time frame H1. Contact me immediately after the purchase to get   personal bonus!  You can get a free copy of our Strong Support and Trend Scanner indicator, please pm. me! Settings  and manual   here   SETTINGS Draw Arrow - on off. drawing arrows on the chart. Alerts -   on off audible alerts. E-mail notification - on of
AT Forex Indicator MT5
Marzena Maria Szmit
5 (4)
The AT Forex Indicator MT5 is a sophisticated trading tool designed to provide traders with a comprehensive analysis of multiple currency pairs. This powerful indicator simplifies the complex nature of the forex market, making it accessible for both novice and experienced traders. AT Forex Indicator uses advanced algorithms to detect trends, patterns and is an essential tool for traders aiming to enhance their forex trading performance. With its robust features, ease of use, and reliable signal
FX Power MT5 NG
Daniel Stein
5 (5)
Trading GOLD, and currencies, with the dog walk strategy  - super smart Trading GOLD, and currencies, with the breakout strategy  - super easy Visit our all-new   Stein Investments Welcome Page   to get the latest information, updates and trading strategies. FX Power MT5 NG  is the next generation of our long-time very popular currency strength meter, FX Power.  And what does this next-generation strength meter offer? Everything you have loved about the original FX Power  PLUS GOLD/XAU st
Trend Screener Pro MT5
STE S.S.COMPANY
4.88 (66)
Unlock the Power of  Trends trading with Trend Screener Indicator: Your Ultimate Trend Trading Solution powered by fuzzy logic and Multi-currencies System ! Elevate your trend trading with Trend Screener, the revolutionary trend indicator powered by   fuzzy logic.  It is a powerful trend-following indicator that combines over  13 premium tools and features and 3 trading strategies  , making it a versatile choice to   make your Metatrader a Trend Analyzer. LIMITED TIME OFFER : Trend Screener Indi
TPA True Price Action indicator reveals the true price action of the market makers through 100% non-repainting signals strictly at the close of a candle! TPA shows entries and re-entries, every time the bulls are definitely stronger than the bears and vice versa. Not to confuse with red/green candles. The shift of power gets confirmed at the earliest stage and is ONE exit strategy of several. There are available now two free parts of the TPA User Guide for our customers. The first "The Basics"
First of all Its worth emphasizing here that this Trading Tool is Non Repainting , Non Redrawing and Non Lagging Indicator , Which makes it ideal for professional trading . Online course, user manual and demo. The Smart Price Action Concepts Indicator is a very powerful tool for both new and experienced traders . It packs more than 20 useful indicators into one , combining advanced trading ideas like Inner Circle Trader Analysis and Smart Money Concepts Trading Strategies . This indicator focus
FX Volume MT5
Daniel Stein
4.94 (17)
Visit our all-new   Stein Investments Welcome Page   to get the latest information, updates and trading strategies. FX Volume is the FIRST and ONLY volume indicator that provides a REAL insight into the market sentiment from a broker's point of view. It provides awesome insights into how institutional market participants, like brokers, are positioned in the Forex market, much faster than COT reports. Seeing this information directly on your chart is the real game-changer and breakthrough solut
Reversal First Impulse levels (RFI)      INSTRUCTIONS        RUS       -       ENG              R ecommended to use with an indicator   -   TPSpro  TREND PRO -  Version MT4                 A key element in trading is zones or levels from which decisions to buy or sell a trading instrument are made. Despite attempts by major players to conceal their presence in the market, they inevitably leave traces. Our task was to learn how to identify these traces and interpret them correctly. Main functi
TPSproTREND PrO MT5
Roman Podpora
4.88 (8)
TPSpro TRENDPRO  - is a trend indicator that automatically analyzes the market and provides information about the trend and each of its changes, as well as giving signals for entering trades without redrawing! The indicator uses each candle, analyzing them separately. referring to different impulses - up or down impulse. Exact entry points into transactions for currencies, crypto, metals, stocks, indices!  -  Version MT4               DETAILED DESCRIPTION               R ecommended to use with
Was: $249  Now: $99   Market Profile defines a number of day types that can help the trader to determine market behaviour. A key feature is the Value Area, representing the range of price action where 70% of trading took place. Understanding the Value Area can give traders valuable insight into market direction and establish the higher odds trade. It is an excellent addition to any system you may be using. Inspired by Jim Dalton’s book “Mind Over Markets”, this indicator is designed to suit the
Profit from market structure changes as price reverses and pulls back. The market structure reversal alert indicator identifies when a trend or price move is approaching exhaustion and ready to reverse. It alerts you to changes in market structure which typically occur when a reversal or major pullback are about to happen. The indicator identifies breakouts and price momentum initially, every time a new high or low is formed near a possible exhaustion point. The indicator draws in a rectangle on
IX Power MT5
Daniel Stein
5 (3)
IX Power   finally brings the unbeatable precision of FX Power to all your trading symbols. It accurately determines the intensity of short, medium and long-term trends in your favourite indices, stocks, commodities, ETFs, and even cryptocurrencies. You can   analyse everything   your terminal has to offer. Try it out and experience how   your timing improves significantly   when trading. Read about our latest strategic development -  Easy scalping with IX Power Visit our all-new   Stein Inve
ICT, SMC, SMART MONEY CONCEPTS, SMART MONEY, Smart Money Concept, Support and Resistance, Trend Analysis, Price Action, Market Structure, Order Blocks, BOS/CHoCH,   Breaker Blocks ,  Momentum Shift,   Supply&Demand Zone/Order Blocks , Strong Imbalance, HH/LL/HL/LH,    Fair Value Gap, FVG,  Premium  &   Discount   Zones, Fibonacci Retracement, OTE, Buy Side Liquidity, Sell Side Liquidity, BSL/SSL Taken, Equal Highs & Lows, MTF Dashboard, Multiple Time Frame, BigBar, HTF OB, HTF Market Structure, 
XQ Indicator MetaTrader 5
Marzena Maria Szmit
5 (1)
Step into the realm of Forex trading with confidence and precision using XQ, a cutting-edge Forex indicator designed to elevate your trading game to unprecedented heights. Whether you're a seasoned trader or just stepping into the world of currency exchange, XQ Forex Indicator empowers you with the insights and signals needed to make informed trading decisions. The signal conditions are a combination of three indicators, and XQ Forex Indicator only display  medium and long-term trends . The ind
Blahtech Supply Demand MT5
Blahtech Limited
4.54 (13)
Was: $299  Now: $99   Supply Demand uses previous price action to identify potential imbalances between buyers and sellers. The key is to identify the better odds zones, not just the untouched ones. Blahtech Supply Demand indicator delivers functionality previously unavailable on any trading platform. This 4-in-1 indicator not only highlights the higher probability zones using a multi-criteria strength engine, but also combines it with multi-timeframe trend analysis, previously confirmed swings
Matrix Arrow Indicator MT5
Juvenille Emperor Limited
5 (14)
Matrix Arrow Indicator MT5  is a unique 10 in 1 trend following   100% non-repainting  multi-timeframe indicator that can be used on all symbols/instruments:   forex,   commodities,   cryptocurrencies,   indices,   stocks .  Matrix Arrow Indicator MT5  will determine the current trend at its early stages, gathering information and data from up to 10 standard indicators, which are: Average Directional Movement Index (ADX) Commodity Channel Index (CCI) Classic Heiken Ashi candles Moving Aver
Advanced Supply Demand MT5
Bernhard Schweigert
4.53 (15)
Best Solution for any Newbie or Expert Trader! This indicator is a unique, high quality and affordable trading tool because we have incorporated a number of proprietary features and a new formula. With this update, you will be able to show double timeframe zones. You will not only be able to show a higher TF but to show both, the chart TF, PLUS the higher TF: SHOWING NESTED ZONES. All Supply Demand traders will love it. :) Important Information Revealed Maximize the potential of Advanced Suppl
Bill Williams Advanced
Siarhei Vashchylka
5 (7)
Bill Williams Advanced is designed for automatic chart analysis using Bill Williams' "Profitunity" system. The indicator analyzes four timeframes at once. Manual (Be sure to read before purchasing) Advantages 1. Automatically analyzes the chart using the "Profitunity" system of Bill Williams. The found signals are placed in a table in the corner of the screen. 2. Equipped with a trend filter based on the Alligator indicator. Most of the system signals are recommended to be used only accordi
Legacy of Gann for MT5
Pavel Zamoshnikov
5 (6)
The indicator very accurately determines the levels of the possible end of the trend and profit fixing. The method of determining levels is based on the ideas of W.D.Gann, using an algorithm developed by his follower Kirill Borovsky. Extremely high reliability of reaching levels (according to K. Borovsky  - 80-90%) Indispensable for any trading strategy – every trader needs to determine the exit point from the market! Precisely determines targets on any timeframes and any instruments (forex, met
This dashboard shows the latest available   harmonic patterns   for the selected symbols, so you will save time and be more efficient /   MT4 version . Free Indicator:   Basic Harmonic Pattern Indicator columns Symbol:  the selected symbols will appear Trend:   bullish or bearish Pattern:  type of pattern (gartley, butterfly, bat, crab, shark, cypher or ABCD) Entry:  entry price SL:  stop loss price TP1:   1st take profit price TP2:  2nd take profit price TP3:  3rd take profit price Current
Introducing   Quantum Breakout PRO , the groundbreaking MQL5 Indicator that's transforming the way you trade Breakout Zones! Developed by a team of experienced traders with trading experience of over 13 years,   Quantum Breakout PRO   is designed to propel your trading journey to new heights with its innovative and dynamic breakout zone strategy. Quantum Breakout Indicator will give you signal arrows on breakout zones with 5 profit target zones and stop loss suggestion based on the breako
Easy By Sell is a market indicator for opening and closing positions. It becomes easy to track market entries with alerts. It indicates trend reversal points when a price reaches extreme values ​​and the most favorable time to enter the market. it is as effective as a Fibonacci to find a level but it uses different tools such as an algorithm based on ATR indicators and Stochastic Oscillator. You can modify these two parameters as you wish to adapt the settings to the desired period. My othe
Gartley Hunter Multi
Siarhei Vashchylka
5 (7)
Gartley Hunter Multi - An indicator for searching for harmonic patterns simultaneously on dozens of trading instruments and on all possible timeframes. Manual (Be sure to read before purchasing) | Version for MT4 Advantages 1. Patterns: Gartley, Butterfly, Shark, Crab. Bat, Alternate Bat, Deep Crab, Cypher 2. Simultaneous search for patterns on dozens of trading instruments and on all possible timeframes 3. Search for patterns of all possible sizes. From the smallest to the largest 4. A
Auto Order Block with break of structure based on ICT and Smart Money Concepts (SMC) Futures Break of Structure ( BoS )             Order block ( OB )            Higher time frame Order block / Point of Interest ( POI )    shown on current chart           Fair value Gap ( FVG ) / Imbalance   -  MTF      ( Multi Time Frame )    HH/LL/HL/LH  -  MTF      ( Multi Time Frame )  Choch  MTF      ( Multi Time Frame )  Volume Imbalance     ,  MTF          vIMB Gap’s Power of 3 Equal High
SMCpro
Arief
5 (1)
Currently Price  20% OFF  ( for unlimited use ) Indicator   USER MANUAL , trade setups, solving issues, etc :  Direct Download Here     (  for users only  ) Hello World! Introducing.. SMCpro tool and Indicator for  MetaTrader 5 , a cutting-edge feature designed to revolutionize your trading experience. With innovative ICT Smart Money Concept, you gain unparalleled insight into market dynamics, empowering you to make informed trading decisions like never before. SMC Indicator built on th
Volume by Price MT5
Brian Collard
4.2 (5)
The Volumebyprice.com Indicator for MetaTrader 5 features Volume Profile and Market Profile TPO (Time Price Opportunity). Volume and TPO histogram bar and line charts. Volume Footprint charts. TPO letter and block marker collapsed and split structure charts. Session filtering and grouping. Static, dynamic and flexible range segmentation and compositing methods with relative and absolute visualizations. Graphical layering, positioning and styling options to suit the user's analytic and aesthetic
More from author
Heiken Ashi DA
Vitaly Dodonov
4.5 (2)
Что такое Heiken Ashi?    Heiken Ashi — это метод построения графиков, который можно использовать для прогнозирования будущего движения цены. Он похож на традиционные свечные графики. Однако в отличие от обычного свечного графика, график Heiken Ashi пытается отфильтровать часть рыночного шума для лучшего определения трендовых движений на рынке. Как рассчитать Heiken Ashi? Heiken Ashi использует формулу COHL, которая означает «Закрытие, Открытие, Максимум, Минимум». Это четыре компонента, кото
FREE
Что такое Awesome Oscillator?   Создателем данного индикатора является Билл Вильямс. Этот трейдер разработал собственную торговую систему. Её основой служит постулат: «Рынок движется хаотично. Какие-либо закономерности этого движения вывести довольно сложно, так как многое зависит от психологических факторов.» Поэтому Вильямс разработал собственные инструменты для анализа рынка. Одним из таких инструментов и является индикатор АО. Это осциллятор, который дает возможность выявить силу текущего
FREE
Что такое Stochastic?  Осциллятор стохастик (Stochastic) – это индикатор импульса, который сравнивает конкретную цену закрытия инструмента с его диапазоном максимумов и минимумов за определенное количество периодов.    Основная идея индикатора заключается в том, что импульс предшествует цене, поэтому стохастический осциллятор может давать сигналы о фактическом движении цены непосредственно перед тем, как оно произойдет.   Stochastic является осциллятором с привязкой к диапазону от 0 до 100 (по
FREE
Что такое CCI индикатор?    Стандартный Индикатор CCI (Commodity Channel Index) – это осциллятор, который измеряет силу, стоящую за тем или иным движением цены. Он помогает определить, кто находятся у руля: быки или медведи.  Как и многие осцилляторы импульса, CCI работает, сравнивая текущую цену с предыдущими показателями, и на основе этого сравнения он решает, насколько сильное движение цены вверх/вниз.  Как рассчитать CCI? Метод расчета стандартного индикатора представляет собой оригинальн
FREE
Momentum DA
Vitaly Dodonov
Что такое Momentum DA?  Индикатор Momentum DA- это инструмент техническго анализа, который измеряет скорость, с которой меняются цены активов за определенный период времени.  Является модификацией обчного Momentum.   Основная идея этого индикатора заключается в том, чтобы помочь трейдерам определить возможные точки разворота ценового тренда, определяя моменты ускорения или замедления роста или падения цен.    Он основан на предположении, что быстрое увеличение цены будет вероятно сопровождаться
FREE
MaCD DA
Vitaly Dodonov
Что такое MACD?  Обычный MACD – это осциллятор хотя его часто называют трендовым индикатором, или даже «трендовым осциллятором». Происходит это потому, что MACD строится на основе показаний двух скользящих средних. Чем отличается MACD DA?   В MACD DA используется специальный ценовой фильтр. Только после фильтрации строится индикатор. Гистограмма отображает степень расхождения двух скользящих средних: если одна удаляется от другой, то растут и столбики гистограммы, если сближаются, тогда столбц
FREE
OsMA DA
Vitaly Dodonov
Что такое OsMA DA?   Индикатор OsMA DA – это осциллятор, который построен на показаниях другого осциллятора – MACD. OsMA DA показывает расхождение между сигнальной линией MACD и его гистограммой. Момент пересечения гистограммы и линии – это нулевая отметка OsMA.   Если гистограмма MACD поднимается выше линии, то гистограмма самого OsMA DA поднимается выше нулевой отметки. В обратной ситуации OsMA DA демонстрирует отрицательные значения.   OsMA DA более узконаправленный индикатор, чем MACD. OsMA
FREE
Зачем нужен этот индикатор? Думаю вы замечали каким «хаотичным» может быть дви- жение цены. Бывают периоды, когда цена движется направле- но, почти без коррекций. В такие периоды трендовые страте- гии работают очень хорошо.  Но  как только направленное движение заканчивается, торговая стратегия перестаёт работать. Появляется очень  много ложных сигналов, что приводит к большому количеству отрицательных сделок.  Тогда возникла мысль: «А что если создать индикатор,  который смог бы заменить ценов
FREE
How often have you had to open deals or place pending orders, and then sit at the monitor and wait for the price to behave further? After all, you can miss the right moment and a profitable deal could easily become unprofitable. And all this is due to the fact that they did not tighten the stop loss, did not set a take profit. Or the price movement was so strong and fast that you missed the moment when the pending order was triggered. And then your entire trading plan was disrupted. Orders Inter
Filter:
Findolin
975
Findolin 2024.03.15 13:20 
 

Ja, ich schließe mich der Bewertung meines Vorredners an. Es macht echt Freude, mit diesem Indikator zu arbeiten, weil er wirklich effizient und deshalb nützlich ist.

Detleff Böhmer
2625
Detleff Böhmer 2024.01.30 16:08 
 

Besser als der alte RSI, gute Arbeit, DANKE!!

Reply to review